
Abstract
The noncooperative air pollution reduction model (NCRM) that is currently adopted in China to manage air pollution reduction of each individual province has inherent drawbacks. In this paper, we propose a cooperative air pollution reduction game model (CRM) that consists of two parts: (1) an optimization model that calculates the optimal pollution reduction quantity for each participating province to meet the joint pollution reduction goal; and (2) a model that distribute the economic benefit of the cooperation (i.e., pollution reduction cost saving) among the provinces in the cooperation based on the Shapley value method. We applied the CRM to the case of SO2 reduction in the Beijing–Tianjin–Hebei region in China. The results, based on the data from 2003–2009, show that cooperation helps lower the overall SO2 pollution reduction cost from 4.58% to 11.29%. Distributed across the participating provinces, such a cost saving from interprovincial cooperation brings significant benefits to each local government and stimulates them for further cooperation in pollution reduction. Finally, sensitivity analysis is performed using the year 2009 data to test the parameters’ effects on the pollution reduction cost savings.
Implications: China is increasingly facing unprecedented pressure for immediate air pollution control. The current air pollution reduction policy does not allow cooperation and is less efficient. In this paper we developed a cooperative air pollution reduction game model that consists of two parts: (1) an optimization model that calculates the optimal pollution reduction quantity for each participating province to meet the joint pollution reduction goal; and (2) a model that distributes the cooperation gains (i.e., cost reduction) among the provinces in the cooperation based on the Shapley value method. The empirical case shows that such a model can help improve efficiency in air pollution reduction. The result of the model can serve as a reference for Chinese government pollution reduction policy design.
Introduction
China has recently experienced an air pollution crisis in which many cities are “lost in a haze.” Millions of people are breathing a hazardous cocktail of chemicals every day, resulting in increased rates of heart disease, stroke, respiratory illnesses, birth defects, and cancer (http://www.greenpeace.org/eastasia/campaigns/air-pollution/problems). In December 2013, 104 cities in eastern China and northern China encountered heavy smog and haze. PM2.5 (particulate matter with aerodynamic diameters smaller than 2.5 microns) levels in Shanghai city hit a record on December 1, 2013: an average of 582 µg per cubic meter for the whole city, with the highest level exceeding 700 µg per cubic meter in the Putuo district (http://europe.chinadaily.com.cn/china/2013-12/09/content_17160660.htm).
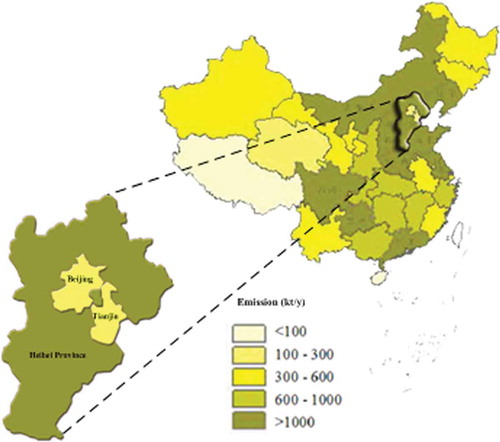
This air pollution crisis has resulted from China’s rapid economic growth in the past few decades (Santosa et al., Citation2008). For many years, the air quality in most urban areas, and especially metropolises, has been far from satisfactory. The levels of pollutants such as NOx, SO2, and PM, have exceeded air quality standards for many years in these zones (Lu et al., Citation2011). Most cities affected by the heavy smog and haze are in and near China’s two largest industrial zones—the Beijing–Tianjin–Hebei region and the Yangtze River Delta region. Areas in the western and northern parts of the country, where economic development fell behind relative to these two growth regions, tended to have less SO2 emission and are less affected by heavy smog and haze (Lu et al., Citation2010).
Air pollution and its reduction are often regional (i.e., transboundary) rather than local. In early 2012, Wang reported that one-third of the airborne PM2.5 in Beijing is transported from adjacent regions (Wang, Citation2011). Similarly, the Shanghai Environmental Protection Bureau reported that one-fifth of the PM2.5 in Shanghai came from other provinces during the heavy smog and haze crisis in December 2013. Cooperation with neighboring provinces in air pollution reduction is necessary. China’s government has recently realized the importance of the cooperation among the adjacent regions in air pollution reduction. Several important plans and regulations about cooperative air pollution control have been issued, such as the “12th Five-Year Plan for Key Areas of Prevention and Control of Atmospheric Pollution” issued by the National People’s Congress on September 27, 2012, and the “Plan of Action for Prevention and Control of Atmospheric Pollution” issued by the Ministry of Environmental Protection of the People’s Republic of China on September 12, 2013. But these plans and regulations encountered many difficulties in the process of implementation since the policymakers mainly adopted the “command and control” approach to push the cooperation without considering adequately and scientifically the economic incentives to the participants.
Experience shows that cooperation helps in pollution reduction. Twenty-one European Union (EU) countries, through the coordination of the Economic Commission for Europe, participated in the international effort of the 1985 Helsinki Protocol to Reduce Sulfur Emissions. Taken as a whole, the 21 parties were able to reduce 1980 sulfur emissions by more than 50% by 1993. Joint and coordinated efforts across multiple countries offer the participating parties flexibility and potential cost savings in meeting the obligations contained in the Protocol (Bailey et al., Citation1996). The game aspect of transboundary pollution reduction has been well recognized. Eyckmans (Citation2012) applied cooperative and noncooperative game theory approaches to develop the formation of international environmental agreements in general and for climate agreements in particular. Halkos (Citation1993, Citation1994, Citation1996) proposed a static game model to study the allocation of SO2 emission reductions to control acid rain in Europe. His work showed that cooperation increased pollutant removal and improved the overall benefit. Though cooperation generates benefits, cooperation in pollution reduction does not happen automatically. The problem in achieving cooperation mainly lies in how to allocate the cooperation benefit. Zhao (Citation2009) established a model of collective cooperation in water pollution control across regional boundaries in a Chinese river basin. In his work, the cooperation benefit was equally shared among the participants. This method didn’t consider that participants contribute differently in pollution reduction cooperation. To fairly allocate the cost of pollution reduction among the participants, Dinar and Howitt (Citation1997) proposed a static game model, which was further modified to a dynamic game model using Shapley value allocation (Petrosjan and Zaccour, Citation2003). Methods used to solve such cooperative multiplayer game problems include the Shapley value method, the core method, the cost gap allocation method, and the minimum costs–remaining savings method (Chen and Hou, Citation1999). Tan et al. (Citation2011) established a two-party cooperative game model between power plants and their fuel suppliers, and applied the Shapley value method to distribute the cooperation benefit. Integrated assessment modeling (IAM) combines diverse scientific disciplines for assessing the ecological, social, and economic effects of decisions and providing the guidance of effective management (Intergovernmental Panel on Climate Change [IPCC], Citation1996). IAM is a comprehensive framework to achieve the optimized emission abatements decision in consideration of sectors, pollutant-specific costs, and resulting air quality exposure and therefore reductions on health and ecosystems burdens (Jakeman and Letcher, Citation2003). The IAM activities carried out in the Clean Air for Europe Program were launched in Europe in the previous decade. GET (Global Energy Transition) or GET-LFL (Global Energy Transition, Limited Foresight with endogenous Learning) models are for cost minimization (Jaeger et al., Citation2002). These models are at a very detailed level, most of which consider the time-series pollutant reduction quantity taking into account technology improvement, discount rate, and so on. There is no consideration of interprovince cooperation. The mechanisms for pollution reduction IA modeled include quantity-based mechanisms (tax policies) and price-based mechanisms (trading policies). But the command-and-control mechanism, which is now used by the Chinese government, is not now modeled by integrated assessment (IA) (Wei et al., Citation2013).
Some researches urge that the use of “market-based” instruments such as emissions trading is better than the prescriptive “command-and-control” approach to address environmental problems (Stavins, Citation1998). Cramton and Kerr (Citation2002) claimed that an auction of carbon permits would provide reliable price discovery for carbon permits. The Chicago Climate Futures Exchange (CCFE) in the United States was the first marketplace for environmental derivatives and financial instruments. The CCFE has been trading in futures and options contracts for SO2 and NOx emission credits since 2003. Chinese environmental authorities showed interest in applying tradable discharge permits (TDP) as a regulatory instrument to reduce pollutant emissions. However, environmental professionals in China do not have experience in designing and managing TDP systems. Cao and Ikeda (Citation2005) suggested that the Chinese government could start with an interzonal tradable discharge permit system. Many factors affect the implementation of emission trading programs, such as the shortage of supporting laws and rules, lack of emission trading market, and lack of an inclusive pollutant monitoring and measuring system. Under such circumstance, market-based instruments will not be widely available in the near future. A trading system is difficult to implement without precise emission data in detail. China is now establishing inclusive environment monitoring system. In 2012, China had built 74 air quality monitoring stations in major cities. As of 2014, 190 cities have air quality monitoring stations and publish daily air quality information. It is expected that in 2015, 333 air quality monitoring stations will be completed in cities at prefecture level and above (http://www.gov.cn/zwgk/2011-12/20/content_2024895.htm).
As a result, the Chinese government still needs to encourage interprovincial cooperation in air pollution reduction. Currently, administrative measures are applied to establish cooperation. However, administrative measures do not generate expected results. Questions like how to coordinate the allocation of emission reduction quantities and how to distribute the economic benefit of cooperation fairly need to be addressed. Economic incentive could naturally enhance cooperation. In this study we propose a cooperative model that can calculate the optimal pollution reduction quantity for each province and allocate cooperation benefit fairly. Although many studies use cooperative games in pollution reduction, we didn’t find any previous research applying the Shapley value method to tackle China’s interprovincial air pollution reduction cooperation. The result of the model can serve as a reference for Chinese government pollution reduction policy design. Moreover, the model framework can be easily expanded to also consider interprovincial decisions such as assignment of emission permits among enterprises in each province.
Materials and Methods
In China, currently, the central government sets the total pollutant emission control target and then assigns the emission quota to individual provinces. The allocation of the emission quota is based on local economy, production activities, technologies, and air quality. The worse the air quality in a province, the lower is the pollution emission quota allocated to the province. Ministry of Environmental Protection of the People’s Republic of China (MEPPRC) first set the emission cap. Then according to data supported by local governments, MEPPRC allocates the emission quota to each individual province. Each province must comply with the pollution emission quota, which means each province cannot emit more pollutant than the quota. Such pollution control practice is referred to as a noncooperative air pollution reduction model (NCRM) in this paper.
The NCRM suffers from two major problems. First, because of the significant differences in pollution reduction technology, industrial structure, and corporate ownership across provinces, the costs of pollution reduction vary markedly from one province to another. Second, some provinces may have idle pollutant treatment capacity while other provinces suffer from insufficient pollutant treatment capacity. As a result of lacking interprovincial cooperation in pollution reduction in NCRM, the current air pollution reduction scheme practiced in China is less than ideal in terms of cost-effectiveness and the efficiency utilization of social resources.
We propose a cooperative air pollution reduction model (CRM) in which provinces can cooperate to achieve the total air pollutant emission target set by the central government. The CRM consists of two parts: an optimization model to calculate the optimal air pollution reduction quantity for each province to minimize the overall pollution reduction cost for the whole region, and an economic benefit allocation model to fairly allocate the economic benefit of cooperation (pollution reduction cost saving) to the participating provinces. The work seeks minimum cost to achieve the pollution reduction target for the whole region. The current model does not take into account population exposed, atmospheric transport, and so on. In future research, we will include such factors into our model.
The Optimization Model
summarizes the variables and parameters and their definitions that will be used in the optimization model.
Table 1. Definitions of variables and parameters
The environmental cost of a province in a cooperative setting (i.e., allowing interprovincial transfer or trade) is composed of pollution reduction cost and the transfer cost/benefit for abating the pollutant quantity transferred between province i and province j during 1 year (j not equal to i). Shi represents the cost for abating pollutant transferred out from province i (Shi > 0) or the economics benefit for abating pollutant transferred into province i (Shi < 0).
The pollution reduction cost for province i is a function of the volume of exhaust gas emission for this province () and the annual air pollution reduction quantity (
) (Zhao et al., Citation2013),
where ,
, and μi are constants for each province i. These parameters can be determined based on empirical data analysis.
is the cost for abating the pollutant transferred within a region. For the provinces in the region, one transfers pollutant out, and the other(s) will have to receive pollutant. The one that transfers pollutant out incurs transfer cost, while the others that receive pollutant generate economic benefit. Hence, the total transfer cost for the region adds up to zero, that is,
.
As a result, the total environmental cost for the whole region is not affected by the transfer cost. The total pollution reduction cost function for the whole region is
The environment carrying capacity for a certain pollutant is the maximum quantity the environment could sustain the pollutant to achieve a certain level of air quality that the government deem harmless for the population. The environment carrying capacity of a province is more than the pollution emission quota assigned to the province, as the government will always leave certain buffer. Therefore, the environment carrying capacity can be formulated as a multiplier of the pollution emission quota assigned to the province:
Each province has its own emission reduction capacity range. When all pollutant treatment facilities in the province work at their full capacity, the maximum pollutant reduction quantity for this province can be achieved. Yet it is still not possible to completely eliminate all the pollutants produced by this province (). This pollutant reduction upper limit is represented as
. On the other hand, the pollutant treatment facilities will always be able to remove at least some of the air pollutants produced in this province. This pollutant reduction lower limit is represented as
. Therefore, the pollution reduction capacity range for a province is as follows:
The sum of pollutant emissions from all the provinces should be less than or equal to the target set by the central government. Therefore, we obtain the constraint
which satisfies
The optimization model is as follows:
The model imposed the condition of minimum abatement costs subjected to three conditions: (1) For each province, the actual emission quantity must be smaller than the environment carrying capacity (eq 9); (2) for each province, pollutant reductions are within the pollution reduction feasibility range (eq 10); and (3) for China (or the whole region in question), the pollution reduction quantity meets the total quota (eq 11).
The optimal pollutant reduction quantity for each province can be obtained by solving the preceding optimization problem. Compared to the NCRM, this optimization model ensures a minimum pollution reduction cost at the national level, by promoting interprovincial cooperation that satisfies the principle of collective rationality. However, in the optimization model, some provinces incur higher cost due to the extra emission reduction burden transferred from other provinces (i.e., providing more environment carrying capacity,) while their counterparts incur lower pollution reduction cost as these provinces are able to use environment carrying capacity from others. Therefore, the overall optimum may not represent economic rational behavior for some individual provinces. Thus, a mechanism to allocate the benefit from cooperation in pollution reduction is necessary for the CRM to satisfy individual rationality; that is, each individual province has its own economic incentive to cooperate.
Benefit Allocation Model
In the optimization model, provinces meet the national pollution reduction target through cooperative efforts. Denote the total optimal pollution reduction cost in CRM as In the noncooperative pollution reduction model, each province achieves its individual pollution reduction target without cooperation. The total pollution reduction cost for the nation in the NCRM is
. Thus, (
) represents the benefit from the cooperation. The allocation of this benefit greatly affects implementation of CRM.
Set as the collection of the m provinces in mainland China. For any subset of N, s (any combination of m provinces), if there exists a real-valued function
that satisfies
,
, where
, then
is the cooperation strategy for the m provinces, V is the characteristic function for the strategy, and
is the benefit of the cooperation of provinces in subset s. The Shapley value, denoted by
, represents an interprovincial cooperative game benefit allocation strategy that can be a weighted distribution based on the characteristic function
, which is referred to as
where is the number of elements (cooperating provinces) in subset s,
is the weighed factor, and
is the cooperation benefit that does not include province i. In this way, the cooperation benefit is allocated to each participant according to each participant’s contribution. The participant who contributes most is rewarded most. Each participant gains economic benefit from the cooperation. As a result, the economic benefit could serve as an incentive to encourage cooperation among participating provinces.
Results and Discussion
Case study
According to the statistics of China National Environmental Monitoring Station Center, on January 19, 2012, Beijing’s air quality ranked the worst among 74 monitoring cities. Beijing authorities acknowledged that air pollution is a cross-provincial problem and regional cooperation is needed in air pollution control. Beijing’s effort alone cannot change the situation (Wang, Citation2011). Addressing this issue, in this section we focus on the SO2 pollution reduction problem in the Beijing–Tianjin–Hebei region as a case study using the proposed cooperative air pollution reduction model. SO2 is the main pollutant in China. The Chinese government has been monitoring SO2 emission over time. Therefore, we have relatively high-quality data for SO2 emission.
shows the area for the case study—from 36ºN to 41ºN and 113ºE to 118ºE, including Beijing, Tianjin, and Hebei province. The area is surrounded by Mountain Yan in the north, Mountain Taihang in the west, Bohai bay in the east, and Shandong province in the south. There is little emission inflow from the north, west, and east. Only the adjacent Shandong province might exchange some pollutant with the Beijing–Tianjing–Hebei region. Therefore, we assume such impact from outside to this region is negligible.
Figure 1. The Beijing–Tianjin–Hebei region of China.
To obtain the air pollution reduction cost functions for Beijing, Tianjin, and Hebei province, we collected data on the volume of exhaust gas emissions (), SO2 reduction quantity (
), and cost of air pollutant reduction (
) for the period of years 2003 through 2009 from the China Environmental Statistics Yearbook, as shown in . The data in the China Environment Yearbook are partly from stack measurements and are partly deduced from related data, such as energy consumption, when no in-stack direct monitoring information exists. These data, though not fully precise, are most authorized and can be used as an illustrative case study.
Table 2. Data for the years 2003–2009
summarizes 7 years of statistical data from the China Environment Yearbook. The pollutants reduction cost in the China Environment Yearbook is a comprehensive cost for SO2, PM, and so on. We cannot exclusively obtain the data of SO2 reduction cost directly. Therefore, we have to convert the total pollution reduction cost into SO2 reduction cost. In this converting process, we have considered the cross effects and abatement co-benefits. The calculation method is complicated. For details, refer to Xue and Jian (Citation2013). Based on the data in , the SO2 reduction cost functions with and
for Beijing, Tianjin, and Hebei province were calculated using eq 2. For the year 2009, we import the volume of the exhaust gas (
) into eq 2 and derive the following SO2 reduction cost functions only with respect to
:
According to China’s situation, and
are estimated as 0.4 and 0.9, respectively. Enterprises and public institutions in each province usually have their own decontamination equipment, and they are required by state regulations to treat at least some proportion of the pollutants they generate. When this proportion is low, the pollutants are usually easy to reduce and the corresponding reduction cost is also low. Therefore, provinces prefer to treat these pollutants themselves. When the proportion reaches 40% and above, the reduction cost will increase significantly. Therefore,
, the lower bound of pollutant reduction capacity, is set at 40%. No matter how much equipment one province has, it is not possible to reduce all the pollutants. Therefore, we set the upper bound of pollutant reduction capacity
as 90%. As mentioned earlier, the Chinese government will leave some buffer for environment capacity when assigning the pollutant emission quota. This is represented by the multiplier
in our model. With the concern for economic growth, the level of
will not be too high. Assuming
to be 1.3 is reasonable, which means the environment carrying capacity is 1.3 times the emission quota (Zhao et al., Citation2013).
Sensitivity analysis for these parameter settings are discussed later. Plugging these parameters in the optimization model already developed, we derive the model for Beijing–Tianjin–Hebei region in 2009 as the following:
Solving this optimization problem, we can work out the optimal pollution reduction quantity for Beijing, Tianjin, and Hebei province. In we compare the resulting cooperative SO2 reduction quantities and pollution reduction costs with those determined by the NCRM model in 2009.
Table 3. A comparison of SO2 reductions between cooperative and noncooperative models for 2009
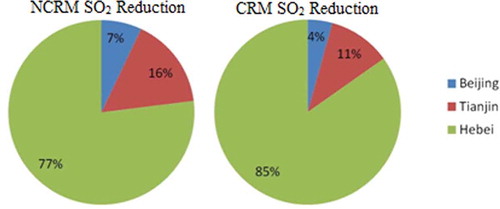
In , we can see that the total pollution reduction quantity remains the same. Beijing and Tianjin reduce less pollutant while Hebei province reduces more. shows that the SO2 reduction quantities for Beijing and Tianjin reduce from 7% to 4% and from 16% to 11%, respectively. On the other hand, Hebei province increases its SO2 reduction quantity from 77% to 85%. Moreover, the total SO2 pollution reduction cost is US$367.95 million when Beijing, Tianjin, and Hebei act separately without cooperation. When these players choose to cooperate following the CRM, the total cost can be reduced to US$350.07 million. This leads to a benefit of US$17.88 million cost saving, 4.86% of the total pollution reduction cost.
Figure 2. SO2 pollution reduction quantities for each province (expressed as percentage of the total regional pollutant reduction quantity) under the NCRM and the CRM approaches in 2009.
In CRM, based on the benefit allocation strategy of a cooperative game given in eqs 12 and 13, five possible combinations exist for the cooperation among Beijing, Tianjin, and Hebei. We first compute the real-valued function V(s) for all five combinations, and then compute the cooperation benefit excluding province i. Finally, based on the Shapley value method, we calculate the benefit allocation. shows the calculation of benefit allocation to Beijing in 2009.
Table 4. The calculation of benefit allocation to Beijing in 2009
The benefit that should be allocated to Beijing from Tianjin and Hebei can be derived from :
Using the same methodology, we can calculate the benefit to Tianjin XT(V) and Heibe :
summarizes the actual money transfer among Beijing, Tianjin, and Heibe province. Tianjin needs to pay a total of US$29,801.32 K to Beijing and Hebei province. Beijing and Hebei provinces receive US$430.43 K and US$29,370.95 K, respectively.
Table 5. Pollution reduction benefit allocation (K USD)
As shown in , line (A) and line (C), the total pollution reduction cost for the whole Beijing–Tianjin–Hebei region as well that for each individual province are lowered due to the interprovincial cooperation in the CRM scheme. Compared with the NCRM, the CRM effectively improves the resource utilization of Beijing, Tianjin, and Hebei province, thus creating a win–win coordination mechanism for Beijing, Tianjin, and Hebei province.
In the same way, we compute the pollution reduction cost under CRM from year 2003 to year 2009 for the whole Beijing–Tianjin–Hebei region and compare with the pollution reduction cost under NCRM. Results are shown in .
Table 6. Pollution reduction cost saving in CRM in 2003–2009 (K USD)
Obviously, under the CRM model, pollution reduction cost is lower than that under the NCRM model in each year from 2003 to 2009. The cost saving ranges from 4.58% to 11.29%. The economic benefit generated by the CRM model, if fairly distributed (using the proposed Shapley value method), provides value for individual provinces. Thus, the individual provinces have motivation to participate in cooperation.
Sensitivity analysis
The parameters ,
, and
in eqs 9 and 10 are estimated based on China’s situation (Zhao et al., Citation2013).
and
calculate the lower and upper bound of pollutant reduction capacity for each province.
computes the maximum amount of pollutants each province could hold (environment carrying capacity). In the following, we analyze the model result under different parameter setting using the year 2009 data.
As a parameter for the lower limit of pollutant reduction capacity, when increases, the potential to transfer out pollutant reduces, which might lower the cooperation benefits. In this case, when
increases from 0.3 to 0.4, the cost saving merely changed. When
increases to 0.5, the cost saving reduces from 4.86% to 2.61%, a reduction of 86%. When
reaches 0.6, all the pollutants are actually treated locally. Therefore, no cooperation happens and the cost saving is 0%.
is a parameter to calculate the upper limit of pollutant reduction capacity. When
increases, it is possible to treat more pollutants locally, which means a potential to accept more pollutant from other players. Higher cooperation benefit could then be generated. However, in this case, the optimal pollution reduction quantity can be achieved when
is smaller than 0.6. Therefore, the cost savings stay unchanged when
changes from 0.6 to 0.9. Being the multiplier to compute environment carrying capacity for this pollutant,
represents the potential for air pollutant transfer. The bigger
is, the more potential there is to accept air pollutants from other provinces. Therefore, it is reasonable that when
is reduced, the cooperation benefit (cost saving) goes down. When
is reduced from 1.5 to 1.2, the cost saving reduces from 4.95% to 3.83%. If
reaches 1, which means there is no potential for cooperation at all, the cost saving will be zero. In reality, the central government will preserve some environment carrying capacity so that
will be higher than 1 ().
Table 7. The sensitivity result for CRM (K USD)
Conclusion
Environmental impacts often extend beyond borders and affect nearby regions. Collaboration between multiple administration units is a necessity in pollution control. In this study, fully considering the heterogeneity in pollution reduction cost across provinces, we propose CRM that calculates the optimal pollution reduction quantity for each province under cooperation and determines a fair allocation of the cooperating benefit among the participating provinces based on the Shapley value method. We used SO2 reduction in the Beijing–Tianjin–Hebei region as a case study. Results show that the total SO2 reduction cost for the region can be reduced from 4.58% to 11.29% annually during 2003–2009 if the three provinces cooperate instead of acting alone in achieving their emission reduction targets. When such cost saving is fairly allocated to the participating provinces, it translates into considerable savings for each of those provinces, too. The CRM proposed in this study thus provides a practical tool for designing policies that help cost-effective pollution reduction in a Chinese region with many provinces.
To promote the use of CRM-based approaches in air pollution reduction in China or subregions of China, we propose the following policy recommendations:
The establishment of a regional authority for environmental cooperation governance. Government coordination in environmental issues requires organizational support, considering the environmental management approach as an integrated environmental informational and decisional concept (Lupu et al., Citation2012). Transboundary environmental management issues involve a wide range of administrative barriers, which hopefully could be eased through the coordination of a regional authority.
The establishment of an environmental information system for cooperative governance. In order to get more precise result from our model—pollution reduction quantity and economic benefit allocation—we need better data. Transparent information can enhance the collaboration among the participants and improve the efficiency of cooperation.
The establishment of environmental law enforcement. Environmental law enforcement is essential for environmental protection. Environmental law enforcement such as the identification of rights and responsibilities, the institutional arrangements of environment monitoring, and the development of punishment rules is particularly necessary for interprovincial cooperation.
Funding
This study was funded by the National Natural Science Foundation of China (project 71373155), the Chinese Ministry of Education, Humanities and Social Sciences (project 13YJC630196), Shanghai Science and Technology Development Fund (project 14692105800), Hebei Social Science Fund (project HB14GL018), and the Program of Social Development of Metropolis and Construction of Smart City of Shanghai University (project 085SHDX001).
Additional information
Funding
Notes on contributors
Jian Xue
Jian Xue is a postdoctoral student and Longzhen Fan is a research professor at the School of Management, Fudan University, Shanghai, China.
Laijun Zhao
Laijun Zhao is research professor at Sino-US Global Logistics Institute, Shanghai, Jiaotong University, Shanghai, China and Antai College of Economics & Management, Shanghai Jiao Tong University, Shanghai, China.
Longzhen Fan
Ying Qian is an associate professor at School of Management, Shanghai University, Shanghai, China.
Ying Qian
Ying Qian is an associate professor at School of Management, Shanghai University, Shanghai, China.
References
- Bailey, P.D., C.A. Gough, K. Millock, and M.J. Chadwick. 1996. Prospects for the joint implementation of sulphur emission reductions in Europe. Energy Policy 24:507–16. doi:10.1016/0301-4215(96)00031-6
- Cao, H., and S. Ikeda. 2005. Inter-zonal tradable discharge permit system to control water pollution in Tianjin, China. Environ. Sci. Technol. 39:4692–99. doi:10.1021/es0490119
- Chen, W.Y., and D. Hou. 1999. Optimal treatment cost allocation based on multiple person cooperation game in total emission control. Acta Sci. Circum. 19:57–62.
- Cramton, P., and S. Kerr. 2002. Tradeable carbon permit auctions: How and why to auction not grandfather. Energy Policy 30:333–45. doi:10.1016/S0301-4215(01)00100-8
- Dinar, A., and R.E. Howitt. 1997. Mechanisms for allocation of environmental control cost: Empirical Tests of acceptability and stability. J. Environ. Manage. 49:183–203. doi:10.1006/jema.1995.0088
- Eyckmans, J. 2012. Review of applications of game theory to global climate agreements. Rev. Business Econ. Lit. 57:122–44.
- Halkos, G.E. 1993. Sulphur abatement policy: Implications of cost differentials. Energy Policy 21:1035–43. doi:10.1016/S0301-4215(06)80006-6
- Halkos, G. E. 1994. Optimal abatement of sulphur in Europe. Environ. Resource Econ. 4:127–50. doi:10.1007/BF00692200
- Halkos, G.E. 1996. Incomplete information in the acid rain game. Empirica 23:129–48. doi:10.1007/BF00925336
- Intergovernmental Panel on Climate Change, ed. 1996. Climate Change 1995. Contribution of Working Group III to the Second Assessment Report of the IPCC. Cambridge, UK: Cambridge University Press.
- Jaeger, C.C., M. Leimbach, C. Carraro, K. Hasselmann, J.C. Hourcade, A. Keeler, and R. Klein. 2002. Integrated assessment modeling: Modules for cooperation. http://www.feem.it/web/activ/_activ.html
- Jakeman, A.J., and R.A. Letcher. 2003. Integrated assessment and modeling: Features, principles and examples for catchment management. Environ. Model. Software 6:491–501. doi:10.1016/S1364-8152(03)00024-0
- Lu, Z., D.G. Streets, and Q. Zhang. 2011. Sulfur dioxide and primary carbonaceous aerosol emissions in China and India, 1996–2010. Atmos. Chem. Phys. 11:9839–64. doi:10.5194/acp-11-9839-2011
- Lu, Z., D.G. Streets, Q. Zhang, S. Wang, G.R. Carmichael, Y.F. Cheng, C. Wei, M. Chin, T. Diehl, and Q. Tan. 2010. Sulfur dioxide emissions in China and sulfur trends in East Asia since 2000. Atmos. Chem. Phys. 10:6311–31. doi:10.5194/acp-10-6311-2010
- Lupu, M. L., O. Trofin, and N. Trofin. 2012. The environmental performance—Part of management performance. Environ. Eng. Manage. J. 11:393–401.
- Petrosjan, L., and G. Zaccour. 2003. Time-consistent Shapley value allocation of pollution cost reduction. J. Econ. Dynamics Control 27:381–98. doi:10.1016/S0165-1889(01)00053-7
- Santosa, S.J., T. Okuda, and S. Tanaka. 2008. Air pollution and urban air quality management in Indonesia. CLEAN Soil Air Water 36:466–75. doi:10.1002/clen.v36:5/6
- Stavins, R.N. 1998. What can we learn from the grand policy experiment? Lessons from SO2 allowance trading. J. Econ. Perspect. 12:69–88. doi:10.1257/jep.12.3.69
- Tan, Z.F., C. Yu, L. Li, J.H. Yang, and C.K. Cai. 2011. Benefits distribution optimization models of energy-saving and SO2 emission-reducing based on power generation side and supply side’s cooperation. Systems Eng. Theory Pract. 31:1182–90.
- Wang, S. 2011. Three policies to improve air quality. Jinghua Times, November 4, 2011, p. 11. Beijing, China.
- Wei, Y.M., Z.F. Mi, and H. Zhang. 2013. Progress of integrated assessment models for climate policy. Systems Eng. Theory Pract. 33:1905–15.
- Xue, J. 2013. Air Pollution Jointly Prevention and Control of Inter-provincial Mechanism in China. Dissertation, Shanghai University, Shanghai, China, for the degree of doctor in management science.
- Zhao, L. 2009. Model of collective cooperation and reallocation of benefits related to conflicts over water pollution across regional boundaries in a Chinese river basin. Environ. Model. Software 24:603–10. doi:10.1016/j.envsoft.2008.10.002
- Zhao, L., J. Xue, and C. Li. 2013. A bi-level model for transferable pollutant prices to mitigate China’s interprovincial air pollution control problem. Atmos. Pollut. Res. 4:446–53. doi:10.5094/APR.2013.051