
Abstract
This paper evaluates the PM2.5- and ozone-related mortality at present (2000s) and in the future (2050s) over the continental United States by using the Environmental Benefits Mapping and Analysis Program (BenMAP-CE). Atmospheric chemical fields are simulated by WRF/CMAQ (horizontal resolution: 12 × 12km), applying the dynamical downscaling technique from global climate-chemistry model under the Representative Concentration Pathways scenario (RCP 8.5). Future air quality results predict that the annual mean PM2.5 concentration in continental U.S. decreases nationwide, especially in the Eastern U.S. and west coast. However, the ozone concentration is projected to decrease in the Eastern U.S. but increase in the Western U.S. Future mortality is evaluated under two scenarios (1) holding future population and baseline incidence rate at the present level and (2) using the projected baseline incidence rate and population in 2050. For PM2.5, the entire continental U.S. presents a decreasing trend of PM2.5-related mortality by the 2050s in Scenario (1), primarily resulting from the emissions reduction. While in Scenario (2), almost half of the continental states show a rising tendency of PM2.5-related mortality, due to the dominant influence of population growth. In particular, the highest PM2.5-related deaths and the biggest discrepancy between present and future PM2.5-related deaths both occur in California in 2050s. For the ozone-related premature mortality, the simulation shows nation-wide rising tendency in 2050s under both scenarios, mainly due to the increase of ozone concentration and population in the future. Furthermore, the uncertainty analysis shows that the confidence interval of all causes mortality is much larger than that for specific causes, probably due to the accumulated uncertainty of generating datasets and sample size. The confidence interval of ozone-related all cause premature mortality is narrower than the PM2.5-related all cause mortality, due to its smaller standard deviation of the concentration-mortality response factor.
Implications: The health impact of PM2.5 is more linearly proportional to the emission reductions than ozone. The reduction of anthropogenic PM2.5 precursor emissions is likely to lead to the decrease of PM2.5 concentrations and PM2.5 related mortality. However, the future ozone concentrations could increase due to increase of the greenhouse gas emissions of methane. Thus, to reduce the impact of ozone related mortality, anthropogenic emissions including criteria pollutant and greenhouse gas (i.e. methane) need to be controlled.
Introduction
Air pollution contributions from power plant emissions and industry, transportation, and resident sector emissions are becoming serious threats to the environment and to human life. Among these threats, the impact of tropospheric ozone (ground-level ozone) and particle air pollution is the most direct and visible to the public. Breathing unhealthy levels of ozone can trigger severe public health risks to cardiopulmonary and respiratory systems (Kreit et al., Citation1989; White et al., Citation1994; Frischer et al., Citation1999; Jerrett et al., Citation2009). PM air pollution results from a mixture of particles varying in size, species, and origin. In particular, a growing number of research studies have been conducted for fine particles (PM2.5), measuring 2.5 µm in diameter and less. The airborne primary and secondary PM2.5 can be breathed deeply into the lungs, and some of these particles may be even tiny enough to penetrate into the bloodstream (Naser et al., Citation2008), which means PM2.5 can pose more severe health concerns than particles with larger sizes (Dockery et al., Citation1993; Dominici et al., Citation2006; Laden et al., Citation2006; Franklin et al., Citation2006). Substantial health concerns of PM2.5 include premature mortality, acute and chronic bronchitis, acute myocardial infraction, asthma exacerbation, acute respiratory symptoms, emergency room visits, hospital admissions, and work loss days.
Contrary to the many studies just described about the adverse health effects of ozone and PM2.5 based on the past monitoring or modeled data, few studies have been explicitly conducted to analyze the critical relationship between air quality under future climate change and human health. Knowlton et al. (Citation2004) conducted a simulation with the combination of a global model, Goddard Institute for Space Studies (GISS); a regional weather model, MM5 (PSU/NCAR mesoscale model); and an air quality model, CMAQ (Community Multi-scale Air Quality) for a health study across the New York metropolitan region in the 1990s and 2050s under the Special Report on Emissions Scenarios (SRES) A2 scenario. According to the modeling data for the 1990s and 2050s, they found that, along with a projected increase in ozone concentration, ozone-related mortality also increased. Adopting the same framework as Knowlton et al. (Citation2004), Bell et al. (Citation2007) investigated health effects of future changes in ozone concentration across 50 eastern U.S. cities. Holding other factors constant, both hourly and daily maximum averaged 8-hr (MDA8) ozone were projected to increase significantly by the 2050s, indicating that climate change alone could affect the human health detrimentally. West et al. (Citation2007) utilized the LMDz-INCA chemistry–climate model to explore the effects of global ozone concentrations on human health under three scenarios for 2030. They found that MDA8 ozone was projected to decrease under the maximum feasible reduction (MFR) scenario. The study on the health co-benefit showed that the current legislation (CLE) and MFR scenarios would both avoid premature mortalities relative to the SRES A2 scenario. Tagaris et al. (Citation2009) downscaled the global output from GISS using MM5 and CMAQ at 36 km resolution to study changes in both ozone and PM2.5 in the United States for 2050. They showed that the public health over two-thirds of the continent would be adversely affected by the climate-change-driven air pollution, and the health issue induced by PM2.5 would dominate that caused by ozone. Ebi and McGregor (Citation2009) reviewed the past scientific literature about the projection under the Intergovernmental Panel on Climate Change (IPCC) Fourth Assessment Report (AR4) scenarios and summarized that climate change and less stringent emission regulations would be likely to exacerbate the adverse health effect of PM2.5 and ozone.
The future projections chosen in the preceding description were all based on the IPCC AR4 scenarios like SRES A1B, A2, and A1FI. The representative concentration pathways (RCPs) scenarios (Moss et al., Citation2010) were designed to provide a more plausible projection of future socioeconomics, and the Coupled Model Intercomparison Project phase 5 (CMIP5) simulations (Taylor et al., Citation2011) had been conducted to support the latest IPCC Fifth Assessment Report (AR5). West et al. (Citation2013) used the RCP4.5 and its associated reference scenarios to evaluate the global future air quality and human health in 2030, 2050, and 2100. It showed that under RCP4.5, PM2.5 and ozone concentrations would decrease everywhere except in some tropical regions by the end of 2100 and that the strong greenhouse gas mitigation could also help avoid premature deaths over the world. However, as stated in the preceding literature review, the traditional downscaling practices are able to capture the effect of synoptic-scale meteorology on pollutant concentrations but few applications of dynamical downscaling have been done under the new RCP scenarios to evaluate the future air quality and its associated health impacts. In addition, the spatial resolution of regional simulations performed to date is mostly coarser than 30 km, which cannot provide a realistic representation of the atmospheric and topographic circulation (Mass et al., Citation2002, Caldwell et al., Citation2009), as well as the regional pollutant distribution and population exposure. Kim et al. (Citation2015) has recently utilized the downscaling result at 12 km resolution under both RCP4.5 and RCP8.5 to evaluate the ozone-related premature mortality attributed to climate change over the United States. Compared with the global study by West et al. (Citation2013) under the RCP4.5 scenario, the avoided ozone-related mortality in the future is estimated to be much lower in the regional downscaling study. Though West et al. (Citation2013) used the chronic metric and Kim et al. (Citation2015) used the short-term metric, and the population data set was different in these two studies as well, this huge bias in the mortality estimation may still reflect the significant difference between the global scale and regional finer resolution. However, the PM2.5-related mortality is not included in the study of Kim et al. (Citation2015).
This study is thus the first to apply dynamical downscaling to a spatial resolution of 12 km by 12 km over the continental United States domain to evaluate both PM2.5- and ozone-related mortality under the new RCP scenarios. Note that only RCP8.5 scenario is adopted for analysis here, since for the PM precursors, both RCP4.5 and RCP8.5 scenarios project a decrease in the future (Gao et al., Citation2013). In addition, the greenhouse gas emissions of methane increase more than half in the RCP8.5 scenario, which will lead to enhanced ozone concentration in some seasons and cause more health concerns. The Environmental Benefits Mapping and Analysis Program–Community Edition (BenMAP-CE) developed by the U.S. Environmental Protection Agency (EPA) is used to estimate the PM2.5- and ozone-related mortality for the present and future years, as outlined in the following section.
Methodology
To address and analyze the PM2.5- and ozone-related mortality for a given climate scenario, we use models as described next.
Global circulation model—CESM
This state-of-the-art model, Community Earth System Model (CESM version 1.0), was used for the global climate simulation, including four major components: atmosphere, land, ocean, and sea ice. The CESM was run using the finite-volume (FV) dynamical core with a horizontal resolution of 0.9° × 1.25° (latitude/longitude) and 26 vertical layers. The atmospheric chemistry was integrated in the atmosphere component (CAM4) of CESM, referred to as CAM-Chem, and detailed descriptions and evaluations had been documented by Lamarque et al. (Citation2012). Note that an ensemble of climate simulations was common in global studies with relatively coarse spatial resolution, while this was practically hard to conduct for regional climate community. To date, most of the regional climate downscaling studies (Caldwell et al., Citation2009; Qian et al., Citation2010; Gao et al., Citation2012; Gao et al., Citation2014) used one ensemble member. Although one member did not represent the full range of climate simulations, the results from a single member were likely to be within the range of the full ensembles. Indeed, two recent studies (West et al., Citation2013; Hodges et al., Citation2014) both used one model and one member as well, and Hodges et al. (Citation2014) also demonstrated that even using one model with one member, it could represent well the CMIP5 ensembles. Thus, a single set of initial and boundary conditions was adopted in this study.
Regional weather model—WRF
The Weather Research and Forecasting model (WRF 3.2.1; Skamarock and Klemp, Citation2008) was used in the regional climate simulations. The regional simulation domain with a spatial resolution of 12 km by 12 km is shown in and . The WRF results, downscaled from CESM under RCP 8.5, were taken from our previous study (Gao et al., Citation2012). There were three domains in regional WRF simulations, 36 km, 12 km, and 4 km. Only the 36-km and 12-km WRF outputs were used to drive CMAQ simulations, considering the limited computational resource. A 3-year period (2002 to 2004) is used to represent the present year case (2000s), and another 3-year period (2057 to 2059) is used to represent the future case (2050s).
Figure 1. Annual mean PM2.5 concentration averaged (a) from 2002 to 2004 (top column, 2000s) and (b) from 2057 to 2059 (middle column, 2050s). (c) Difference of annual mean PM2.5 concentration between the future year and the present year (bottom column, 2050s–2000s).
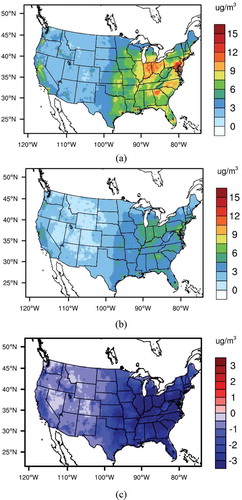
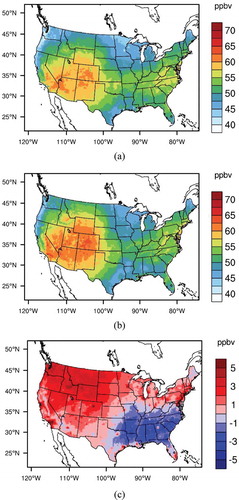
Figure 2. Annual mean MDA8 ozone concentration averaged (a) from 2002 to 2004 (top column, 2000s) and (b) from 2057 to 2059 (middle column, 2050s). (c) Difference of annual mean MDA8 ozone concentration between the future year and the present year (bottom column, 2050s – 2000s).
Regional air quality model—CMAQ
The Community Multi-scale Air Quality (CMAQ) modeling system version 5.0 was used in this study (Byun and Schere, Citation2006). It is a three-dimensional comprehensive atmospheric chemistry and transport model developed by the EPA and the community, and has been widely applied in regional air quality and associated health impact studies (Teschea et al., Citation2006; Lam et al., Citation2011; Shi et al., Citation2012; Buonocore et al., Citation2014). The spatial resolution was kept the same as for WRF, and the initial and boundary conditions for CMAQ were generated from results of CAM-Chem simulations. For the present climate conditions, emissions were based on the EPA National Emission Inventory, while the future projection rates were based on the RCP8.5 scenario. Basically, most of the anthropogenic emissions, including nonmethane volatile organic compounds, sulfate, NOX, and primary PM2.5 and PM10, would decrease in the future. However, the greenhouse gas emissions of methane show significant increase (about 60%) by the end of the 2050s. More details about emission projections of ozone and PM2.5, chemistry downscaling of species mapping, and grid interpolations, together with the evaluation of ozone, have been well documented in Gao et al. (Citation2013).
Health and environmental assessment model—BenMAP-CE
The Environmental Benefits Mapping and Analysis Program–Community Edition (BenMAP-CE 1.0.8; Davidson et al., Citation2007) was utilized in this study to evaluate the PM2.5- and ozone-related mortality for the present and future case. It is a powerful health benefit analysis tool that can estimate the health impacts and economic benefits of human population exposure to air quality (i.e., PM2.5 and ozone concentration) changes. BenMAP-CE has been widely applied at the city and regional scale, both within and beyond the United States (Fann et al., Citation2012; Voorhees et al., Citation2014; Smith and Gans, Citation2014). BenMAP-CE uses a so-called “damage-function” approach to evaluate the health effect associated with the change of air pollutant concentration. It can be quantified by the exponential (log-linear) concentration-response function given here, where the natural logarithm of the health effect rate is a linear function of the air pollutant:
where represents the adverse health effect rates like deaths per year, cancers per year, and hospitalizations per year due to the change of PM2.5 or ozone concentration, and
represents the baseline incidence rate per unit population for the health effect. In the BenMAP-CE data set, a collection of numerous incidence rate data is provided for different ages, genders, and races. The unitless coefficient
represents the fractional increase in the relative risk (RR) of the health effect per unit average concentration or mixing ratio of the pollutant;
represents the difference between the concentration or mixing ratio of the air pollutant in exposure and its threshold concentration. The threshold concentration here is defined as the value below which no health effect occurs (Jacobson, Citation2012). West et al. (Citation2007) suggested that a threshold concentration under 25 ppbv would have very little effect on the total ozone-related mortality and the data set in the BenMAP did not provide a clear threshold value for each health function. Thus, we set the threshold concentration zero for both PM2.5 and ozone in our mortality evaluation. P represents the exposed population.
In BenMAP-CE, the population data are built at the block level and further aggregated to a resolution of 12 km and the county level. The population of the 2010 U.S. Census is set as the base year data set and the ratios of the desired population projection to the base year population are used to scale back to 2000 and forwardsto 2040 at both 12 km resolution and county level. (Woods and Poole Economics, Inc., Citation2012). BenMAP-CE has established a huge library of health impact functions for different health endpoints, including mortality, morbidity, and work loss days. During the calculation process, BenMAP-CE first accesses the selected health impact functions and the data required by the health impact function, which generally includes the baseline incidence rate, the value, and the grid-cell population as shown in eq 1. Then the change of incidence like mortality was calculated for each selected health impact function point by point. These grid-cell level incidence results could be further aggregated to a coarser resolution such as county or state level.
In this study, the health functions we used to evaluate the adverse health effects of PM2.5 and ozone come from the data set “EPA Standard Health Functions” embedded in BenMAP-CE. The endpoint group is mortality, whose rate is specified in detail for different age ranges and variable types such as daily maximum or mean. The detailed information about this data set is summarized in . Note that only the premature mortality (age: 0–64 years) for ozone is evaluated here instead of mortality during the whole year range (0–99 years), in order to be comparable with other previous work (West et al., Citation2007; Silva et al., Citation2013; Kim et al., Citation2015). The PM2.5-related mortality metrics are provided based on the acute effect to the short-term exposure. These short-term metrics, including all-cause mortality, ischemic heart disease, and lung cancer, are also utilized in the recent published work about PM2.5-related mortality (Fang et al., Citation2013; Fang et al., Citation2013; Smith and Gans, Citation2014; Zanobetti et al., Citation2014). For ozone, the annual ozone-related mortality is analyzed here instead of seasonal results, which is also adopted in the other climate study (West et al., Citation2007; Tagaris et al., Citation2009).
Table 1. PM2.5- and ozone-related mortality source in the “EPA Standard Health Functions” data set of BenMAP-CE
In order to evaluate the health impact induced by the change of air pollutant concentration alone and by the combined effects of changed air pollutant concentration, population, and baseline incidence rate, we design two scenarios for separate analyses: (a) The population and baseline incidence rate are held constant at the 2000 level for both present and future cases so that the only factor that can influence the mortality values is the change of air pollutant concentration. (b) The projected population and baseline incidence rate are applied with the changes in air pollution from 2000 to 2050. Therefore, the combined effects of air pollutant concentration, population growth, and mortality incidence rate are considered. This kind of design has already been widely used in the previous work for evaluation (Knowlton et al., Citation2004; Tagaris et al., Citation2009; Post et al., Citation2012). It is worth noting that although BenMAP-CE provides the incidence rate for 2050, there is no population data set available for the same year that is specified for age, gender, and race. We applied the incidence rates of 2050 to the population data sets for 2010, 2020, 2030, and 2040, respectively, at 12 km resolution. Then we aggregated the grid-cell mortality results into the state level. Thus, for each state, we had the mortality values for 2010, 2020, 2030, and 2040. After that, we used third-order polynomials to fit mortality data for every state, got a unique fitting equation, and then extrapolated to 2050 to obtain the state-level mortality estimates.
In addition, to combine of the effects of the same endpoint (i.e., all-cause mortality) but calculated by different health impact functions from various studies, BenMAP-CE allows pooling of the health incidence results by a variety of statistical approaches, including sum, fixed effects, and user-specified weights (Davidson et al., Citation2007). The random effects pooling method is adopted in this study because the variance used to weigh the estimated incidence yields not only the difference derived from different health studies (sampling error), but also the between-study variability coming from the different underlying concentration-response relationship. Thus, it should be more reasonable than simply summing up and averaging the different results equally. Note that only the health functions with the same age range are chosen to do the pooling statistics, in order to avoid the issue of nonoverlap of different age ranges. Also, some endpoints are not pooled here (i.e., ozone-related respiratory mortality and PM2.5-related ischemic heart disease mortality), due to the fact that only one health impact function is available in the data set.
Results and Discussion
Health-related air pollutants over the continental United States for present and future years
PM2.5
The spatial distribution of the 3-year averaged PM2.5 concentrations simulated from WRF-CMAQ over the entire continental United States for the present (2000s) and future (2050s) are presented in and , respectively. For the present-day simulation (), PM2.5 shows much higher concentrations over the eastern United States (i.e., Central region, northern part of Southeast region, and southern part of Northeast region) than the western United States, except for the western coastal areas. The regions with higher PM2.5 concentration are populous areas with considerable emission sources for PM2.5. For the future scenario (), the spatial distribution of PM2.5 concentrations maintains a pattern similar to the present, although the absolute values decline dramatically as shown in . It seems that the Central region, the northern part of Southeast region, and the southern part of the Northeast region, where the PM2.5 concentrations are highest in the 2000s, are projected to undergo a reduction of more than 3 µg/m3 under the RCP8.5 scenario. Other regions present similar decreasing trends of PM2.5 for the future but the magnitudes of the decreases are smaller. Our results are consistent with findings summarized in the IPCC AR5 Working group 1 (WG1) report (Kirtman et al., Citation2013), and the reduction of PM2.5 is mainly attributed to the implementation of stringent air pollution control measures on the emission of PM2.5 precursors like sulfur dioxide, NOX, and black carbon across North America. Considering the current standard for annual mean PM2.5 concentration (12 µg/m3), the whole U.S. continent could achieve this standard by the end of the 2050s under the RCP8.5 projection, even for the regions that are nonattainment areas for PM2.5 in the present year.
Ozone
shows the spatial distribution of the 3-year averaged annual mean daily maximum 8-hr (MDA8) ozone concentration in the 2000s and 2050s, as well as its difference. This indicates that except for the Southeast, southern part of the Central and Northeast regions, and eastern part of the South, the projected annual mean MDA8 ozone concentration increases over the other regions by the end of the 2050s. The changes of seasonal mean surface ozone concentrations between present and future have been evaluated by Gao et al. (Citation2013). Generally, there is a decreasing trend in summer due to reduced anthropogenic nonmethane volatile organic compounds (NMVOCs) and nitrogen oxides (NOX) emissions. However, the methane emission under RCP8.5 is projected to increase by 60% by the 2050s (Riahi et al., Citation2007), triggering ozone increase in spring and winter season. Lamarque et al. (Citation2011) also found out that prominent rise in methane abundances would increase the background ozone level by 5 to 14 ppb over the continental-scale regions by 2100. Other studies have also shown that growing methane abundances can raise the baseline ozone and even offset the effect of aggressive local emission reductions (Fiore et al., Citation2002; Dentener et al., Citation2005; Fiore et al., Citation2008; Gao et al., Citation2013).
Mortality estimation through BenMAP-CE when population and baseline incidence rate are held constant at 2000 level for future
Mortality with exposure to the current and future PM2.5 concentration
The mortality numbers from all causes (after pooling), ischemic heart disease, and lung cancer at present (2000s) are estimated with exposure to the 3-year averaged annual mean 24-hr PM2.5 concentration. a shows the mortality number aggregated at the state level from the 12 km × 12 km grids. The high mortality occurs at the southern part of the Northeast region (Pennsylvania) and northern part of the Central region (Illinois and Ohio), consistent with the relatively high PM2.5 pollution there. The PM2.5 concentration is relatively lower in the western part of the West (California) and southern part of the Northeast (New York State), South (Texas), and Southeast (Florida), but high PM2.5-related deaths are observed as well, due to their large populations. The spatial distributions of mortality for all causes, ischemic heart disease, and lung cancer are similar, but the values vary among them. According to the bar chart, California stands out for the mortality rate from all causes (mean: 8,900 deaths/year, 95% confidence interval [CI]: 6,000–11,700) and lung cancer (1,200 deaths/year, 95% CI: 500–1,800), while New York State has the highest mortality from ischemic heart disease (8,300 deaths/year, 95% CI: 6,900–9,600). Generally, the states with larger population numbers are also subject to higher deaths, according to eq 1. Meanwhile, the maximum death from lung cancer is less than 1,200 cases/year and this is much smaller than the largest mortality from ischemic heart disease (8,300 cases/year), indicating the latter endpoint will cause more distinct health issues under the current PM2.5 exposure. The annual total mortality for the United States for the present case is summarized in . In previous work, Fann et al. (Citation2012) provided an estimation of 130,000 (95% CI: 51,000, 200,000) national PM2.5-related all-cause mortality over the United States in 2005, and Caiazzo et al. (Citation2013) gave an estimation of 200,000 (90% CI: 90,000, 362,000) all-cause mortality over the United States in 2005. Our results fall into their ranges and seem to be underestimated. There are two possible reasons: (1) The study by Fann et al. (Citation2012) used population in 2005, while in our study the year of 2000 is used. (2) The evaluation of regional model simulation for PM2.5 is shown in . Note that observations from the Air Quality System (AQS, http://www.epa.gov/ttn/airs/airsaqs/detaildata/downloadaqsdata.htm) are used to evaluate the present climate period from 2001 to 2004. There are three groups of metrics: mean fractional bias/mean fractional error (MFB/MFE), normalized mean bias/normalized mean error (NMB/NME), and mean normalized bias (MNB) and mean normalized error (MNE). Based on the EPA (2007), the benchmarks of MFB/MFE are ±30/50 for PM2.5 and it turns out both MFB and MFE are close to the benchmark, indicating relatively good performance of PM2.5 concentrations. It also suggests an underestimate of PM2.5 concentration from the downscaling output, which can lead to a lower estimate of PM2.5-related mortality here.
Table 2. National PM2.5- and ozone-related mortality in the 2000s and 2050s with baseline incidence rate and population held constant (rounded to the nearest 100)
Table 3. Evaluation of model output for PM2.5 from 2001 to 2004 (mean fractional bias/mean fractional error [MFB/MFE], normalized mean bias/normalized mean error [NMB/NME], and mean normalized bias [MNB] and mean normalized error [MNE])
Figure 3. PM2.5-related all-cause (after pooling), ischemic heart disease and lung cancer mortality in (a) the 2000s and (b) the 2050s with population and baseline incidence rate held constant at 2000 level; (c) PM2.5-related all-cause (after pooling), ischemic heart disease, and lung cancer mortality in the 2050s with projected baseline incidence rate and population. The error bars represent the 95% confidence interval of each incidence for different states.
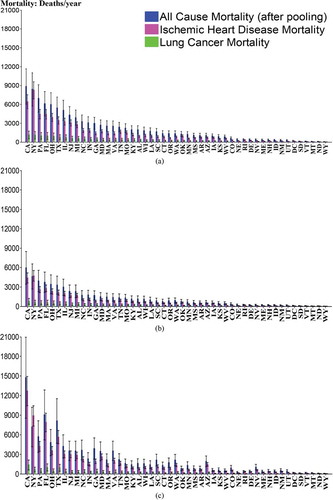
shows the PM2.5-related all-cause (after pooling), lung cancer, and ischemic heart disease mortality in the 2050s. It turns out that California again has the highest mortality numbers for the all-cause and lung cancer mortality (6,000 all-cause deaths/year, 95% CI: 3,400–8,500; 800 lung cancer deaths/year, 95% CI: 300–1,200) and New York State still has the largest ischemic heart disease mortality (4,700 ischemic heart disease deaths/year, 95% CI: 3,900–5,500), but the values are much smaller than those in the 2000s. Overall, the entire continental United States shows a decreasing trend for the all-cause, ischemic heart disease, and lung cancer mortality by the end of the 2050s. Recalling that all the continental states are estimated to encounter a dramatic reduction of PM2.5 concentration under RCP8.5 scenario, this change is expected since we hold the population and baseline incidence rate as constant. The mortality value is thus only influenced by the PM2.5 concentrations. The national PM2.5-related mortality in 2050s is also summarized in , with 41.3% reduction of all-cause mortality, 39.6% reduction of ischemic heart disease mortality, and 40.5% reduction of lung cancer mortality in comparison with the values in the 2000s.
Mortality with exposure to the present and future ozone concentration
Our recent work (Kim et al., Citation2015) evaluated the nonaccidental premature mortality associated with MDA8 ozone by averaging the 12 × 12 km grid of ozone concentration at the county level first and then applying it to the population projections developed by the Integrated Climate and Land-Use Scenarios (ICLUS) project. Here we adopted more health functions provided in BenMAP-CE for all-cause and nonaccidental premature mortality and two additional premature mortality metrics (cardiopulmonary and respiratory mortality) to expand the study scope. We also applied the 12-km ozone directly to the 12-km population data set built in BenMAP-CE. a shows the all-cause, nonaccidental, cardiopulmonary, and respiratory premature mortality with exposure to the 3-year averaged annual mean MDA8 ozone concentration in the 2000s. The spatial distribution of premature mortality is similar to that of PM2.5, where states with dense population have higher mortality under the current ozone concentration exposure. The bar chart of different premature mortality metrics shows that California suffers the highest ozone-related premature deaths over the U.S. continent, resulting from all-cause (2,700 deaths/year, 95% CI: 1,300–4,000), nonaccidental (600 deaths/year, 95% CI: 200–1,700), cardiopulmonary (600 deaths/year, 95% CI: 200–900) and respiratory (400 deaths/year, 95% CI: 200–700) mortality. Different from PM2.5, Texas ranks in second place with all-cause (2,000 deaths/year, 95% CI: 1,000–3,000), nonaccidental (500 deaths/year, 95% CI: 100–1,300), cardiopulmonary (400 deaths/year, 95% CI: 200–700), and respiratory (400 deaths/year, 95% CI: 100–600) premature mortality. In addition, shows that the exposure to the 3-year averaged annual mean MDA8 ozone concentration for the present case contributes to a higher cardiopulmonary than respiratory premature mortality over the entire continental U.S. states except in seven states (Colorado, Washington, Oregon, New Mexico, Utah, Maine, and Wyoming). Recalling , exposure to the 3-year averaged annual mean 24-hr PM2.5 concentration in the present case also causes much more severe health concerns from the ischemic heart disease rather than for the lung cancer aspect. However, the ozone-related cardiopulmonary premature mortality accounts for members in the age range from 0 to 64 years, while that for respiratory premature mortality only covers the age range from 30 to 64. Thus, the difference of death numbers between these two premature mortality metrics here may not be that large.
Figure 4. Ozone-related all-cause (after pooling), nonaccidental (after pooling), cardiopulmonary and respiratory premature mortality in (a) the 2000s and (b) the 2050s with population and baseline incidence rate held constant at 2000 level; (c) ozone-related all-cause (after pooling), nonaccidental (after pooling), cardiopulmonary and respiratory premature mortality in the 2050s with projected baseline incidence rate and population. The error bars represent the 95% confidence interval of each incidence for different states.
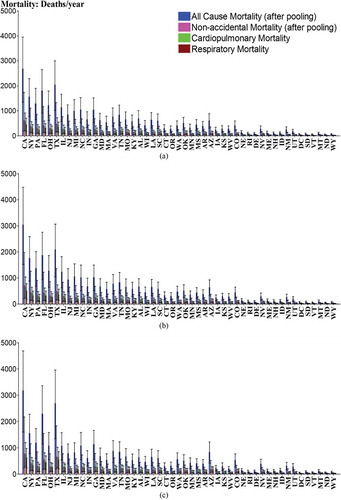
shows the ozone-related all-cause, nonaccidental, cardiopulmonary, and respiratory premature mortality in the 2050s. High premature mortality occurs at the western part of the West (California) and Northeast (Pennsylvania and New York) regions, the southern part of the South (Texas) and Southeast (Florida) regions, and the northern part of the Central region (Illinois and Ohio). According to the bar chart of these four mortality metrics for each state, again California ranks the first in the 2050s for all-cause (3,000 deaths/year, 95% CI: 1,500–4,500), nonaccidental (700 deaths/year, 95% CI: 200–2,000), cardiopulmonary (600 deaths/year, 95% CI: 200–1,000) and respiratory (500 deaths/year, 95% CI: 200–800) premature mortality. In addition, comparing with , 41 out of 49 continental states are projected to encounter a higher all-cause premature mortality (the same ratio for nonaccidental and cardiopulmonary premature mortality) and 40 out of 49 states are estimated to have a higher respiratory premature mortality in the 2050s than in the 2000s. The national ozone-related premature mortality summarized in also shows an increase in total premature death numbers for the four mortality metrics (~1,300 excess all-cause deaths/year, ~300 excess nonaccidental deaths/year, ~300 excess cardiopulmonary deaths/year, and ~200 excess respiratory deaths/year). Considering the fact that the baseline incidence rate and exposure population are held constant, this result is consistent with the ozone concentration change, where the premature mortality increases along with the rising annual mean MDA8 ozone concentration in areas like the western West region (California), southeastern Southeast region (Florida), and southern South region (Texas). For some states in the Central (Tennessee) and Southeast (Georgia) regions, the annual mean MDA8 ozone concentration is mainly projected to decrease and thus the four ozone-related mortality metrics are all projected to decrease as well.
Mortality estimation through BenMAP-CE when population and baseline incidence rate are projected to 2050 level
Mortality with exposure to the future PM2.5 concentration
As stated in the Methodology section, we also designed a scenario to estimate the mortality with population and baseline incidence rate projected to the 2050 level. The estimated all-cause (after pooling), ischemic heart disease, and lung cancer mortality figures in the 2050s are shown in . It turns out that California is projected to have the highest mortality numbers for all three incidences (14,800 all-cause deaths/year, 95% CI: 8,500–21,000; 12,700 ischemic heart disease deaths/year, 95% CI: 10,400–14,900; 1,400 lung cancer deaths/year, 95% CI: 600–2,100), compared to the result under the first scenario where New York State is estimated to have the largest ischemic heart disease mortality for both present and future cases. Moreover, 24 out of 49 continental states show a rising trend of all-cause mortality by the end of the 2050s (28 out of 49 for ischemic heart disease mortality and 10 out of 49 for lung cancer mortality, respectively). This is quite different from the result under the first scenario, where the entire continental United States showed a decreasing trend of PM2.5-related mortality in the 2050s. Referring to , projected PM2.5 concentrations are widely reduced over the country. In addition, the projected baseline incidence rates for 2050 in BenMAP-CE declines from 2000 to 2050 as well, which should favor a decrease in PM2.5-related mortality. Therefore, the only reason for the increasing tendency of PM2.5-related mortality here should be attributed to the population growth. For example, the projected total population (age > 29 years) in 2050 for California is around 32.7 million, while it is only about 18.7 million for the present case. This strong growth can be sufficient enough to compensate for the decrease of baseline incidence rates and PM2.5 concentrations. This dominant influence by the population projection can also be found by previous work (e.g., Knowlton et al., Citation2004). The national PM2.5-related mortality is summarized in . Compared with , the estimated death numbers for the 2050s here are all much higher, and the total all-cause and ischemic heart disease mortality could be even higher than that in the 2000s (~7,500 excess all-cause deaths/year and ~14,900 excess ischemic heart disease deaths/year). Considering the strong reduction of PM2.5 concentration and baseline incidence rate, this again illustrates the strong effect of population growth in the future.
Table 4. National PM2.5- and ozone-related mortality in the 2050s with projected baseline incidence rate and population (rounded to the nearest 100)
To avoid the impact of population, the standardized mortality estimates (deaths per 1,000,000 people) are calculated for the comparison of PM2.5-related mortality. a shows that in the 2000s, Pennsylvania has the highest standardized all-cause mortality (900, 95% CI: 600, 1,200). The highest standardized ischemic heart disease mortality (800, 95% CI: 600, 900) occurs in New York state, and Delaware has the highest standardized lung cancer mortality (160, 95% CI: 70, 240). It turns out that for some states (i.e., California), they have high total PM2.5-related mortality but with relatively lower standardized mortality after removing the effect from population. On the contrary, states like Delaware and Washington, DC, have low total deaths but relatively high standardized mortality numbers. There are also states like Pennsylvania that have both relatively high total and standardized PM2.5-related mortality. Recalling the spatial distribution of PM2.5 concentration in , the high standardized mortality generally occurs in the states with high PM2.5 concentrations. Thus, besides the states like California and Pennsylvania, special attention should also be paid to the states like Delaware and Washington, DC, where the total PM2.5-related deaths are low but the standardized mortality is rather high.
Figure 5. Standardized PM2.5-related mortality estimates (a) in the 2000s and (b) in the 2050s (with projected population and baseline incidence rate).
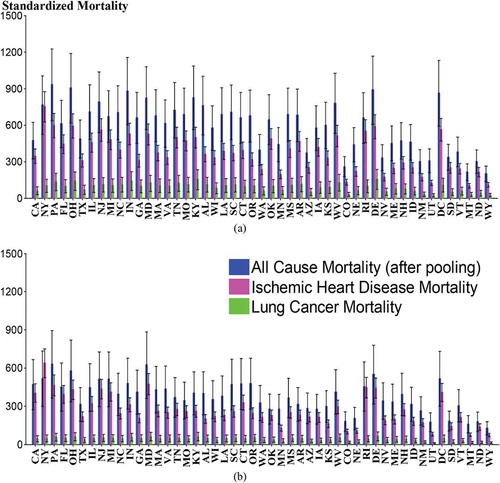
shows the standardized PM2.5-related mortality in the 2050s with the projected baseline incidence rate and population. Pennsylvania is estimated to undergo the highest standardized all-cause mortality (600, 95% CI: 400, 900). New York State still has the highest standardized ischemic heart disease mortality (600, 95% CI: 500, 700) and Delaware is projected to have the highest standardized lung cancer mortality (60, 95% CI: 30, 100). In comparison with , only Nevada has an increase of standardized all-cause mortality, and only Nevada and California are estimated to own a higher standardized ischemic heart disease mortality. In addition, the projected standardized lung cancer mortality in the 2050s is lower over the whole continental United States. Therefore, although the population growth in the future is likely to result in higher total PM2.5-related mortality as stated earlier, the widely decreased standardized mortalities over the continental United States indicate that the lower PM2.5 concentration and decreasing baseline incidence rate in the 2050s can still reduce the ratio of PM2.5-related deaths to population and enhance the health co-benefit.
Mortality with exposure to the future ozone concentration
shows the ozone-related all-cause, nonaccidental, cardiopulmonary, and respiratory mortality in the 2050s. The spatial distribution is generally close to that in , with high mortality occurring at the western part of the West (California) and Northeast (New York State and Pennsylvania), southern part of the South (Texas), southeastern and northeastern part of the Southeast (Georgia, Florida and North Carolina), and northern part of the Central region (Illinois and Ohio). According to the bar chart of these four mortality metrics for each state, again California ranks the first in the 2050s for all-cause (3,200 deaths/year, 95% CI: 1,600–4,700), nonaccidental (800 deaths/year, 95% CI: 200–2,200), cardiopulmonary (700 deaths/year, 95% CI: 300–1,200), and respiratory (600 deaths/year, 95% CI: 200–1,000) premature mortality. The changing tendency is consistent with what we have found under the first scenario. Furthermore, in comparison with and , 30 out of 49 states are projected to undergo a higher all-cause premature mortality in the 2050s than in the 2000s (39 out of 49 for nonaccidental premature mortality, 42 out of 49 for cardiopulmonary premature mortality and 47 out of 49 for respiratory premature mortality). Recalling the result under the first scenario where the four premature mortality metrics are all estimated to increase at about 41 out of 49 U.S. continental states in the 2050s, fewer states are projected to have excess all-cause and nonaccidental premature mortality even if the increase of population is considered. This is caused by the decrease of baseline incidence rate from 2000 to 2050 that offsets the effect of population growth. On the other side, more states are projected to encounter higher cardiopulmonary and respiratory premature mortality in the 2050s here, which indicates that the decrease of baseline incidence rate is not able to offset the dominant influence of population growth for these two specific metrics. The national ozone-related premature mortality in the 2050s is shown in and it turns out that the death numbers for the four mortality metrics are all higher than the estimated values in for the 2000s (~2,100 excess all-cause premature deaths/year, ~900 excess nonaccidental premature deaths/year, ~1,100 excess cardiopulmonary premature deaths/year, and ~1,400 excess respiratory premature mortality). Compared with the result for the 2050s under the first scenario, all four mortality metrics have higher excess premature deaths, even if the numbers of states with excess premature deaths are smaller than those calculated under the first scenario for the all-cause and nonaccidental mortality. Since the baseline incidence rate is projected to decline from 2000 to 2050 based on the data set in BenMAP-CE, the major reason for the higher national total all-cause and nonaccidental premature mortality here should be the large increase of all-cause and nonaccidental premature mortality at the states with strongly enhanced ozone concentration and population growth (i.e., California and Texas), which can be seen in .
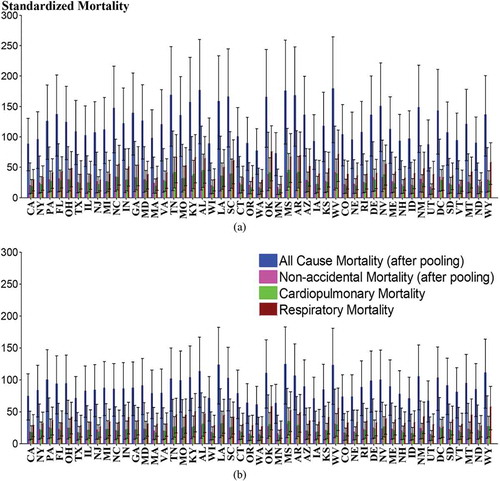
In addition, similar to the PM2.5 case, the standardized ozone-related mortality is calculated for each state. As presented in a for the 2000s, West Virginia has the highest standardized all-cause mortality (200, 95% CI: 90, 300) and Alabama has the highest standardized nonaccidental mortality (40, 95% CI: 10, 100). Mississippi owns the highest standardized cardiopulmonary mortality (50, 95% CI: 20, 70), and the highest standardized respiratory mortality occurs at Oklahoma (80, 95% CI: 30, 100). presents the result in the 2050s, and unlike the 2000s case, Mississippi has the highest standardized all-cause mortality (100, 95% CI: 60, 200), nonaccidental mortality (30, 95% CI: 10, 90), and cardiopulmonary mortality (40, 95% CI: 10, 60). The highest standardized respiratory mortality still occurs at Oklahoma (60, 95% CI: 20, 90). Contrary to the widely increased total ozone-related deaths, it seems that all the continental U.S. states are projected to undergo a decreasing trend of standardized all-cause mortality in the 2050s. Only North Dakota owns an increase of standardized nonaccidental and cardiopulmonary mortality. Five states (North Dakota, Minnesota, Montana, South Dakota, and Vermont) are projected to have higher standardized respiratory mortality. Considering the fact that projected ozone concentration increases in the 2050s over the western United States and population grows as well, the only reason for this widely decreased standardized ozone-related mortality should be the decrease of baseline incidence rate. Furthermore, there are still some states like North Dakota that undergo a higher standardized mortality for specific metric in the 2050s. According to the , those states are almost located at the regions where ozone concentration is projected to increase in the future. The enhanced ozone concentration there may overcome the effect of decreased baseline incidence rate. Hence the health issue there is worsening and it deserves attention even if the total ozone-related deaths there may not be very high.
Figure 6. Standardized ozone-related mortality estimates (a) in the 2000s and (b) in the 2050s (with projected population and baseline incidence rate).
Uncertainty study about the PM2.5- and ozone-related mortality from BenMAP-CE
During the analysis of PM2.5- and ozone-related mortality, it is recognized that the variability of the estimated mortality is quite different from region to region, largely depending on the exposure concentration of pollutant and population size. Meanwhile, different health impact functions are used for the same incidence estimation in this study, which also introduces additional uncertainty since the application of one health impact function is usually limited to some locations and time period. Hence, a study has been conducted here to assess the uncertainty among different incidences (i.e., all-cause mortality, ischemic heart disease, and lung cancer for PM2.5, and similar for ozone), respectively. Note that the concentration‐response functions used here are derived from a given population. However, in practice the population varies a lot by regions and states, and it usually lacks the concentration-response functions that can be applied to the similar population. In this case other concentration-response functions have to be used as alternatives. Thus, the uncertainty coming from the application of certain health impact functions outside their specific locations is beyond our scope and not included in the following discussion. To avoid duplication, only the estimated adverse health effects of PM2.5 and ozone in the 2000s are used for illustration.
In , the error bar is plotted to represent the upper fence (percentile 97.5) and lower fence (percentile 2.5) of the estimated incidence values for PM2.5, which are sampled from the assumed distribution of incidence using the Monte Carlo technique in BenMAP-CE (Davidson et al., Citation2007). For the pooled all-cause mortality, the range of uncertainty for the states like California (lower: 6,000; upper: 11,700) and New York (lower: 5,800; upper: 11,000) is much larger than other states, and Wyoming ranks the last (lower: 40; upper: 80). This should be mainly attributed to the population size, since California has the largest population size (age > 29, around 18.7 million) while Wyoming has the smallest size (age > 29, around 0.3 million) based on the 2000 population data set in BenMAP-CE. For the ischemic heart disease and lung cancer mortality, the uncertainty ranges for California (ischemic heart disease: lower: 5,300, upper: 7,600; lung cancer: lower: 500, upper: 1,800) and New York (ischemic heart disease: lower: 6,900, upper: 9,600; lung cancer: lower: 500, upper: 1,700) again rank in the first two places, but the ranges are far smaller compared to that of all-cause mortality. The wider confidence intervals in the estimated all-cause mortality could probably be caused by the greater uncertainties in their concentration‐response functions. For instance, the all‐cause mortality data may come from the entire study population but those for a specific cause of mortality are only subsets of the whole population. In addition, considering the fact that all-cause mortality estimates the annual total number of deaths in a given age group, whose data set has already included the uncertainty aggregated from different incidences, this could also result in the larger uncertainty of the all-cause mortality than that of the other specific incidences. The error bar plot for ozone in is similar to that of PM2.5, and California ranks the first for the uncertainty range of all-cause (lower: 1,300, upper: 4,000), nonaccidental (lower: 200, upper: 1,700), cardiopulmonary (lower: 200, upper: 900) and respiratory (lower: 200, upper: 700) premature mortality as discussed above. The uncertainty range of all-cause premature mortality for ozone is narrower than the all-cause mortality of PM2.5, which can be confirmed by the data set in which the standard deviation of beta parameter for the ozone-related all-cause premature mortality is much smaller than that of the PM2.5-related one.
Conclusion
In this study, the high-resolution (12-km) downscaled WRF/CMAQ output under RCP8.5 scenario is utilized to evaluate the PM2.5- and ozone-related mortality at the present (2000s) and future (2050s) in BenMAP-CE. The WRF/CMAQ results first show that the annual mean PM2.5 concentration in the continental United States will decrease everywhere from the 2000s to 2050s, especially for the eastern United States and West Coast. However, the annual mean MDA8 ozone concentration is projected to increase in most of the western and northeastern United States. The BenMAP-CE results show that in the 2000s California is estimated to suffer the most from all-cause mortality and lung cancer, but New York State undergoes the highest ischemic heart disease mortality for PM2.5. For ozone-related premature mortality, California ranks first for all four incidences but Texas becomes the second most severe region. In addition, two scenarios are designed to evaluate the future mortality. Under the first scenario where the future population and baseline incidence rates are held constant at the 2000 level, all of the continental states present a decreasing trend of PM2.5-related mortality, mainly contributed by the dramatic decrease of PM2.5 concentration. On the contrary, only 9 of 49 states provide a decreasing trend of ozone-related premature mortality in the 2050s due to the widely enhanced ozone concentration. However, under the second scenario where the projection of population and baseline incidence rate is considered, around half of the states show a rising trend of PM2.5-related mortality in the 2050s. For ozone, more states are projected to undergo higher cardiopulmonary and respiratory premature mortality as well. In comparison with the projected national total PM2.5- and ozone-related mortality under both scenarios, more mortality is going to occur under the second scenario for both PM2.5 and ozone. This should mainly be attributed to the dominant influence of the population growth. To remove the effect of population, the standardized PM2.5- and ozone-related morality are calculated and both of them are projected to decrease over most continental U.S. states in the 2050s, indicating a health co-benefit of widely reduced PM2.5 concentration and baseline incidence rate. It is also worth noting that a higher increase in mortality between Scenario 1 and 2 is observed for PM2.5 than for ozone. One potential reason is that the concentration-mortality response factor (β parameter) for the PM2.5-related all-cause mortality is 5 to 10 times higher than that for for the ozone-related one, based on the BenMAP data set. Besides, the uncertainty is assessed for different mortality metrics of PM2.5 and ozone. It shows that the uncertainty of PM2.5- and ozone-related all-cause mortality (after pooling) is much larger than that for specific symptoms, which may be attributed to the sample size and accumulated uncertainty of generating the all-cause mortality data sets from different specific incidences. The uncertainty range of ozone-related all-cause premature mortality is also narrower than for the PM2.5-related all-cause mortality, due to its smaller standard deviation of beta parameter.
It should be pointed out that only 3-year simulations are evaluated in this study, which is a limitation in this study considering the computational resources. In the future, when computational resources are permitted, multiyear to decadal simulations are preferred to take care of the climate internal variability. In the recent study, Hodges et al. (Citation2014, Supplementary Figure 7 and 8) demonstrated that using 5-year simulations could well represent the decadal (10-year) climate signals.
Our study shows that the change of PM2.5- and ozone-related mortality due to climate change is regional in nature. Since PM2.5 concentration is projected to decrease but ozone concentration is projected to widely increase under RCP8.5, the estimated future mortality change is quite different from that in the previous work using the SRES A2 scenario where PM2.5 concentration increases in the northern United States and ozone concentration mainly increases in the southern United States (IPCC AR5 Working group 2 [WG2] report: Smith et al., Citation2014). The changes of PM2.5- and ozone-related mortality in quantity may also vary for future projections, considering the influence of baseline incidence rate and population growth. Combining these facts can provide more valuable information for the regional health study, as well as to the decision makers aiming at enacting effective regulations in the future.
Funding
Model simulations of this research were partially supported by the National Science Foundation through TeraGrid resources provided by the National Institute for Computational Science (NICS) (TG-ATM110009 and UT-TENN0006). It also used resources of the Oak Ridge Leadership Computing Facility at the Oak Ridge National Laboratory, which is supported by the Office of Science of the U.S. Department of Energy (contract DE-AC05-00OR22725). Yang Gao was supported in part by the U.S. Department of Energy Office of Science Biological and Environmental Research (BER) as part of the Regional and Global Climate Modeling program. PNNL is operated for DOE by Battelle Memorial Institute under contract DE-AC05-76RL01830.
Additional information
Funding
Notes on contributors
Jian Sun
Jian Sun is a Ph.D. student in the Department of Civil and Environmental Engineering
Joshua S. Fu
Joshua S. Fu is an inaugural professor of the Center for Interdisciplinary Research and Graduate Education and a professor in the Department of Civil and Environmental Engineering, and Kan Huang is a research assistant professor at the University of Tennessee–Knoxville.
Kan Huang
Joshua S. Fu is an inaugural professor of the Center for Interdisciplinary Research and Graduate Education and a professor in the Department of Civil and Environmental Engineering, and Kan Huang is a research assistant professor at the University of Tennessee–Knoxville.
Yang Gao
Yang Gao currently is a postdoctoral research associate in the Atmospheric Science and Global Change Division, Pacific Northwest National Laboratory.
References
- Bell, M.L., A. McDermott, S.L. Zeger, J.M. Samet, and F. Dominici. 2004. Ozone and short-term mortality in 95 US urban communities, 1987–2000. J. Am. Med. Assoc. 292(19):2372–78. doi:10.1001/jama.292.19.2372
- Bell, M.L., F. Dominici, and J.M. Samet. 2005. A meta-analysis of time-series studies of ozone and mortality with comparison to the national morbidity, mortality, and air pollution study. Epidemiology 16(4):436–45. doi:10.1097/01.ede.0000165817.40152.85
- Bell, M.L., R. Goldberg, C. Hogrefe, P. Kinney, K. Knowlton, B. Lynn, J. Rosenthal, C. Rosenzweig, and J.A. Patz. 2007. Climate change, ambient ozone, and health in 50 US cities. Climatic Change 82(1–2):61–76. doi:10.1007/s10584-006-9166-7
- Buonocore, J.J., X.Y. Dong, J.D. Spengler, J.S. Fu, and J.I. Levy. 2014. Using the Community Multiscale Air Quality (CMAQ) model to estimate public health impacts of PM2.5 from individual power plants. Environ. Int. 68:200–8. doi:10.1016/j.envint.2014.03.031
- Byun, D., and K.L. Schere. 2006. Review of the governing equations, computational algorithms, and other components of the Models-3 Community Multiscale Air Quality (CMAQ) Modeling System. Appl. Mech. Rev. 59(2): 51–77. doi:10.1115/1.2128636
- Caiazzo, F., A. Ashok, L.A. Waitz, S.H.L. Yim, and S.R.H. Barrett. 2013. Air pollution and early deaths in the United States. Part I: Quantifying the impact of major sectors in 2005. Atmos. Environ. 79:198–208. doi:10.1016/j.atmosenv.2013.05.081
- Caldwell, P., H.N.S. Chin, D.C. Bader, and G. Bala. 2009. Evaluation of a WRF dynamical downscaling simulation over California. Climatic Change. 95(3–4):499–521. doi:10.1007/s10584-009-9583-5
- Davidson, K., A. Hallberg, D. McCubbin, and B. Hubbell. 2007. Analysis of PM2.5 using the environmental benefits mapping and analysis program (BenMAP). J. Toxicol. Environ. Health A 70(3–4):332–46. doi:10.1080/15287390600884982
- Dentener, F., D. Stevenson, J. Cofala, R. Mechler, M. Amann, P. Bergamaschi, F. Raes, and R. Derwent. 2005. The impact of air pollutant and methane emission controls on tropospheric ozone and radiative forcing: CTM calculations for the period 1990-2030. Atmos. Chem. Phys. 5(7):1731–55. doi:10.5194/acp-5-1731-2005
- Dockery, D.W., C.A. Pope, X.P. Xu, J.D. Spengler, J.H. Ware, M.E. Fay, B.G. Ferris, and F.E. Speizer. 1993. An association between air pollution and mortality in six U.S. cities. N. Engl. J. Med. 329(24):1753–59. doi:10.1056/NEJM199312093292401
- Dominici, F., R.D. Peng, M.L. Bell, L. Pham, A. McDermott, S.L. Zeger, and J.M. Samet. 2006. Fine particulate air pollution and hospital admission for cardiovascular and respiratory diseases. J. Am. Med. Assoc. 295(10):1127–34. doi:10.1001/jama.295.10.1127
- Ebi, K.L., and G. McGregor. 2009. Climate change, tropospheric ozone and particulate matter, and health impacts. Environ. Health Perspect. 116(11): 1449–55. doi:10.1289/ehp.11463
- Fang, Y., D.L. Mauzerall, J. Liu, A.M. Fiore, and L.W. Horowitz. 2013. Impacts of 21st century climate change on global air pollution-related premature mortality. Climatic Change 121(2):239–53. doi:10.1007/s10584-013-0847-8
- Fang, Y., V. Naik, L.W. Horowitz, and D.L. Mauzerall. 2013. Air pollution and associated human mortality: the role of air pollutant emissions, climate change and methane concentration increases from the preindustrial period to present. Atmos. Chem. Phys. 13:1377–94. doi:10.5194/acp-13-1377-2013
- Fann, N., A.D. Lamson, S.C. Anenberg, K. Wesson, D. Risley, and B.J. Hubbell. 2012. Estimating the national public health burden associated with exposure to ambient PM2.5 and ozone. Risk Anal. 32(1):81–95. doi:10.1111/j.1539-6924.2011.01630.x
- Fiore, A.M., D.J. Jacob, B.D. Field, D.G. Streets, S.D. Fernandes, and C. Jang. 2002. Linking ozone pollution and climate change: The case for controlling methane. Geophysical Research Letters. 29(19):1919. doi:10.1029/2002GL015601
- Fiore, A.M., J.J. West, L.W. Horowitz, V. Naik, and M.D. Schwarzkopf. 2008. Characterizing the tropospheric ozone response to methane emission controls and the benefits to climate and air quality. J. Geophys. Res. Atmos. 113(D8): D08307. doi:10.1029/2007JD009162
- Franklin, M., A. Zeka, and J. Schwartz. 2006. Association between PM2.5 and all-cause and specific-cause mortality in 27 US communities. J. Expos. Sci. Environ. Epidemiol. 17(3):279–87. doi:10.1038/sj.jes.7500530
- Frischer, T., M. Studnicka, C. Gartner, E. Tauber, F. Horak, A. Veiter, J. Spengler, J. Kühr. and R. Urbanek. 1999. Lung function growth and ambient ozone. Am. J. Respir. Crit. Care Med. 160(2):390–396. doi:10.1164/ajrccm.160.2.9809075
- Gao, Y., J.S. Fu, J.B. Drake, Y. Liu, and J.F. Lamarque. 2012. Projected changes of extreme weather events in the eastern United States based on a high resolution climate modeling system. Environ. Res. Lett. 7(4):044025. doi:10.1088/1748-9326/7/4/044025
- Gao, Y., J.S. Fu, J.B. Drake, J.F. Lamarque, and Y. Liu. 2013. The impact of emission and climate change on ozone in the United States under representative concentration pathways (RCPs). Atmos. Chem. Phys. 13(18): 9607–621. doi:10.5194/acp-13-9607-2013
- Gao, Y., L.R. Leung, J. Lu, Y. Liu, M.Y. Huang, and Y. Qian. 2014. Robust spring drying in the southwestern US and seasonal migration of wet/dry Patterns in a warmer climate. Geophys. Res. Lett. 41(5):1745–51. doi:10.1002/2014GL059562
- Hodges, M., J.H. Belle, E.J. Carlton, S. Liang, H.Z. Li, W. Luo, M.C. Freeman, Y. Liu, Y. Gao, J. Hess, and J.V. Remais. 2014. Delays in reducing waterborne and water-related infectious diseases in China under climate change. Nat. Clim. Change 4(12): 1109–15. doi:10.1038/nclimate2428
- Huang, Y., F. Dominici, and M.L. Bell. 2005. Bayesian hierarchical distributed lag models for summer ozone exposure and cardio-respiratory mortality. Environmetrics 16(5):547–62. doi:10.1002/env.721
- Ito, K., S. F. De Leon, and L. Morton. 2005. Associations between ozone and daily mortality: analysis and meta-analysis. Epidemiology 16(4):446–57. doi:10.2307/20486080
- Jacobson, M.Z. 2012. Air Pollution and Global Warming: History, Science and Solutions, 2nd ed. New York, NY: Cambridge University Press, New York.
- Jerrett, M., R.T. Burnett, C.A. Pope, K. Ito, G. Thurston, D. Krewski, Y.L. Shi, E. Calle, and M. Thun. 2009. Long-term ozone exposure and mortality. N. Engl. J. Med. 360(11):1085–95. doi:10.1056/NEJMoa0803894
- Kim, Y.M., Y. Zhou, Y. Gao, J.S. Fu, B.A. Johnson, C. Huang, and Y. Liu. 2015. Spatially resolved estimation of ozone-related mortality in the United States under two representative concentration pathways (RCPs) and their uncertainty. Climatic Change 128:71–84. doi:10.1007/s10584-014-1290-1
- Kirtman, B., S.B. Power, J.A. Adedoyin, G.J. Boer, R. Bojariu, I. Camilloni, F.J. Doblas-Reyes, A.M. Fiore, M. Kimoto, G.A. Meehl, M. Prather, C. Schär, R. Sutton, G.J. van Oldenborgh, G. Vecchi, and H.J. Wang. 2013. Near-term climate change: Projections and predictability. In Climate Change 2013: The Physical Science Basis. Contribution of Working Group I to the Fifth Assessment Report of the Intergovernmental Panel on Climate Change, ed. T.F. Stocker, D. Qin, G.-K. Plattner, M. Tignor, S.K. Allen, J. Boschung, A. Nauels, Y. Xia, V. Bex, and P.M. Midgley, 953–1028. New York, NY: Cambridge University Press.
- Knowlton, K., J.E. Rosenthal, C. Hogrefe, B. Lynn, S. Gaffin, R. Goldberg, C. Rosenzweig, K. Civerolo, J.Y. Ku, and P.L. Kinney. 2004. Assessing ozone-related health impacts under a changing climate. Environ. Health Perspect. 112(15):1557–1563. doi:10.2307/3435615
- Kreit, J.W., K.B. Gross, T.B. Moore, T.J. Lorenzen, J. D’arcy, and W.L. Eschenbacher. 1989. Ozone-induced changes in pulmonary function and bronchial responsiveness in asthmatics. J. Appl. Physiol. 66(1):217–22.
- Krewski, D., M. Jerrett, R.T. Burnett, R.J. Ma, E. Hughes, Y.L. Shi, M.C. Turner, C.A. Pope 3rd, G. Thurston, E.E. Calle, M.J. Thun, B. Beckerman, P. DeLuca, N. Finkelstein, K. Ito, D.K. Moore, K.B. Newbold, T. Ramsay, Z. Ross, H. Shin, and B. Tempalski. 2009. Extended Follow-Up and Spatial Analysis of the American Cancer Society Study Linking Particulate Air Pollution and Mortality. Cambridge, MA: Health Effects Institute.
- Laden, F., J. Schwartz, F.E. Speizer, and D.W. Dockery. 2006. Reduction in fine particulate air pollution and mortality. Am. J. Respir. Crit. Care Med. 173(6):667–72. doi:10.1164/rccm.200503-443OC
- Lam, Y.F., J.S. Fu, S. Wu, and L.J. Mickley. 2011. Impacts of future climate change and effects of biogenic emissions on surface ozone and particulate matter concentrations in the United States. Atmos. Chem. Phys. 11: 4789–4806. doi:10.5194/acp-11-4789-2011
- Lamarque, J.F., G.P. Kyle, M. Meinshausen, K. Riahi, S.J. Smith, De. P. van Vuuren, A.J. Conley, and F. Vitt. 2011. Global and regional evolution of short-lived radiatively-active gases and aerosols in the Representative Concentration Pathways. Climatic Change. 109(1–2):191–212. doi:10.1007/s10584-011-0155-0
- Lamarque, J.F., L.K. Emmons, P.G. Hess, D.E. Kinnison, S. Tilmes, F. Vitt, C.L. Heald, E.A. Holland, P.H. Lauritzen, J. Neu, J.J. Orlando, P.J. Rasch, and G.K. Tyndall. 2012. CAM-chem: Description and evaluation of interactive atmospheric chemistry in the Community Earth System Model. Geosci. Model Dev. 5(2):369–411. doi:10.5194/gmd-5-369-2012
- Levy, J.I., S.M. Chemerynski, and J.A. Sarnat. 2005. Ozone exposure and mortality: An empiric Bayes metaregression analysis. Epidemiology. 16(4): 458–68. doi:10.1097/01.ede.0000165820.08301.b3
- Mass, C.F., D. Ovens, K. Westrick, and B.A. Colle. 2002. Does increasing horizontal resolution produce more skillful forecasts? Bull. Am. Meteorol. Soc. 83(3): 407–30. doi:10.1175/1520-0477(2002)083<0407:DIHRPM>2.3.CO;2.
- Moss, R.H., J.A. Edmonds, K.A. Hibbard, M.R. Manning, S.K. Rose, D.P. van Vuuren, T.R. Carter, S. Emori, M. Kainuma, T. Kram, G.A. Meehl, J.F.B. Mitchell, N. Nakicenovic, K. Riahi, S.J. Smith, R.J. Stouffer, A.M. Thomson, J.P. Weyant, and T.J. Wilbanks. 2010. The next generation of scenarios for climate change research and assessment. Nature. 463(7282): 747–56. doi:10.1038/nature08823
- Naser, T.M., Y. Yoshimura, K. Sekiguchi, Q.Y. Wang, and K. Sakamoto. 2008. Chemical composition of PM2.5 and PM10 and associated polycyclic aromatic hydrocarbons at a roadside and an urban background area in Saitama, Japan. Asian Journal of Atmos. Environ. 2(2):90–101. doi:10.5572/ajae.2008.2.2.090
- Pope III, C.A., R.T. Burnett, M.J. Thun, E.E. Calle, D. Krewski, K. Ito, and G.D. Thurston. 2002. Lung cancer, cardiopulmonary mortality, and long-term exposure to fine particulate air pollution. J. Am. Med. Assoc. 287(9): 1132–41. doi:10.1001/jama.287.9.1132
- Post, E.S., A. Grambsch, C. Weaver, P. Morefield, J. Huang, L.Y. Leung, C.G. Nolte, P. Adams, X.Z. Liang, J.H. Zhu, and H. Mahoney. 2012. Variation in estimated ozone-related health impacts of climate change due to modeling choices and assumptions. Environ. Health Perspect. 120(11):1559–64. doi:10.1289/ehp.1104271
- Qian, Y., S.J. Ghan, and L.R. Leung. 2010. Downscaling hydroclimatic changes over the western US based on CAM subgrid scheme and WRF regional climate simulations. Int. J. Climatol. 30(5):675–93. doi:10.1002/joc.1928
- Riahi, K., A. Gruebler, and N. Nakicenovic. 2007. Scenarios of long-term socio-economic and environmental development under climate stabilization. Technol. Forecasting Social Change 74(7):887–935. doi:10.1016/j.techfore.2006.05.026
- Shi, C., H.J.S. Fernando, and P. Hyde. 2012. CMAQ predictions of tropospheric ozone in the U.S. southwest: Influence of lateral boundary and synoptic conditions. Sci. Total Environ. 416:374–84. doi:10.1016/j.scitotenv.2011.12.025
- Silva, R.A., J.J. West, Y.Q. Zhang, S.C Anenberg, J.F. Lamarque, D.T. Shindell, W.J. Collins, S. Dalsoren, G. Faluvegi, and G. Folberth. 2013. Global premature mortality due to anthropogenic outdoor air pollution and the contribution of past climate change. Environ. Res. Lett. 8(3):034005. doi:10.1088/1748-9326/8/3/034005
- Skamarock, W.C., and J.B. Klemp. 2008. A time-split nonhydrostatic atmospheric model for weather research and forecasting applications. J. Comput. Phys. 227(7):3465–85. doi:10.1016/j.jcp.2007.01.037
- Smith, A.E., and W. Gans. 2014. Enhancing the characterization of epistemic uncertainties in PM2.5 risk analyses. Risk Anal. doi:10.1111/risa.12236
- Smith, K.R., A.Woodward, D. Campbell-Lendrum, D.D. Chadee, Y. Honda, Q. Liu, J.M. Olwoch, B. Revich, and R. Sauerborn. 2014. Human health: impacts, adaptation, and co-benefits. In Climate Change 2014: Impacts, Adaptation, and Vulnerability. Part A: Global and Sectoral Aspects. Contribution of Working Group II to the Fifth Assessment Report of the Intergovernmental Panel on Climate Change, ed. C.B. Field, V.R. Barros, D.J. Dokken, K.J. Mach, M.D. Mastrandrea, T.E. Bilir, M. Chatterjee, K.L. Ebi, Y.O. Estrada, R.C. Genova, B. Girma, E.S. Kissel, A.N. Levy, S. MacCracken, P.R. Mastrandrea, and L.L. White, 709–54. New York, NY: Cambridge University Press.
- Tagaris, E., K.J. Liao, A.J. DeLucia, L. Deck, P. Amar, and A.G. Russell. 2009. Potential impact of climate change on air pollution-related human health effects. Environ. Sci. Technol. 43(13):4979–88. doi:10.1021/es803650w
- Taylor, K.E., R.J. Stouffer, and G.A. Meehl. 2011. An overview of CMIP5 and the experiment design. Bull. Am. Meteorol. Society. 93(4):485–98. doi:10.1175/BAMS-D-11-00094.1
- Teschea, T.W., R. Morrisb, G. Tonnesenc, D. McNallya, J. Boyland, and P. Brewere. 2006. CMAQ/CAMx annual 2002 performance evaluation over the eastern US. Atmos. Environ. 40:4906–19. doi:10.1016/j.atmosenv.2005.08.046.
- U.S. Environmental Protection Agency. 2007. Guidance on the use of models and other analyses for demonstrating attainment of air quality goals for ozone, PM2.5 and regional haze. EPA-454/B-07e002. http://www.epa.gov/scram001/guidance/guide/final-03-pm-rh-guidance.pdf
- Voorhees, A.S., J.D. Wang, C.C. Wang, B. Zhao, S.X. Wang, and H.D. Kan. 2014. Public health benefits of reducing air pollution in Shanghai: A proof-of-concept methodology with application to BenMAP. Sci. Total Environ. 485–86(0):396–405. doi:10.1016/j.scitotenv.2014.03.113
- West, J.J., S. Szopa, and D.A. Hauglustaine. 2007. Human mortality effects of future concentrations of tropospheric ozone. C. R. Geosci. 339(11–12): 775–83. doi:10.1016/j.crte.2007.08.005
- West, J.J., S.J. Smith, R.A. Silva, V. Naik, Y.Q. Zhang, Z. Adelman, M.M. Fry, S. Anenberg, L.W. Horowitz, and J.F. Lamarque. 2013. Co-benefits of mitigating global greenhouse gas emissions for future air quality and human health. Nat. Clim. Change. 3(10):885–89. doi:10.1038/nclimate2009
- White, M.C., R.A. Etzel, W.D. Wilcox, and C. Lloyd. 1994. Exacerbations of childhood asthma and ozone pollution in Atlanta. Environ. Res. 65(1): 56–68. doi:10.1006/enrs.1994.1021
- Woods & Poole Economics, Inc. 2012. Complete demographic database. Washington, DC.
- Zanobetti, A., F. Dominici, Y. Wang, and J.D. Schwartz. 2014. A national case-crossover analysis of the short-term effect of PM2.5 on hospitalizations and mortality in subjects with diabetes and neurological disorders. Environ. Health 13(1):38–48. doi:10.1186/1476-069X-13-38