
Abstract
This study was conducted to derive receptor-specific outdoor exposure concentrations of total suspended particulate (TSP) and respirable (dae ≤ 10 µm) air manganese (air-Mn) for East Liverpool and Marietta (Ohio) in the absence of facility emissions data, but where long-term air measurements were available. Our “site-surface area emissions method” used U.S. Environmental Protection Agency’s (EPA) AERMOD (AMS/EPA Regulatory Model) dispersion model and air measurement data to estimate concentrations for residential receptor sites in the two communities. Modeled concentrations were used to create ratios between receptor points and calibrated using measured data from local air monitoring stations. Estimated outdoor air-Mn concentrations were derived for individual study subjects in both towns. The mean estimated long-term air-Mn exposure levels for total suspended particulate were 0.35 μg/m3 (geometric mean [GM]) and 0.88 μg/m3 (arithmetic mean [AM]) in East Liverpool (range: 0.014–6.32 μg/m3) and 0.17 μg/m3 (GM) and 0.21 μg/m3 (AM) in Marietta (range: 0.03–1.61 μg/m3). Modeled results compared well with averaged ambient air measurements from local air monitoring stations. Exposure to respirable Mn particulate matter (PM10; PM <10 μm) was higher in Marietta residents.
Implications: Few available studies evaluate long-term health outcomes from inhalational manganese (Mn) exposure in residential populations, due in part to challenges in measuring individual exposures. Local long-term air measurements provide the means to calibrate models used in estimating long-term exposures. Furthermore, this combination of modeling and ambient air sampling can be used to derive receptor-specific exposure estimates even in the absence of source emissions data for use in human health outcome studies.
Introduction
Only a few inhalation exposure studies have evaluated nonoccupational, stationary source–based environmental exposures to manganese (Mn). Although Mn inhalation exposure in the general population is much lower than in the occupational setting, these studies also identified subtle neurological deficits in residential populations chronically exposed to low airborne manganese (air-Mn) levels (Baldwin et al., Citation1999; Beuter et al., Citation1999; Bowler et al., Citation1999; Lucchini et al., Citation2012; Menezes-Filho et al., Citation2011; Mergler et al., Citation1999; Riojas-Rodriguez et al., Citation2010; Rodriguez-Agudelo et al., Citation2006).
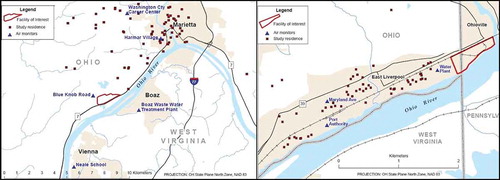
Figure 1. Maps of air monitor and study subject locations, Marietta (left) and East Liverpool (right).
The first account of Parkinsonian symptoms linked to inhalation exposure of Mn was documented by Couper (Citation1837). Since then, the epidemiologic literature has established that adverse neurological and neuropsychological health effects are associated with chronic exposure to excessive airborne manganese (air-Mn) via inhalation. Occupational studies have described motor impairment (e.g., psychomotor speed, reaction time, hand-eye coordination, postural sway), cognitive deficits (e.g., verbal IQ, working memory), mood perturbations (e.g., depression, anxiety), and depressed olfaction in workers (microsmia, anosmia) with average Mn exposures as low as 32 µg/m3, with increasing severity for higher exposures (Agency for Toxic Substances and Disease Registry [ATSDR], Citation2012; Blond and Netterström, Citation2007; Bowler et al., Citation2006, Citation2007, Citation2011; Chia et al., Citation1995; Iregren, Citation1990; Lucchini et al., Citation1995, Citation1999; Mergler et al., Citation1994; Roels et al., Citation1985, Citation1987, Citation1992, Citation1999, Citation2012).
Environmental air-Mn concentrations in the United States vary significantly with location and proximity to emissions sources. Based on national air monitoring networks, the average background air-Mn concentration in urban areas is approximately 0.05 µg/m3 (U.S. Environmental Protection Agency [EPA], Citation2012a). EPA (Citation1984) reported that rural air-Mn from 1965 to 1982 was approximately 6.25 times lower than urban air-Mn. Air-Mn in areas with Fe/Si-Mn (iron/silicomanganese) alloy smelters or other operations using Mn-containing products can be several orders of magnitude higher than what has been reported in rural and urban environments (ATSDR, Citation2007, Citation2009, Citation2010, Citation2012; EPA, Citation1984, 2012a).
Two communities in eastern Ohio were identified with elevated measured concentrations of ambient air-Mn, one of which has the highest concentrations of measured air-Mn reported to the EPA Air Quality System (AQS) database (EPA, Citation2012a). Air-Mn in one community (Marietta) is predominantly released from a large Fe/Si-Mn alloy smelting plant (Eramet, Inc.), whereas in the other community (East Liverpool), it is released during the offloading, grinding (for resizing), packaging, and storage of Mn-containing ore and alloy products at a metals storage and packaging facility (S.H. Bell Company). East Liverpool is approximately 200 km north-northeast of Marietta, along the Ohio River ().
Residents from each community were recruited to participate in a study examining neurological and neuropsychological impacts from chronic exposures to low levels of outdoor air-Mn. In support of this epidemiologic study, modeled estimates of outdoor air-Mn concentrations were derived as surrogates of outdoor exposure for residents identified as study participants in the two communities. Dispersion modeling calibrated with measured data was used to estimate ambient air-Mn exposures for each study participant in the two towns. Both communities had over 10 yr of environmental total suspended particulate (TSP) sampling data generated between 1999 and 2013 that were analyzed for a number of toxic metals, including Mn. Only years where data met 75% completeness in both towns (2003–2013) were used for statistical analyses.
The objective of this study was to estimate inhalation exposures by deriving residence-specific outdoor air-Mn for two Ohio communities.
Materials and Methods
Stationary monitoring and fingerprinting of ambient TSP air-Mn
Twenty-four-hour TSP samples have been continuously collected and analyzed by the Ohio Environmental Protection Agency, Division of Air Pollution Control (Ohio EPA) in both communities since 2003 (Ohio EPA, Citation2012a, Citation2012b), although 10 months of continuous data were also collected in 2000 in East Liverpool. Stationary high-volume (“HiVol”) monitors used in these communities pull ambient air through an orifice at the top of the monitor at a volume rate of 1.13 m3/min, and particulate matter is deposited on a 203 × 254-mm glass fiber filter according to EPA Compendium Method IO 2.1 (EPA, Citation1999a). The concentration of TSP was reported as mass of particulate matter collected per cubic meter of air sampled (µg/m3) at sea level pressure (1 atm) and a temperature of 25 °C (ATSDR, Citation2007). Sample filters were analyzed for metals using inductively coupled plasma mass spectrometry (ICP-MS) according to the EPA Compendium Method IO 3.5 (EPA, Citation1999b).
At both sites, 24-hr TSP filter samples are collected in community air monitoring stations every 6 days. These 24-hr samples are composited and analyzed to yield a monthly average air-Mn concentration (Ohio EPA, Citation2012a, Citation2012b). Because composite sample concentrations of Mn were elevated, in 2005 Ohio EPA began analyzing every filter from the East Liverpool Water Plant air monitoring station in individual 24-hr samples (discrete) as well as monthly composite samples to yield more information about the magnitude of Mn levels in community outdoor air (Ohio EPA, Citation2012b). Thus, data at this location were evaluated as both 24-hr and monthly averaged composite samples (ATSDR, Citation2010).
To understand the sources and toxicological implications of outdoor exposure to air-Mn, the EPA National Enforcement Investigations Center (NEIC) Laboratory analyzed Mn in particulate matter collected on 341 glass fiber HiVol 24-hr sample filters at stationary sampling locations in Marietta and East Liverpool for fingerprint analysis. These analyses were carried out to yield information about how metals on the filters at various locations are related and compare with source samples, evaluate size distribution and morphology of collected particles, and determine the elemental abundance and chemical form of metals on the filters. For the purposes of these analyses, air filters were evaluated by using LA-ICP-MS (laser ablation inductively coupled plasma mass spectrometry), SEM (scanning electron microscopy), and XRD (X-ray diffractometry) techniques (EPA, Citation2010a, Citation2010b).
Size fractions of particulate matter in East Liverpool air samples were also determined from collocated air monitors at the Water Plant operated by Ohio EPA and EPA. The monitors collected 24-hr TSP, PM10 (particulate matter with an aerodynamic diameter <10 μm), and PM2.5 (PM with an aerodynamic diameter <2.5 μm) samples for 3 months in summer of 2011. These samples were collected during the period that health outcome data were collected in the community, and is the only sampling period that analyzed data in all three particle fractions.
To estimate exposures to respirable manganese, the TSP air-Mn concentration was multiplied by the fraction of air-Mn PM10 and PM2.5 as determined by fingerprinting analysis in Marietta (PM10 [0.83 or 83%] and PM2.5 [0.21 or 21%]), and by collocated monitoring data in East Liverpool (PM10 [0.35 or 35%] and PM2.5 [0.037 or 3.7%]).
Identification of modeling receptor points
Receptor points consisted of monitoring stations and the residential location of people recruited as part of two population studies that examined the potential health effects of outdoor air-Mn exposure in adult residents of Marietta, Ohio (n = 100), and East Liverpool, Ohio (n = 86). Study participants for each community were identified based on the likelihood of elevated exposures. The study participants were obtained by random recruitment in these areas and application of eligibility criteria as described for Marietta elsewhere (Bowler et al., Citation2012; Kim et al., Citation2011). Study subjects had neuropsychological tests and provided blood and serum samples for analysis. Data collection in these communities took place in 2009 and 2011 for Marietta and East Liverpool, respectively.
Model methodology
AERMOD (AMS/EPA Regulatory Model) is EPA’s preferred dispersion model for short-range (less than 50 km) modeling analyses. The AERMOD modeling system consists of two preprocessors and a dispersion model (Cimorelli et al., Citation2005):
A meteorological preprocessor (AERMOD Meteorological Preprocessor, AERMET) uses meteorological data and surface characteristics to develop planetary boundary layer parameters to create profiles of wind, turbulence, and temperature.
A terrain preprocessor (AERMOD Terrain Preprocessor, AERMAP) uses gridded terrain data to determine the influence of elevation on the modeling domain, which allows AERMOD to calculate concentrations in either flat or complex terrain.
A steady-state plume model (AERMOD) designed to estimate impacts in urban or rural areas, in flat or complex terrain, for surface or elevated releases from multiple sources and multiple source types.
Land use/land cover data and 1 arc-sec (approximately 30 m) National Elevation Dataset for the study areas were acquired from the United States Geological Survey Seamless Server (USGS). Weather data were acquired from the nearest National Weather Service (NWS) stations for the two communities, which provided current hourly surface observations and upper air sounding data (National Climatic Data Center [NCDC]).
AERMOD was used to predict long-term (5-yr) average air-Mn concentrations at each modeled receptor. The model inputs for the two towns are as follows:
Marietta. The nearest NWS surface station is located at the Mid-Ohio Valley Regional Airport in Parkersburg, West Virginia, approximately 8 km east-southeast of the facility. The nearest NWS upper air station with data for the same 5-yr period is at the Wright-Patterson Air Force Base in Dayton, Ohio, which is approximately 322 km west-northwest of the facility. Five consecutive years of surface and upper air meteorological data (1991–1995) were processed through AERMET (EPA, Citation2010c) for the Marietta modeling.
East Liverpool. The nearest and most representative meteorological station is located at the Pittsburgh International Airport in Pittsburgh, Pennsylvania, which is approximately 40 km southeast of the facility. NCDC 1-min surface data, NWS hourly surface data, and NWS upper air data are all available for this station. Five consecutive years of data (2006–2010) were processed through AERMET (EPA, Citation2012b) for the East Liverpool modeling.
Calculating exposure estimates
No emissions data were available for the metals packaging and storage facility in East Liverpool, thus an approach was used for estimating residential exposures that is scalable to measured data for both towns (herein referred to as “site-surface area emissions method”). To estimate outdoor residential air-Mn concentrations for each study subject residence, AERMOD was used to determine air-Mn concentration ratios of each residence to a reference air monitoring station (RAMS). In Marietta, the long-running Washington County Career Center (WCCC) monitor was used as the reference point, and in East Liverpool, the Maryland Avenue monitor was chosen to be the reference point. Reference point selection was based on how well measured data at each site predicted measurements at the other sites using the scaling and modeling method detailed below.
Unlike traditional dispersion modeling where detailed emissions data are available, the approach we are proposing assumes the entire surface area of the site is a single area emissions source. AERMOD was used to calculate 5-yr average air concentrations from a scalable unit emission rate of 1 gram per second (g/sec) over the full extent of the property of each facility. Dispersion modeling is linear, thus choosing a scalable unit emission rate facilitates calculating estimated outdoor concentrations from many on-site sources without rerunning the model for each source. This procedure is recommended for dispersion modeling (EPA, Citation2005).
The unit emission rate was used for modeling purposes to calculate ratio relationships between estimated air-Mn concentrations at receptor points. Using this approach, the relationships of the modeled concentrations to each other and to a known reference point (in the form of estimated outdoor exposure ratios) can be used to calculate outdoor air-Mn concentrations at the residence of each study participant. In this instance, the known reference point was historical data recorded at the WCCC and Maryland Avenue outdoor air monitoring stations. AERMOD outputs for estimated outdoor air-Mn were scaled to actual measurements at the monitoring stations, yielding a relative fraction of air-Mn measured at the monitoring stations for all receptor points. For calculating residential outdoor exposure estimates, annual average air-Mn measurements were used to derive outdoor exposure concentrations from air-Mn ratios calculated using AERMOD modeling outputs. The method for calculating the estimated outdoor exposure of each receptor point was defined as
where R(air-Mn) is the outdoor exposure concentration of air-Mn for each receptor; AR is the receptor-specific AERMOD estimate of air-Mn derived from the unit emission rate of 1 g/sec; RAMS is the AERMOD estimate of air-Mn derived from the unit emission rate at the reference air monitoring station; and C is the annual average air-Mn concentration measured at the reference air monitoring station.
Statistics
Raw data from area air monitors were obtained in Microsoft Excel files. Descriptive statistics, including confidence intervals, standard deviation, means, and quartiles were generated to compare measured and modeled data for each town. Annual and rolling 5-yr averages of ambient Mn concentrations were calculated for air monitoring sites where sufficient data were available to make a comparison with modeling estimates. Scaling factors were derived from measured levels of Mn in the PM10 and PM2.5 fractions of air-Mn TSP and were used to estimate residential exposures to respirable air-Mn. Descriptive statistics were generated to qualitatively compare measured and modeled data for each town, and exposure ratios and estimates were calculated using Microsoft Excel 2007.
Results
Stationary sampling data of TSP air-Mn
The statistical summary for the five Marietta air monitor locations () shows that over the 10-yr sampling period (2003–2013), TSP air-Mn samples frequently exceeded the background values typical of ambient air-Mn in urban areas (EPA, Citation2012a). Across the five sampling sites, the arithmetic mean (AM) of the monthly composite air-Mn concentrations ranged from 0.11 to 0.39 µg/m3. For comparison, the Mn concentrations for eight 24-hr samples collected on the facility property ranged from 0.46 to 1.90 µg/m3 and averaged 1.13 µg/m3 (AM) and 1.04 µg/m3 (GM, geometric mean). In East Liverpool, the majority of monthly air-Mn concentrations also exceeded the national background average. Across the three sampling sites, the monthly AM ranged from 0.17 to 1.42 µg/m3 (). Air-Mn concentrations for 24-hr samples (Water Plant) ranged from 0.02 to 25.0 µg/m3 and averaged 1.50 µg/m3 (AM) and 0.56 µg/m3 (GM) (). TSP air-Mn in both communities exceeded the EPA reference concentration (RfC = 0.05 µg/m3; EPA, Citation2012c) and/or the ATSDR minimal risk level (MRL = 0.30 µg/m3; ATSDR, Citation2012) for at least one community monitoring site in nearly every reported measurement date during the 10-yr sampling period.
Table 1. TSP air-Mna summary statistics for Marietta monitoring sites (January 2003–October 2013)b
Table 2. TSP air-Mna summary statistics for East Liverpool monitoring sites (January 2003–October 2013)
The SEM analyses used by NEIC for particle fingerprinting indicated that in Marietta, 77% of the ambient air-Mn particulate matter on the filters was predominately spherical and that the chemical form of Mn was generally Mn-oxide. The analysis also determined that 83% of TSP air-Mn met the World Health Organization (WHO, Citation1999) definition of respirable with Mn particles having an aerodynamic diameter (dae) ≤10 µm (PM10) and 21% with a dae ≤2.5 µm (PM2.5). More than half of the Mn particles had a dae ranging from 3.4 to 4.6 µm. The high prevalence of fine Mn particles in Marietta is consistent with the fine metal dusts released from high-heat processes, such as smelting (EPA, Citation1996).
In 2011, collocated air monitors were sited and operated by Ohio EPA and EPA at the East Liverpool Water Plant location for collection of 24-hr TSP, PM10, and PM2.5 samples. From these samples, it was determined that TSP from East Liverpool has a greater percentage of nonrespirable Mn particles compared with Marietta TSP. In East Liverpool, 35% of TSP air-Mn consisted of PM10 Mn, whereas only 3.7% of the TSP air-Mn was PM2.5 Mn. This is consistent with SEM fingerprinting analysis conducted by NEIC on a limited number of East Liverpool TSP filters, indicating that Mn particles in East Liverpool have a dae range of 4.4–24.3 µm (EPA, Citation2010b). Compared with Marietta, a generally larger Mn particle fraction was expected given that emission points at the source facility in East Liverpool are general offloading, storage, and sizing/grinding operations. Estimated annual concentrations of PM10 Mn and PM2.5 Mn were generated using the ratios determined from fingerprinting and monitoring, and descriptive statistics were generated to compare residential outdoor exposure concentrations in the communities.
Residential outdoor exposure concentrations
Given that the East Liverpool plant did not have facility-specific Mn emissions data, the site-surface area emissions method was used for both towns to yield comparable estimates of exposure. shows a comparison of average (AM) measured community sampling data for all monitoring sites (2003–2013) and modeled long-term outdoor exposure concentrations of TSP air-Mn in Marietta and East Liverpool. In Marietta, the modeled outdoor exposure concentrations ranged from 0.03 µg/m3 at the lowest receptor point to 1.61 µg/m3 at the highest receptor point, with an average outdoor exposure concentration for all receptor points (n = 100) of 0.21 µg/m3 (AM) and 0.17 µg/m3 (GM). Across the sampling period in East Liverpool, the modeled outdoor exposure concentrations of TSP air-Mn ranged from 0.014 µg/m3 at the lowest exposed receptor point to 6.32 µg/m3 at the highest exposed receptor point, with an overall average outdoor exposure concentration for all receptor points (n = 86) of 0.88 µg/m3 (AM) and 0.35 µg/m3 (GM). The statistical distribution of modeled TSP air-Mn were within the range of measured air-Mn outdoor exposure concentrations across all monitors located in each community (), which provides internal consistency for the calculation approach used in the present study.
Table 3. Distributions of TSP air-Mna: Comparison between estimates from the site-surface area emissions method model and the measured outdoor TSP air-Mn data for all monitoring sites in Marietta and East Liverpool, Ohio (2003–2013)
Descriptive statistics were calculated for the fraction of modeled TSP air-Mn estimated to be PM10 and PM2.5 using scaling factors derived from the fingerprinting analyses for the Marietta study and collocated measurements for the East Liverpool study. presents the statistical distribution of these estimates in Marietta (PM10: 0.18 µg/m3 [AM], range 0.03–1.33 µg/m3; PM2.5: 0.05 µg/m3 [AM], range 0.007–0.34 µg/m3) and East Liverpool (PM10: 0.31 µg/m3 [AM], range 0.005–2.21 µg/m3; PM2.5: 0.03 µg/m3 [AM], range 0.001–0.23 µg/m3). Results indicate that even though the TSP air-Mn levels in East Liverpool were generally higher than in Marietta, the Marietta residents have a higher exposure to respirable Mn particulate matter.
Table 4. Estimatesa of annual average TSP, PM10, and PM2.5 air-Mnb in Marietta and East Liverpool (2003–2013)
Method validation
Traditional dispersion modeling based on highly detailed facility-reported Mn emission estimates was performed to estimate study participant exposures in Marietta, which was detailed elsewhere (EPA, Citation2010c; Bowler et al., Citation2012). In summary, 255 tons per year of manganese was modeled as released via 15 point sources and 193 volume sources modeled from three overarching processes at the Eramet facility: (1) furnace emissions (melting, tapping, charging, hot metal transfer, feed system, slag handling, and casting); (2) the metal oxygen reduction process (including the pelletizer); and (3) materials handling processes (including conveying, loading/unloading, feed systems, hoppers, crushing, sizing, packing, milling, and bagging). These detailed emissions data were provided under a regulatory request for information to the EPA. This type of information is not readily available for general research outside of environmental enforcement agencies. In that evaluation, two long-term air-Mn monitoring stations in Marietta were useful for comparing modeled 5-yr averages with measured 5-yr averages: the WCCC monitoring station, which has been in operation since 2000, and the Harmar Village monitoring station, which has been in operation since 2007. The rolling 5-yr measured average for eight periods at the WCCC (0.16 µg/m3) compared well with traditional dispersion modeling 5-yr ambient outdoor air-Mn estimates at the WCCC air monitoring site (0.14 µg/m3), suggesting that for Marietta the traditional dispersion model accurately predicts long-term ambient Mn concentrations at the WCCC monitoring site (). Harmar Village has two 5-yr periods from which to calculate a rolling 5-yr average. Comparison with the Harmar Village data is not ideal, since production at the Eramet plant has diminished in recent years, negatively biasing long-term averaging for prior years. Even still, the predicted dispersion modeling concentration at this location (0.16 µg/m3) and the measured average (0.11 µg/m3) of the 2007–2011 and 2008–2012 periods were within an order of magnitude () and would likely have been closer if measured data from years with greater air-Mn emissions had been available.
Table 5. TSP air-Mna in Marietta, OHb: Comparison between traditional dispersion modeling, site-surface area method modeling, and rolling 5-yr long-term measured average
In Marietta, WCCC and Harmar Village had the greatest number of observations (n > 50) over the period 2003–2013. WCCC is the reference location and by default the site-surface area emissions method estimates are perfectly correlated with the long-term air measurements at this site. Only Harmar Village in Marietta could be used to compare dispersion modeling based on emissions data with the site-surface area emissions method model estimates of air-Mn. In general, the modeled average of air-Mn as generated by the traditional dispersion model (0.16 µg/m3) was slightly more accurate than the site-surface area emissions method model estimate (0.18 µg/m3) at this location. Both modeling runs overestimated the actual measured concentration at the site, which was 0.11 µg/m3 over the 2003–2013 sampling period. The number of observations for air-Mn measurements at the three other Marietta monitoring locations was too low at Blue Knob Road (n = 25), Boaz Waste Water Treatment Plant (n = 12), and Neal Elementary (n = 12) to yield a meaningful comparison between the facility-specific emissions model and site-surface area emissions method. The comparison of the traditional dispersion model with air measurements (model-with-air measurements) and the facility-specific emissions model with the site-surface area emissions method (model-with-method) at the Harmar Village monitoring site indicates that the site-surface area emissions method yields reasonable exposure estimates.
Discussion
Public health concern regarding air-Mn exposures has been acknowledged since the 1970s and probably earlier (Joselow et al., Citation1978). Government regulation for anthropogenic sources stemming from these health concerns and epidemiologic research on long-term low-level inhalation exposure to Mn in ambient air began in the United States with the publication of a EPA reference concentration (RfC) value of 0.050 µg/m3 in 1993 (EPA, Citation2012c). RfC supporting documents initially focused on the potential risk of Mn emissions from mobile sources from the combustion of the gasoline additive methylcyclopentadienyl manganese tricarbonyl (MMT) (Davis et al., Citation1998). However, subsequent studies have suggested that industrial sources of air-Mn may have greater impacts to ambient air than motor vehicle exhaust from the combustion of gasoline containing MMT (ATSDR, Citation2012).
Existing studies have generally lacked personal air monitoring and completely rely on area monitoring to yield an understanding of study subject exposures. Those that did have personal air monitoring to estimate study subject exposures only had a few days of air sampling in the study. The site-surface area emissions method is proposed as a tool that yields long-term estimates of individual study subject exposures to address this research data gap.
Comparison with TSP air-Mn studies
The mean air-Mn concentrations measured in Marietta and East Liverpool are comparable to those reported in other studies documenting adverse health effects in Mn-exposed communities. The ranges of monthly composite TSP air-Mn averages across all sites sampled between 2003 and 2013 were 0.11–0.39 µg/m3 in Marietta and 0.17–1.50 µg/m3 in East Liverpool. A community study in Quebec that identified neuromotor and neuropsychological deficits and mood changes reported an average TSP air-Mn concentration of 0.022 µg/m3, with a range of 0.009–0.035 µg/m3 (Baldwin et al., Citation1999; Beuter et al., Citation1999; Bowler et al., Citation1999; Mergler et al., Citation1999). In this study, 4 days of ambient air sampling were available to assess inhalation exposures, but personal exposure estimates were not available.
Comparison with PM10 air-Mn studies
Estimated PM10 air-Mn exposures derived from measured and modeled data yielded a long-term average (AM) air-Mn concentration of 0.18 µg/m3 for Marietta and a long-term average (AM) air-Mn concentration of 0.31 µg/m3 for East Liverpool. Rodriguez-Agudelo et al. (Citation2006) reported a statistically significant association between air-Mn concentrations and altered neuromotor function in Mexicans living at various distances from Mn mining operations where limited samples collected at 28 residences in eight communities had a mean PM10 air-Mn concentration of 0.42 µg/m3. Personal exposure estimates were not available to conduct regression analyses of motor test results; however, residents living nearest air monitors with elevated exposures were identified as having a higher risk of motor dysfunction. Lucchini et al. (Citation2012) reported deficits in olfactory and motor function in Italian adolescents exposed to elevated levels of PM10 air-Mn from historical ferro/Mn alloy operations, with an average PM10 air-Mn concentration of 0.05 µg/m3 post facility closure and average soil Mn of 958 mg/kg. Although the latter study did not note associations between air-Mn levels and health outcomes, adverse health outcomes had statistically significant associations with soil Mn levels. This Italian study highlights the significance of deposition, particle transport, and distance from source in the understanding of cumulative exposures. However, multiple confounders complicate the interpretation of these results, including a limited personal air sampling duration of 24 hr.
Comparison with PM2.5 air-Mn studies
In Brazil, a reduction in cognitive function was noted in mothers and their children who were exposed to ferro/Mn alloy emissions where PM2.5 air-Mn averaged 0.15 μg/m3 (Menezes-Filho et al., Citation2009, Citation2011), but only seven 24-hr samples were collected in a single location for this study. In the present study, estimated PM2.5 air-Mn based on modeled and measured data averaged 0.05 and 0.03 μg/m3 in Marietta and East Liverpool, respectively. Haynes et al. (Citation2012) conducted a study in Marietta to evaluate the PM2.5 air-Mn exposure levels in 38 children by collecting limited personal (two consecutive days in 2009 and 2010) and stationary (three 48-hr samples/week during 2 months in 2009 and 4 months in 2010) PM2.5 air samples. The GM concentrations of PM2.5 air-Mn collected during the study were reported to be 0.008 µg/m3 for the personal samples and 0.011 µg/m3 for the stationary samples.
Limitations
A number of nonquantified parameters exist that may influence the extent to which outdoor air-Mn relates to exposures. Only outdoor residential concentration estimates could be derived from available data, which excludes other important contributions to overall exposures, such as outdoor-indoor transport of particles. The results of this analysis do not include parameters such as activity patterns, deposition, and residential and resuspended Mn from ambient sources; however, ratios derived from modeled long-term average air-Mn concentrations can be used for a surrogate of inhalation exposure.
Emission rates are not likely to be consistent from year to year, so the assumption that any unit emission rate is constant and represents long-term emissions could result in over- or underpredicting ambient concentrations for individual years. However, the comparison of modeled and measured data () suggests that the model creates reasonable estimates of long-term ambient concentrations. The site-surface area emissions method is limited by its lack of facility-specific emissions data but uses the same terrain and meteorological preprocessors as site-specific emissions modeling. However, comparison of the two modeling analyses performed for Marietta shows that most estimates are only slightly higher for the site-surface area emissions method compared with facility-specific emissions modeling. A similar comparison was not possible in East Liverpool given the lack of Mn emissions data from on-site sources. However, the ratio approach allows for the easy adjustment of ambient Mn concentrations to reflect measured ambient ranges of air-Mn. If topographic data and site-specific meteorological data are available, receptor concentration ratios should be sufficiently precise to allow calibration with measured data from a reference air monitoring station as was noted in Marietta.
Potential uncertainties with the meteorological data used in Marietta may exist as well. The hourly surface data used in the Marietta modeling is from 1991 to 1995, which was chosen at the time due to concerns about the collection and reporting of newer data. Although these concerns have now been addressed by the availability of 1-min surface data, these data were not readily available at the time of the Marietta modeling. The upper air data used in Marietta was from a station 322 km away; however, upper air data are regionally representative (as opposed to locally representative surface data). Additionally, complex terrain in the vicinity of both Marietta and East Liverpool can affect the predicted concentrations. Although terrain elevations were taken into account in the modeling, higher data resolution could affect estimated concentrations. Mn emissions calculations are impractical at the East Liverpool facility because of the highly variable loading, grinding, and packaging schedule, along with constantly changing production activities. Due to the lack of facility-specific emissions information in East Liverpool, the source parameters and emission rates for the facilities were based entirely on generic assumptions. For example, the unit emission rate of 1 g/sec from the entire facility was assumed to be emitted continuously over the modeled 5-yr period. Assuming a continuous emission rate is standard modeling procedure in instances where there is no basis for allocating variable emissions. Further, knowing the specific variability of emissions is much less important when calculating a long-term average. Since site-specific process emissions were not available and a unit emission rate was used, the facility’s ambient impact on annual average air-Mn concentrations may be over- or underpredicted. However, the use of measured data for model calibration minimized this limitation.
Conclusions
Exposure estimates can be derived directly from modeling facility emissions or can be extrapolated from other methods when emissions data are unavailable. In instances where limited outdoor monitoring data are available, modeling using generic emission rates can yield important information about the relative magnitude of exposure within a geographic area. Using measured and modeled data, outdoor exposure concentrations of ambient air-Mn were calculated for individual study participants of two Ohio communities. This method for estimating personal exposures can prove useful in future studies to assess the relationship between adverse health outcomes and personal exposures to environmental pollutants, where the collection of such data is unfeasible and limited air monitoring data are available.
The methods outlined in this paper can be used to estimate outdoor air-Mn exposures at receptor points when personal monitoring data are limited. This approach may yield more useful ways to estimate exposure than assuming equal exposures to nearby monitoring stations or by collecting a few days of personal air sampling data. It reflects seasonal and temporal variability and can be used to produce individual chronic estimates of outdoor exposure for receptors. Further work should be conducted to examine relationships between indoor and outdoor Mn concentrations and to evaluate how macroenvironment Mn exposures are related to outdoor air-Mn exposure. Microenvironment exposure allocation to overall exposures would be invaluable to understanding the most important aspects of individual exposures at home, school, and in the workplace.
Acknowledgment
We would like to thank the Ohio EPA and the EPA Research Triangle Park/Region 5 for their cooperation and collaboration on this article.
Funding
This work was funded by the United States Federal Government. The views, findings, and conclusions expressed in this paper are those of the authors and do not necessarily reflect the views or policies of the Agency for Toxic Substances and Disease Registry or the U.S. Environmental Protection Agency.
Additional information
Funding
Notes on contributors
Michelle A. Colledge
Michelle A. Colledge is a senior environmental health scientist at the Agency for Toxic Substances and Disease Registry/National Center for Environmental Health/Centers for Disease Control and Prevention.
Jaime R. Julian
Jaime R. Julian is an air modeler at the U.S. Environmental Protection Agency.
Vihra V. Gocheva
Vihra V. Gocheva is a research assistant conducting data analysis and data management tasks at Dr. Rosemarie Bowler’s neuropsychological research laboratory.
Cheryl L. Beseler
Cheryl L. Beseler is a researcher specializing in biostatistics and epidemiology at the Department of Psychology, Colorado State University.
Harry A. Roels
Harry A. Roels is a professor emeritus at the Louvain Centre for Toxicology and Applied Pharmacology in Brussels, Belgium, and a guest professor at the Centre for Environmental Sciences, University of Hasselt, Diepenbeek, Belgium.
Danelle T. Lobdell
Danelle T. Lobdell is an epidemiologist with the U.S. Environmental Protection Agency.
Rosemarie M. Bowler
Rosemarie M. Bowler is a professor emerita at the Department of Psychology, San Francisco State University.
References
- Agency for Toxic Substances and Disease Registry. 2007. Health Consultation: Marietta Area Air Investigation. Washington, DC: United States Department of Health and Human Services.
- Agency for Toxic Substances and Disease Registry. 2009. Health Consultation: Marietta Area Air Investigation. Washington, DC: United States Department of Health and Human Services.
- Agency for Toxic Substances and Disease Registry. 2010. Health Consultation: East Liverpool Air Quality. Washington, DC: United States Department of Health and Human Services.
- Agency for Toxic Substances and Disease Registry. 2012. Toxicological Profile for Manganese. Washington, DC: United States Department of Health and Human Services. http://www.atsdr.cdc.gov/toxprofiles/tp151.pdf
- Baldwin, M., D. Mergler, F. Larribe, S. Bélanger, R. Tardif, L. Bilodeau, and K. Hudnell. 1999. Bioindicator and exposure data for a population based study of manganese. Neurotoxicology 20:343–354.
- Beuter, A., R. Edwards, A. DeGeoffrey, D. Mergler, and K. Hundnell. 1999. Quantification of neuromotor function for detection of the effects of manganese. Neurotoxicology 20:355–366.
- Blond, M., and B. Netterström. 2007. Neuromotor function in a cohort of Danish steel workers. Neurotoxicology 28:336–344. doi:10.1016/j.neuro.2006.07.010
- Bowler, R.M., V. Gocheva, M. Harris, L. Ngo, N. Abdelouahab, J. Wilkinson, R. Doty, R. Park, and H.A. Roels. 2011. Prospective study on neurotoxic effects in manganese-exposed bridge construction welders. Neurotoxicology 32:596–605. doi:10.1016/j.neuro.2011.06.004
- Bowler, R.M., S. Gysens, E. Diamond, S. Nakagawa, M. Drezgic, and H.A. Roels. 2006. Manganese exposure: Neuropsychological and neurological symptoms and effects in welders. Neurotoxicology 27:315–326. doi:10.1016/j.neuro.2005.10.007
- Bowler, R.M., M. Harris, V. Gocheva, K. Wilson, Y. Kim, S. Davis, G. Bollweg, D. Lobdell, L. Ngo, and H.A. Roels. 2012. Anxiety affecting parkinsonian outcome and motor efficiency in adults of an Ohio community with environmental airborne manganese exposure. Int. J. Hyg. Environ. Health 215:393–405. doi:10.1016/j.ijheh.2011.10.005
- Bowler, R.M., D. Mergler, M. Sassine, F. Larribe, and K. Hudnell. 1999. Neuropsychiatric effects of manganese on mood. Neurotoxicology 20:367–378.
- Bowler, R.M., H.A. Roels, S. Nakagawa, M. Drezgic, E. Diamond, R. Park, W. Koller, R.P. Bowler, D. Mergler, M. Bouchard, D. Smith, R. Gwiazda, and R. Doty. 2007. Dose-effect relationships between manganese exposure and neurological, neuropsychological, and pulmonary function in confined space bridge welders. Occup. Environ. Med. 64:167–177. doi:10.1136/oem.2006.028761
- Chia, S.E., S.L. Gan, L.H. Chua, S.C. Foo, and J. Jeyaratnam. 1995. Postural stability among manganese exposed workers. Neurotoxicology 16:519–526.
- Cimorelli, A., S. Perry, A. Venkatram, J. Weil, R. Paine, R. Wilson, R. Lee, W. Peters, and R. Brode. 2005. AERMOD: A dispersion model for industrial source applications. Part I: General model formulation and boundary layer characterization. J. Appl. Meteorol. 44:682–693. doi:10.1175/JAM2227.1
- Couper, J. 1837. On the effects of black oxide of manganese when inhaled into the lungs. Br. Ann. Med. Pharmcol. 1:41–42.
- Davis, J., A. Jarabek, D. Mage, and J.A. Graham. 1998. The EPA health risk assessment of methylcyclopentadienyl manganese tricarbonyl (MMT). Risk Anal. 18:57–70. doi:10.1111/risk.1998.18.issue-1
- Haynes, E., P. Ryan, C. Aimin, D. Brown, S. Roda, and P. Kuhnell. 2012. Assessment of personal exposure to manganese in children living near a ferromanganese facility. Sci. Total Environ. 427– 428:19–25. doi:10.1016/j.scitotenv.2012.03.037
- Iregren, A. 1990. Psychological test performance in foundry workers exposed to low levels of manganese. Neurotoxicol. Teratol. 12:673–675. doi:10.1016/0892-0362(90)90085-Q
- Joselow, M., E. Tobias, R. Koehler, S. Coleman, J. Bogden, and D. Gause. 1978. Manganese pollution in the city environment and its relationship to traffic density. Am. J. Public Health 68:557–560. doi:10.2105/AJPH.68.6.557
- Kim, Y., R. Bowler, N. Abdelouahab, M. Harris, V. Gocheva, and H.A. Roels. 2011. Motor function in adults of an Ohio community with environmental manganese exposure. Neurotoxicology 32:606–614. doi:10.1016/j.neuro.2011.07.011
- Lucchini, R., P. Apostoli, C. Perrone, D. Placidi, E. Albini, P. Migliorati, D. Mergler, M. Sassine, S. Palmi, and L. Alessio. 1999. Long term exposure to “low levels” of manganese oxides and neurofunctional changes in ferroalloy workers. Neurotoxicology 20:287–298.
- Lucchini, R., S. Guazzetti, S. Zoni, F. Donna, S. Peter, A. Zacco, M. Salmistraro, E. Bontempi, N. Zimmerman, and D. Smith. 2012. Tremor, olfactory, and motor changes in Italian adolescents exposed to historical ferro-manganese emissions. Neurotoxicology 33:687–696. doi:10.1016/j.neuro.2012.01.005
- Lucchini, R., L. Selis, D. Folli, P. Apostoli, A. Mutti, O. Vanoni, A. Iregren, and L. Alessio. 1995. Neurobehavioral effects of manganese in workers from a ferroalloy plant after temporary cessation of exposure. Scand. J. Work Environ. Health 21:143–149. doi:10.5271/sjweh.1369
- Menezes-Filho, J., C. Novaes, J. Moreira, P. Sarcinelli, and D. Mergler. 2011. Elevated manganese and cognitive performance in school-aged children and their mothers. Environ. Res. 111:156–163. doi:10.1016/j.envres.2010.09.006
- Menezes-Filho, J., C. Paes, A. Pontes, J. Moreira, P. Sarcinelli, and D. Mergler. 2009. High levels of hair manganese in children living in the vicinity of a ferro-manganese alloy production plant. Neurotoxicology 30:1207–1213. doi:10.1016/j.neuro.2009.04.005
- Mergler, D., G. Huel, R. Bowler, A. Iregren, S. Bélanger, M. Baldwin, R. Tardif, A. Smargiassi, and L. Martin. 1994. Nervous system dysfunction among workers with long-term exposure to manganese. Environ. Res. 64:151–180. doi:10.1006/enrs.1994.1013
- Mergler, D., M. Baldwin, S. Belanger, F. Larribe, A. Beuter, R. Bowler, M. Panisset, R. Edwards, A. de Geoffrey, M. Sassine, and K. Hudnell. 1999. Manganese neurotoxicity, a continuum of dysfunction: Results from a community-based study. Neurotoxicology 20:327–342.
- National Climatic Data Center. n.d. National Oceanic and Atmospheric Administration. http://www.ncdc.noaa.gov/oa/ncdc.html ( accessed January 2012).
- Ohio Environmental Protection Agency. 2012a. Raw Data Packet—Ambient Measurements for Air Monitoring Stations in Marietta, OH. Columbus, OH: Division of Air Pollution Control, Ohio Environmental Protection Agency.
- Ohio Environmental Protection Agency. 2012b. Raw Data Packet—Ambient Measurements for Air Monitoring Stations in East Liverpool, OH. Columbus, OH: Division of Air Pollution Control, Ohio Environmental Protection Agency.
- Riojas-Rodriguez, H., R. Solis-Vivanco, A. Schilman, S. Montes, S. Rodríguez, C. Ríos, and Y. Rodriguez-Agudelo. 2010. Intellectual function in Mexican children living in a mining area and environmentally exposed to manganese. Environ. Health Perspect. 118:1465–1470. doi:10.1289/ehp.0901229
- Rodriguez-Agudelo, Y., H. Riojas-Rodriguez, C. Rios, I. Rosas, E. Sabido-Pedraza, J. Miranda, C. Siebe, J. Texcalac, and C. Santos-Burgoa. 2006. Motor alterations associated with exposure to manganese in the environment in Mexico. Sci. Total Environ. 368:542–556. doi:10.1016/j.scitotenv.2006.03.025
- Roels, H.A., R. Bowler, Y. Kim, B. Claus-Henn, D. Mergler, P. Hoet, V. Gocheva, D. Bellinger, R Wright, M. Harris, Y. Chang, M. Bouchard, H. Riojas-Rodriguez, J. Menezes-Filho, and M. Tellez-Rojo. 2012. Manganese exposure and cognitive deficits: A growing concern for manganese neurotoxicity. Neurotoxicology 33:872–880. doi:10.1016/j.neuro.2012.03.009
- Roels, H.A., P. Ghyselen, J. Buchet, E. Ceulemans, and R. Lauwerys. 1992. Assessment of the permissible exposure level to manganese in workers exposed to manganese dioxide dust. Br. J. Ind. Med. 49:25–34. doi:10.1136/oem.49.1.25
- Roels, H.A., R. Lauwerys, J. Buchet, P. Genet, M. Sarhan, I. Hanotiau, M. de Fays, A. Bernard, and D. Stanescu. 1987. Epidemiological survey among workers exposed to manganese: Effects on lung, central nervous system, and some biological indices. Am. J. Ind. Med. 11:307–327. doi:10.1002/(ISSN)1097-0274
- Roels, H.A., M. Oretega-Eslava, E. Ceulemens, A. Robert, and D. Lison D. 1999. Prospective study on the reversibility of neurobehavioral effects in workers exposed to manganese dioxide. Neurotoxicology 20:255–271.
- Roels, H.A., M. Sarhan, I. Hanotiau, M. de Fays, P. Genet, A. Bernard, J. Buchet, and R. Lauwerys. 1985. Preclinical toxic effects of manganese in workers from a manganese salts and oxides producing plant. Sci. Total Environ. 42:201–206. doi:10.1016/0048-9697(85)90022-1
- U.S. Environmental Protection Agency. 1984. Health Assessment Document for Manganese. Final Draft. EPA600883013F. Cincinnati, OH: U.S. Environmental Protection Agency, Office of Research and Development.
- U.S. Environmental Protection Agency. 1996. AP 42, Fifth Edition: Compilation of Air Pollutant Emission Factors, Volume 1: Stationary Point and Area Sources; Appendix B.2, Generalized Particle Size Distributions. Research Triangle Park, NC: U.S. Environmental Protection Agency, Office of Air Quality and Standards.
- U.S. Environmental Protection Agency. 1999a. Compendium Method IO 2.1—Sampling of Ambient Air for Total Suspended Particulate Matter (SPM) and PM10 Using High Volume (HV) Sampler. EPA/625/R-96/010a. Washington, DC: U.S. Environmental Protection Agency.
- U.S. Environmental Protection Agency. 1999b. Compendium Method IO 3.5—Determination of Metals in Ambient Particulate Matter Using Inductively Coupled Plasma/Mass Spectrometry (ICP/MS). EPA/625/R-96/010a. Washington, DC: U.S. Environmental Protection Agency.
- U.S. Environmental Protection Agency. 2005. Air dispersion and deposition modeling. In Human Health Risk Assessment Protocol for Hazardous Waste Combustion Facilities, chapter 3. EPA530-R-05-006. Washington, DC: U.S. Environmental Protection Agency.
- U.S. Environmental Protection Agency. 2010a. Results of Scanning Electron Microscopy (SEM), Laser Ablation Inductively Coupled Plasma Mass Spectrometry (LA-ICP-MS), and Digestion Analysis of Glass Fiber Filters collected April 2007 to March 2008 around Marietta, Ohio. NEIC Project No.: VP0591.
- U.S. Environmental Protection Agency. 2010b. Speciated Chromium Analysis, Scanning Electron Microscopy, and X-Ray Diffractometry of Glass Fiber Filters collected at Two Locations in the East Liverpool, Ohio, Area from January 2006 to August 2007. NEIC Project No.: VP0856.
- U.S. Environmental Protection Agency. 2010c. Cooperative Agreement Modeling Report Marietta, Ohio. Chicago, IL: Air and Radiation Division.
- U.S. Environmental Protection Agency. 2012a. Air Quality System, Query for National Manganese Data. http://www.epa.gov/ttn/airs/airsaqs/
- U.S. Environmental Protection Agency. 2012b. Cooperative Agreement Modeling Report S.H. Bell East Liverpool, Ohio. Chicago, IL: Environmental Protection Agency.
- U.S. Environmental Protection Agency. 2012c. Integrated Risk Information System (IRIS)—Manganese. http://www.epa.gov/iris
- United States Geological Survey. Seamless Data Warehouse. http://seamless.usgs.gov/
- World Health Organization. 1999. Prevention and Control Exchange (PACE)—Hazard Prevention and Control in the Work Environment—Airborne Dust. WHO/SDE/OEH/99.14. Geneva, Switzerland: World Health Organization.