
ABSTRACT
In this study, we report on total gaseous mercury (TGM) field observations made in the rural area of Shanghai, Chongming Island, China, from September 2009 to April 2012. The average TGM was 2.65 ± 1.73 ng m−3 in Chongming Island, which is higher than the TGM background value of the Northern Hemisphere (1.5–1.7 ng m−3); this indicates that to some extent, the Chongming area has been affected by anthropogenic mercury emissions. The observed TGM follows a seasonal pattern; concentrations are highest in winter, followed by autumn, summer, and spring. There is also a clear diurnal variation in TGM. All peak values appear between 7:00 and 9:00 in all four seasons; this appears to be the result of the height change in the atmospheric boundary layer that occurs between day and night. TGM concentrations in Chongming remain high in the westerly wind direction, especially in the southwest direction because of its low frequency, so the greatest source contribution to TGM in Chongming lies to the northwest. Wind speed is also a significant factor affecting TGM, and was negatively correlated with TGM concentrations. TGM is also closely related to carbon monoxide (CO) concentrations, indicating that TGM is impacted by human activities. The slope of the linear fitting of TGM and CO demonstrates that the contribution of noncoal source emissions to TGM in summer is greater than in autumn, mainly because the high temperature and intensive sunlight in summer increase mercury emissions from natural sources.
Implications: Except for some studies in the coastal areas (e.g., Kang Hwa Island by Kim et al., 2006, An–Myun Island by Kim et al., 2002, and Okinawa by Chan et al., 2008), data specifically for coastal areas are lacking. Monitoring of total gaseous mercury (TGM) in the rural area of Shanghai, Chongming Island, can help us understand mercury distribution.
Introduction
Background
Mercury (Hg) transmitted through the atmosphere globally is a cross-border pollutant, and Hg contamination has become a global environmental problem. Internationally, developed countries have brought Hg pollution under control through international agreements; Japan and the European Union have also been pushing to establish a global convention for the control of Hg pollution. The Panel of Source Attribution of Atmospheric Mercury Deposition of the 8th International Conference on Mercury as a Global Pollutant (ICMGP) recommended that a global Hg monitoring network be established to trace long-term changes in atmospheric Hg concentrations (Lindberg et al., Citation2007).
Mercury is present in the atmosphere in three inorganic forms (Schroeder and Munthe, Citation1998): gaseous elemental Hg (GEM, Hg°), reactive gaseous Hg (RGM, Hg2+), and particulate Hg (HgP). Total gaseous Hg (TGM) consists of GEM and RGM, to which GEM contributes over 95% (Lindqvist and Rodhe, Citation1985; Lindqvist et al., Citation1991). Because GEM has very low solubility in water and its chemical reaction rate with other components in the atmosphere, including ozone (O3), hydrogen peroxide (H2O2), hydroxide, and nitrate radicals, is very low (Hall, Citation1995; Dastoor and Larocque, Citation2004; Holmes et al., Citation2006), GEM has a long atmospheric lifetime (0.5–2 years) and can be transported across thousands of kilometers through the atmosphere (Lindqvist and Rodhe, Citation1985; Schroeder and Munthe, Citation1998). During the long-distance transport, Hg0 may react chemically with atmospheric oxidants such as O3, H2O2, and halogen elements; these reactions result in the formation of Hg2+, and can then reach the ground via dry and wet deposition.
Field observations and recordings of atmospheric Hg concentration is a fundamental step to understanding the behavior of Hg in the environment (Fitzgerald, Citation1995). Measurements of airborne Hg concentrations have been conducted over several years at different locations in Europe, Asia, and North America at urban, rural, and remote sites, and even in regions of the Atlantic Ocean (Iverfeldt et al., Citation1995; Lee et al., Citation1998; Pecheyran et al., Citation2000; Ebinghaus and Slemr, Citation2000; Poissant, Citation2000; Kim and Kim, Citation2001; Ebinghaus et al., Citation2002; Liu et al., Citation2002; Sakata and Marumoto, Citation2002; Kellerhals et al., Citation2003; Temme et al., Citation2003; Cohen et al., Citation2004; Fang et al., Citation2004; Feng et al., Citation2004; Lynam and Keeler, Citation2005).
Airborne Hg concentrations in coastal areas in China were difficult to find in the literature. There are even fewer data from recent studies on the distribution of airborne Hg in coastal areas in Asia, even though Asia is now regarded as the largest geographical source contributor of anthropogenic Hg emissions because of the recent rapid economic development of China and India (Pacyna and Pacyna, Citation2002). In this study, we report TGM measurements obtained from Chongming Island, Shanghai, from September 2009 to April 2012. We also examine the seasonal and diurnal variations in TGM in the coastal area and discuss its correlation with carbon monoxide (CO) and wind directions and velocity.
Methods
Sampling site
The atmospheric Hg monitoring site (Chongming site) is located on the roof of the Shanghai Chongming Island Dongtan National Nature Reserve Management Building (latitude 31°31′20″, longitude 121°54′30″, about 11 m above ground level). Its distance from the Dongtan wetlands and from the Pacific Ocean is about 5 km. The monitoring site is located about 50 km from the center of Shanghai (People’s Square) and about 30 km from the edge of Shanghai (outer ring highway). There are no significant industrial sources of pollution within a 5-km radius of the monitoring site, and the population density is low.
We conducted field observations (environmental monitoring) at the Chongming site; we measured atmospheric Hg, O3, CO, black carbon, PM2.5, and reactive odd nitrogen species (NOy) ().
Table 1. Instruments list in Chongming site.
We acquired on-site meteorological data at the same time through the Vantage Pro2 (number 6152C) cabled weather stations. Data obtained here included wind speed, wind direction, inside temperature, outside temperature, inside relative humidity, outside relative humidity, rainfall, rain rate, solar radiation, and barometric pressure.
Instruments used and measuring methods
The Tekran model 2537B continuous mercury vapor analyzer (Tekran Instruments Corporation, Scarborough, ON, Canada), was used for TGM monitoring in ambient air; this instrument performs continuous, unattended measurements of TGM with an update rate as low as 2.5 min and an air detection limit of 0.1 ng (Hg)/m3.
Sensors of the Tekran 2537B conform to, or are equal to, U.S. Environmental Protection Agency (EPA) Method IO-5, “Sampling and Analysis of Vapor and Particulate Phase Hg in Ambient Air Utilizing Cold Vapor Atomic Fluorescence Spectrometry.” This method is part of the Compendium of Methods for the Determination of Inorganic Compounds in Ambient Air (EPA/625/R-96/010a). The process is divided into the sampling stage and analysis stage and is referred to as dual-amalgamation cold vapor atomic fluorescence spectrometry (CVAFS).
During the sampling stage, a Teflon filter pack (outside diameter ¼ inch) with a glass fiber filter (pore size 0.2 μm, diameter 47 mm) is placed in front of the traps to remove fine particulate material from the air being sampled. Sampling air is pulled through the vapor-phase sampling system using a mass-flow-controlled vacuum pump at a minimal flow rate of 0.3 Lpm (L/min). Gas-phase Hg including elemental and divalent Hg is collected by a gold cartridge without memory effect and is determined directly by CVAFS.
In the analysis stage, Hg collected on the cartridge is then thermally desorbed and carried into the CVAFS analyzer (wavelength = 253.7 nm) by inert gas (argon). The resulting voltage peak is integrated to produce a peak area for the sample.
An optical feedback loop for constant lamp intensity and optical path argon purge provide a stable and reliable detector. A dual-cartridge design allows for alternate sampling and analysis (desorption), resulting in continuous measurement of Hg in the air every 5 min. The Tekran 2537B minimum detectable concentration (0.1 ng m−3) is much lower than the concentration of atmospheric TGM in the study area.
One of the reasons for using the Tekran 2537B is to allow for the comparison between our data and those obtained by other researchers. The Tekran 2537B is the instrument required by the National Atmospheric Deposition Program (NADP; a consortium of the National Oceanic and Atmospheric Administration [NOAA], EPA, U.S. Geological Survey [USGS], and universities) for the measurement of atmospheric Hg concentrations. The NADP program would reject data collected and submitted to the national archive if the Hg were measured with any other sensors. This requirement is in place so that all NADP sites (including NOAA’s three sites) are instrumented identically and follow identical procedures.
Here, the analyzer was programmed to sample air at a flow rate of 1.0 L/min for a 5-min sampling interval. The TGM observations discussed in the following were averaged over a 1-hr interval to match the time scale of the meteorological parameters.
Data quality control
Two types of data quality control were performed: self-calibration and manual injection calibration. Self-calibration is executed by the Tekran 2537B continuously every 25 hr from an internal permeation Hg vapor source traceable to the NIST standard. Manual injection calibration uses the Tekran 2505 standard Hg vapor source (generator). Standard Hg vapor at the outside temperature is extracted and injected into the only zero air passing by the Tekran 2537B. For this artificial measurement, gold cartridges A and B alternately and independently output their results. Errors between gold cartridges A and B must be less than 5%, and errors for three continuous calibrations must be less than 5%.
Results
Overall description
The sampling period took place from September 2009 to April 2012. In total, 8,453 TGM data points were obtained in the sampling period; the TGM concentration ranged from 0.70 to 18.37 ng m−3, and the minimum concentration is still far higher than the instrumental limit of detection (0.1 ng m−3).
Because there was a failure of the local power supply and instrument failure resulting from lightning, the overall sampling period is divided into three periods. lists the TGM concentrations at Chongming Island during the three periods.
Table 2. September 2009 to April 2012 TGM concentration in three sampling periods (ng m−3).
On average, 2,111 TGM data points were obtained from September 15 to December 17, 2009, and the average TGM concentration was 2.50 ± 1.50 ng m−3;
On average, 3676 TGM data points were obtained per hour from July 14, 2010, to February 8, 2011, and the average TGM concentration was 2.87 ± 1.91 ng m−3;
On average, 2666 TGM data points were obtained per hour from November 28, 2011, to April 27, 2012, and the average TGM concentration was 1.99 ± 0.95 ng m−3.
TGM concentrations were highest in November and December of 2009 and 2010 with several peaks, while the TGM concentrations in the other months were stable and low.
Because there is overlap of months in each sampling period (such as September to December 2009/2010, December 2010 to January 2011, December 2011 to January 2012), the average values of the different sampling period do not accurately represent the TGM concentrations in the Chongming area for the whole year. The concentrations extracted artificially from July 14, 2010, to January 31, 2011 (7 months), and February 1 to April 31, 2012 (3 months), are used to represent the annual TGM concentrations in the Chongming area; these values are based on an average of 5,023 data points per hour. These data are the basis for the seasonal and diurnal variations in TGM concentrations discussed in the following.
According to local weather conditions, July and August 2010 are defined as summer, September, October, and November 2010 as autumn, December 2010, January 2011, and February 2012 as winter, and March and April 2012 as spring. The average annual TGM in the Chongming area calculated by this method was 2.65 ± 1.73 ng m−3.
lists atmospheric Hg field observations in urban, rural, and remote areas. TGM concentrations at Chongming Island are lower than those of other cities in China, as well as those of some international cities. In addition, the TGM concentrations at Chongming Island are close to those of Leigong Mountain and lower than those of the rural areas in Changpai Mountain, Gongga Mountain, and Kang Hwa Island in Korea, but higher than those of rural areas in European countries and the United States.
Table 3. Summary of field observations of TGM.
The concentration of atmospheric Hg in downtown Shanghai was obtained from the Shanghai East China University of Science and Technology. The team from the university set up an atmospheric Hg sampling site in a laboratory building on the Xuhui campus with a sampling height of 15 m. There are no major industrial emission sources within 1,000 m of the site, which is located 600 m away from arterial traffic and about 900 m from Shanghai South railway station (Zhang et al., Citation2010). Atmospheric Hg was collected by a gold amalgam collecting pipe, which was heated at 450–500°C to release Hg, and Hg0 was introduced in gaseous state at a flow velocity of 600 mL min−1 with nitrogen as the carrier gas to the absorption liquid with 0.2% potassium permanganate and sulfuric acid solution. An atomic fluorescence spectrophotometer (AFS-930) was used to measure Hg concentrations.
The results show that the range of total atmospheric Hg in downtown Shanghai from 2008 to 2010 was 7.79 ± 3.29 ng m−3, which is three times higher than that of rural areas, and close to the pollution levels of Guiyang and Beijing (Feng et al., Citation2004; Wang et al., Citation2007).
Seasonal and monthly variation
lists the TGM concentrations in each season in the Chongming area. The TGM concentrations rank as follows: winter (2.94 ± 1.98 ng m−3) > autumn (2.75 ± 1.89 ng m−3) > summer (2.49 ± 1.38 ng m−3) > spring (2.22 ± 1.07 ng m−3). The standard deviation and maximum concentrations in autumn and winter are higher than those of summer and spring, indicating that the TGM concentrations fluctuate greatly in autumn and winter in the Chongming area.
Table 4. Seasonal TGM concentration in Chongming (ng m−3).
No central heating is available in Shanghai, so there is no obvious heating period. The seasonal variation observed may be related to the seasonal changes in meteorological conditions and seasonal changes affected by external sources.
Temperature inversion occurs easily in autumn and winter in the Yangtze River Delta, which results in low atmospheric diffusivity and an increased atmospheric pollutant concentration. The winter heating supply in the northern area, such as in Shandong, causes an increase in Hg emission from bunker coal. The northwest prevailing wind in winter brings Hg discharged by the industrial companies in the provinces of Henan and Jiangsu, resulting in increases in TGM concentrations in winter in the Chongming area.
Seasonal TGM concentrations in downtown Shanghai from 2008 to 2010 occur as follows: autumn (9.30 ± 2.48 ng m−3) > winter (8.32 ± 2.79 ng m−3) > spring (7.78 ± 2.33 ng m−3) > summer (2.16 ± 3.29 ng m−3). This result differs from the seasonal variations in atmospheric Hg observed in rural areas in Shanghai.
These results indicate that the spatial distribution of atmospheric Hg is not a regional phenomenon and has different spatial characteristics in different areas, with no obvious consistency at the global level.
shows the statistical results of monthly TGM concentrations in the Chongming area. As seen in the table, the maximum TGM concentrations occur in November and December, followed by October and January, while the minimum concentration occurs in September. The high TGM concentrations in November and December increase the average concentration of TGM in autumn and winter.
Table 5. Monthly TGM concentration in Chongming (ng m−3).
Diurnal variation
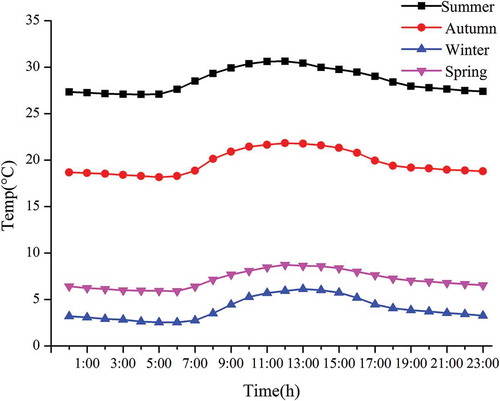
shows the diurnal variation in TGM concentrations in the Chongming area in different seasons, while , , , and show the diurnal variation in meteorological conditions such as temperature, relative humidity, wind speed, and solar radiation intensity. Time is reported using a 24-hr clock; therefore, daytime in this area is from 06:00 to 18:00, and nighttime is from 18:00 to 06:00 in the following day.
Figure 1. The sampling procedure.
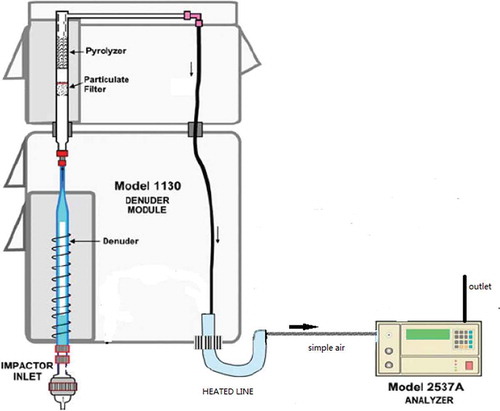
Figure 2. TGM diurnal variation in the different seasons in Chongming Island.
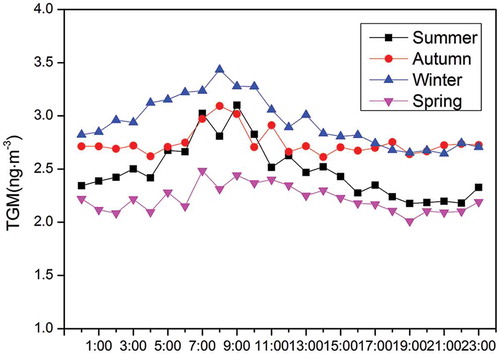
Figure 3. Weather conditions: temperature.
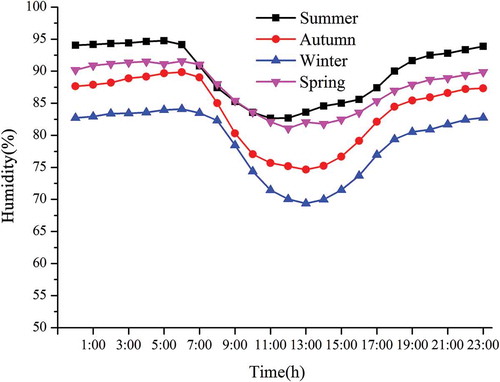
Figure 4. Weather conditions: relative humidity.
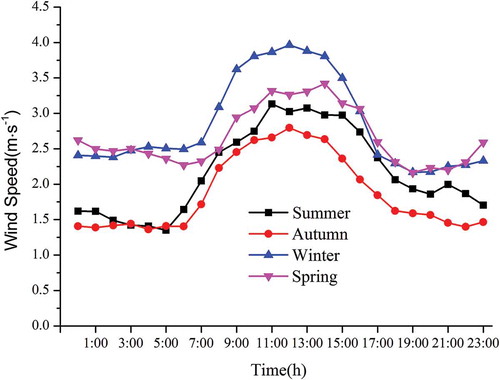
Figure 5. Weather conditions including wind speed.
Diurnal variation in TGM in the Chongming area are similar between different seasons; the maximum TGM concentration occurs between 7:00 and 9:00 in all four seasons, and the TGM concentration increases gradually starting at 0:00 at night, reaches a peak at around 8:00, and then begins to decrease slowly. This phenomenon is mainly a result of the change in height of the atmospheric boundary layer. Temperature and wind speed at night are lower than in the daytime; as a result, the height of the atmospheric boundary layer is relatively low at night, which decreases diffusion of air pollutants. TMG gradually accumulates in the atmospheric boundary layer and reaches its peak in the morning. Because temperature, wind speed, and the height of the atmospheric boundary layer begin to increase after sunrise, the density of TGM tends to lessen under these conditions, which enhance diffusion. also illustrates that TGM fluctuations occur over a small range during the day in spring and autumn; differences were 0.47 ng m−3 and 0.48 ng m−3, respectively, which are between the highest and lowest concentrations. More intensive fluctuations occur during the day in summer and winter; differences were 0.92 ng m−3 and 0.79 ng m−3, respectively, which are between the highest and lowest concentrations being.
Figure 6. Weather conditions: solar radiation.
illustrates the variation in TGM concentrations in the Chongming area during the day and night in different seasons. The average daytime TGM concentration is slightly higher than that at night in all four seasons, and the lowest difference in TGM concentration day and night occurs in autumn. The t-test was applied to analyze the significance of the differences between the daytime and nighttime TGM concentrations in each season. In autumn, TGM concentrations were not significantly different between day and night; however, in all other seasons, the TGM concentration were significantly higher in the day than at night, with a confidence level of 99.5%.
Discussions
Impact of wind direction and speed on TGM
Chongming Island is typically subject to both continental and ocean wind simultaneously, and wind direction and speed are vital factors influencing the distribution of gaseous Hg.
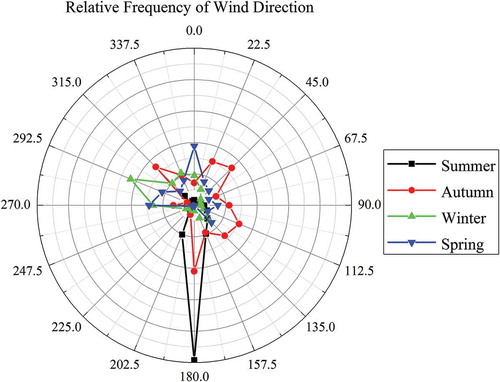
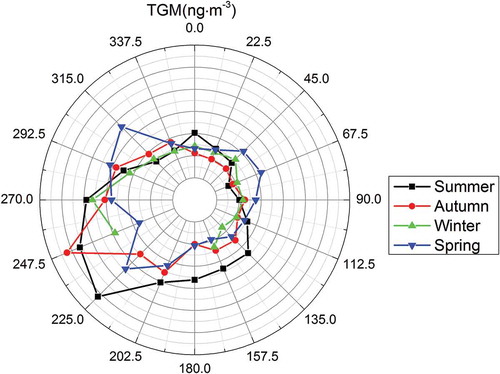
and show the distribution of the relative frequency of the wind direction and the TGM distribution at different wind directions in the Chongming area during the monitoring period. As shown in the figure, south is the prevailing wind direction in the summer with a rate of 50%. In autumn, the wind direction is relatively evenly distributed between due south, northeast, southeast, and northwest; of these, southeast, northeast, and south winds mainly occur in September and October, while the northwest wind occurs mainly in November. In winter, the prevailing wind direction is west–northwest-trending, and in spring, north and west winds are prevailing.
Figure 7. The TGM circadian variation in different seasons.
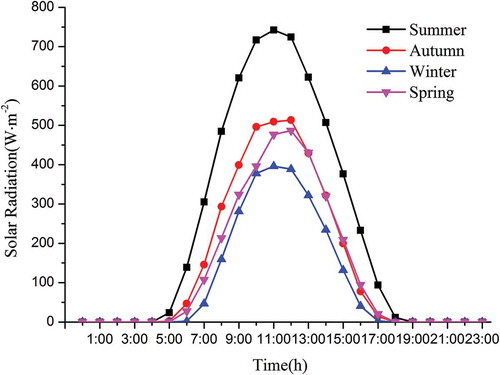
Figure 8. The relative frequency of wind direction.
We also examined TGM concentrations with respect to wind direction. The highest TGM concentrations occur in the southwest, due west, and northwest wind directions. This may be result of the presence of numerous coal-fired power plants and nonferrous metals smelting works located in the continental industrial zone in the west of Chongming; atmospheric Hg discharged by these would flow into Chongming via westerly winds. Chongming is surrounded by sea to the east, and wind from the sea is relatively clean; thus, the atmospheric Hg concentration is lower during the occurrence of easterly winds.
Mercury emissions from sites situated in the west of Chongming such as Jiangsu, Shanghai, and the Zhejiang Province are relatively high, while there is no anthropogenic emission source in the sea situated in the east of Chongming. Therefore, the atmospheric Hg concentration in Chongming Island is mainly affected by wind direction.
Heavy pollution in summer and spring mostly occurs in periods during which westerly winds are blowing. Because the prevailing wind direction in summer and spring is not westerly, the TGM concentration is low. Easterly wind is prevailing in September and October, and then TGM concentrations are low. However the prevailing wind direction in November is northwest, so the high November TGM concentrations enhance the average TGM concentration of the whole autumn. West–northwest-trending wind is prevailing in winter, carrying atmospheric Hg discharged by Jiangsu, which leads to high TGM concentrations in winter.
In conclusion, wind direction is an important factor influencing TGM concentrations at Chongming Island. Because of the anthropogenic sources of Hg emissions located in the inland industrial zone, TGM concentrations increase when westerly winds blow toward Chongming Island. However, when easterly winds from the ocean are prevailing, the impact of anthropogenic sources of Hg emissions decreases and TGM concentrations is low. Anthropogenic Hg emissions from the western part of the mainland, especially places with high Hg emissions such as Jiangsu, Shanghai, and Zhejiang, which are the main sources of atmospheric Hg measured at Chongming Island, cause an increase in TGM concentration at Chongming Island, which has TGM concentrations that are higher than the background value of the Northern Hemisphere.
Wind speed is another factor influencing atmospheric Hg concentrations at Chongming Island. Wind direction represents the input direction of the atmosphere, while wind speed reflects the mobility of atmosphere. Wind direction determines the source of pollutants, while wind speed affects diffusion of pollutants; for example, high-speed wind will accelerate the diffusion of pollutants.
illustrates that diurnal variation in wind speed is in line with its seasonal variation pattern. The figure also demonstrates that wind speed is higher during the day than at night, and reaches at maximum between 11:00 to 14:00, while the range of fluctuation of wind speed is lower at night. Wind speed is highest in winter, followed by that in spring, then autumn.
Because TGM concentrations are affected by wind direction as well as wind speed, we studied wind speed and TGM concentrations; we chose the period from September 12 to 20, 2010, to examine the relationship between wind speed and TGM because wind direction was stable during this period, ranging from 90° to 150°. The results demonstrate that wind speed plays a more important role in TGM concentrations than does wind direction. Variations in TGM concentration and wind speed are shown in . The variation in TGM concentrations is negatively related with that of wind speed; that is, TGM concentrations remain low when wind speed is high and vice versa. A clear negative correlation between TGM concentration and wind speed is present, with a correlation coefficient of –0.47, which indicates that high-speed wind helps TGM to spread, causing a decrease TGM concentration and causing the diffusivity of TGM to be low when wind speed is low, leaving TGM to accumulate in the atmosphere.
Figure 9. The TGM frequency distribution.
shows average TGM concentrations from the entire monitoring period at different wind speed intervals. To avoid the influence of wind direction, statistics were conducted separately for wind between 0° and 180° (mainly clean ocean wind) and between 180° to 360° (mainly continental wind carrying atmospheric mercury with high concentration). According to the statistics, only average TGM concentrations in the 0° to 180° wind direction decline as wind speed increases, and concentrations reach a maximum when the wind speed is lower than 1.0 m s−1; average TGM concentrations in the 180° to 360° wind direction decrease with some fluctuation, and the TGM concentration researches a maximum when the wind speed is 1.0–2.0 m s−1.
Table 6. TGM average concentration under different wind speeds (2009/9/17–2009/12/17, 2010/7/14–2011/2/8, 2011/11/28–2012/3/25).
Relationship between TGM and carbon monoxide
Bunker coal is the main emission source of TGM (mainly GEM) and CO (Wu et al., Citation2006; Wang et al., Citation2005) in China. TGM and CO have similar transmission characteristics and are therefore closely related at many monitoring sites. The relatively high TGM and CO concentrations in Chongming indicate that atmospheric Hg concentrations in Chongming are mainly the result of human activities.
illustrates the correlation between TGM and CO in the Chongming area from July to November 2010. Correlation coefficients of TGM and CO from July to November are, successively, 0.95, 0.91, 0.42, and 0.75. Airflow of different directions carry different concentrations of TGM and CO, so frequent changes in wind direction will decrease the correlation coefficient between TGM and CO. TGM and CO will be relatively high when the wind direction is stable; therefore, the correlation coefficient of TGM and CO indirectly reflects the stability of the wind direction in this period. In summer (July and August) when south wind is prevailing in Chongming Island (see ), there is only one source of TGM and CO and thus the correlation is the strongest. In autumn (September and October), when the wind direction changes frequently, sources of TGM and CO are more complicated and the correlations are weaker than in spring.
Figure 10. The 2010/9/12–9/20 comparison between TGM and wind speed (Wspd).
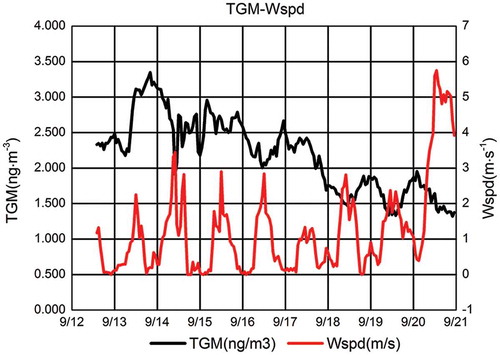
Figure 11. TGM and CO relationship.
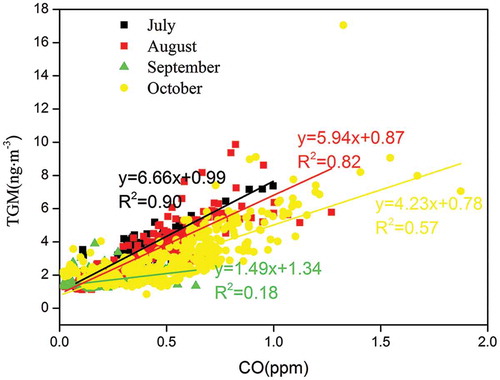
illustrates that the slope of the linear fitting (ΔTGM/ΔCO) of TGM and CO represents the contributions from bunker coal emissions to TGM. The higher the slope, the lower is the contribution of bunker coal and the greater are the contributions of noncoal sources emissions (mainly consisting of melting nonferrous metals and natural sources). Slopes in July, August, and October are 6.66, 5.94, and 4.23, respectively. This shows that the contribution of bunker coal increases from July to October, while that of noncoal sources declines over that period. In July and August, solar radiation intensity and high temperatures promote Hg release from soil and water; in October, solar radiation intensity and temperatures are low, and the release of Hg remains low. Nonferrous metals melting is relatively low in the Yangtze River Delta; thus, natural Hg emission sources are the primary cause of the observed change in slope.
Long-term atmospheric Hg observation in China is limited. The Western countries always requested China to be responsible for the long-range transport of Hg to their territory. In worldwide conference, the heated debate of this issue troubled the China government. Thus, two actions have been taken by the China National Environmental Protection Agency. One is the large-scale survey for Hg-related industries from 2006. Coal-fired power plants and metal smelting are the critical areas. The other is long-term Hg environmental observation. The Chongming station is unique for its location site between China mainland and the Pacific Ocean that provides the behavior of air puff with Hg crossing the Chongming Island. Although the research is not perfect, it did report the truth.
Conclusion
The annual average TGM concentration in the Chongming area is 2.65 ± 1.73 ng m−3, which is higher than the TGM background value of the Northern Hemisphere (1.5–1.7 ng m−3); this indicates that to some extent, the Chongming area has been affected by anthropogenic Hg emissions. TGM concentrations were highest in winter (2.94 ± 1.98 ng m−3), followed by autumn (2.75 ± 1.89 ng m−3), summer (2.49 ± 1.38 ng m−3) and spring (2.22 ± 1.07 ng m−3). TGM in downtown Shanghai from 2008 to 2010 was 7.79 ± 3.29 ng m−3, 3 times higher than that in the rural area, and close to the pollution level of Guiyang and Beijing.
TGM concentrations exhibit a very clear diurnal pattern: All peak values appear between 7:00 and 9:00 in all seasons. This is likely the result of the change in height of the atmospheric boundary layer that occurs between day and night.
TGM concentrations in Chongming remain high in the westerly wind direction, especially in the southwest directions, because of its low frequency, so the greatest contributor to TGM in Chongming lies to the northwest. The northwest wind blows most frequently in autumn and winter when TGM concentrations remain high. Wind speed is a significant factor affecting TGM concentrations, and is negatively correlated with TGM concentrations.
TGM is closely related to CO, which indicates that TGM concentrations are mostly significantly impacted by human activities. The slope of the linear fitting of TGM and CO reflects that the contribution of noncoal sources emissions to TGM in summer is greater than in autumn, mainly because the high temperature and intense sunlight in summer increase Hg emissions from natural sources.
Research Highlights
Annual average TGM content in Chongming area is 2.65±1.73 ng·m−3 which is higher than 1.5~1.7 ng·m−3, the TGM background value of Northern Hemisphere
Distribution of TGM content possesses a very obvious diurnal variation law that all peak values appear between 7:00 and 9:00 in the four seasons for the reason of the height change of the atmospheric boundary layer in the day time and at night.
TGM concentration in Chongming keeps a high level in westerly wind direction, especially in southwest wind due to its low frequency.
TGM is closely related to CO and this shows TGM content is mostly impacted by human activities.
Funding
This work was financially supported by the National Natural Science Foundation (41365009).
Additional information
Notes on contributors
Chunyan Diao
Chunyan Diao is an associate professor at the School of Chemistry and Eco-Environmental Engineering (School of Chinese Pharmacy), Guizhou Minzu University, in Guizhou Province, China.
Jianfeng Li
Jianfeng Li is an associate professor and Bin Zhang and Sichuang Tang are both chief scientists and professors at the Beijing Municipal Institute of Labor Protections, Beijing Academy of Science and Technology, Beijing, China.
Bin Zhang
Jianfeng Li is an associate professor and Bin Zhang and Sichuang Tang are both chief scientists and professors at the Beijing Municipal Institute of Labor Protections, Beijing Academy of Science and Technology, Beijing, China.
Shichuang Tang
Jianfeng Li is an associate professor and Bin Zhang and Sichuang Tang are both chief scientists and professors at the Beijing Municipal Institute of Labor Protections, Beijing Academy of Science and Technology, Beijing, China.
References
- Cohen, M., R. Artz, R. Draxler, P. Miller, L. Poissant, D. Niemi, D. Ratte, M. Deslauriers, R. Duval, and R. Laurin. 2004. Modeling the atmospheric transport and deposition of mercury to the Great Lakes. Environ. Res. 95:247–65. doi:10.1016/j.envres.2003.11.007
- Chand, D., D. Jaffe, E. Prestbo, et al. 2008. Reactive and particulate mercury in the Asian marine boundary layer. Atmos. Environ. 2008, 42:7988–96. doi:10.1016/j.atmosenv.2008.06.048
- Dastoor, A.P., and Y. Larocque. 2004. Global circulation of atmospheric mercury: a modeling study. Atmos. Environ. 38:147–61. doi:10.1016/j.atmosenv.2003.08.037
- Ebinghaus, R., H.H. Kock, A.M. Coggins, T.G. Spain, S.G. Jennings, and C. Temme. 2002. Long-term measurements of atmospheric mercury at Mace Head, Irish west coast, between 1995 and 2001. Atmos. Environ. 36:5267–76. doi:10.1016/S1352-2310(02)00691-X
- Ebinghaus, R., and F. Slemr. 2000. Aircraft measurements of atmospheric mercury over southern and eastern Germany. Atmos. Environ. 34:895–903. doi:10.1016/S1352-2310(99)00347-7
- Fang, F.M., Q.C. Wang, and J.F. Li. 2004. Urban environmental mercury in Changchun, a metropolitan city in northeastern China: Source, cycle, and fate. Sci. Total Environ. 330:159–70. doi:10.1016/j.scitotenv.2004.04.006
- Feng, X.B., L.H. Shang, S.F. Wang, S.L. Tang, and W. Zheng. 2004. Temporal variation of total gaseous mercury in the air of Guiyang, China. J. Geophys. Res. 109:D03303. doi:10.1029/2003JD004159
- Fitzgerald, W.F. 1995. Is mercury increasing in the atmosphere—The need for an atmospheric mercury network (AMNET). Water Air Soil Pollut. 80:245–54. doi:10.1007/BF01189674
- Fu, X.W., X.B. Feng, W.Z. Zhu, et al. 2008. Total gaseous mercury concentrations in ambient air in the eastern slope of Mt. Gongga, south-eastern fringe of the Tibetan plateau, China. Atmos. Environ. 42:970–79. doi:10.1016/j.atmosenv.2007.10.018
- Fu, X.W., X. Feng, Z.Q. Dong, et al. 2010. Atmospheric gaseous elemental mercury (GEM) concentrations and mercury depositions at a high-altitude mountain peak in south China. Atmos. Chem. Phys. 2010, 10:2425–37. doi:10.5194/acp-10-2425-2010
- Hall, B. 1995. The gaseous phase oxidation of elemental mercury by ozone. Water Air Soil Pollut. 80:301–15. doi:10.1007/BF01189680
- Holmes, C.D., D.J. Jacob, and X. Yang. 2006. Global lifetime of elemental mercury against oxidation by atomic bromine in the free troposphere. Geophys. Res. Lett. 33:L20808. doi:10.1029/2006GL027176
- Iverfeldt, A., J. Munthe, C. Brosset, and J. Pacyna. 1995. Long-term changes in concentration and deposition of atmospheric mercury over Scandinavia. Water Air Soil Pollut. 80:227–33. doi:10.1007/BF01189672
- Kim, K.H., and M.Y. Kim. 2001. The temporal distribution characteristics of total gaseous mercury at an urban monitoring site in Seoul during 1999–2000. Atmos. Environ. 35:4253–63. doi:10.1016/S1352-2310(01)00214-X
- Kim, S.H., Y.J. Han, T.M. Holsen, et al. 2009. Characteristics of atmospheric speciated mercury concentrations (TGM, Hg(II) and Hg(p)) in Seoul, Korea. Atmos. Environ. 43:3267–74. doi:10.1016/j.atmosenv.2009.02.038
- Kim, K.H., M.Y. Kim, J. Kim, et al. 2002. The concentrations and fluxes of total gaseous mercury in a western coastal area of Korea during late March 2001. Atmos. Environ. 36:3413–27. doi:10.1016/S1352-2310(02)00311-4
- Kellerhals, M., S. Beauchamp, W. Belzer, P. Blanchard, F. Froude, B. Harvey, K. McDonald, M. Pilote, L. Poissant, K. Puckett, B. Schroeder, A. Steffen, and R. Tordon. 2003. Temporal and spatial variability of total gaseous mercury in Canada: results from the Canadian Atmospheric Mercury Measurement Network (CAMNet). Atmos. Environ. 37:1003–11. doi:10.1016/S1352-2310(02)00917-2
- Kuo, T.H., C.F. Chang, A. Urba, et al. 2006. Atmospheric gaseous mercury in northern Taiwan. Sci. Total Environ. 368:10–18. doi:10.1016/j.scitotenv.2005.10.017
- Lee, D.S., G.J. Dollard, and S. Pepler. 1998. Gas-phase mercury in the atmosphere of the United Kingdom. Atmos. Environ. 32:855–64. doi:10.1016/S1352-2310(97)00316-6
- Lindberg, S., R. Bolluck, R. Ebinghaus, D. Engstrom, X. Feng, W. Fitzgerald, N. Pirrone, E. Prestbo, and C. Seigneur. 2007. A synthesis of progress and uncertainties in attributing the sources of mercury in deposition. Ambio 36:19–32. doi:10.1579/0044-7447(2007)36[19:ASOPAU]2.0.CO;2
- Lindqvist, O., and H. Rodhe. 1985. Atmospheric mercury—A review. Tellus 37B:136–59. doi:10.1111/j.1600-0889.1985.tb00062.x
- Lindqvist, O., K. Johansson, L. Bringmark, and M. Meili. 1991. Mercury in the Swedish environment – Recent research on causes, consequences and corrective methods. Water Air Soil Pollut. 55(1):1–261.
- Liu, S.L., F. Nadim, C. Perkins, R.J. Carley, G.E. Hoag, Y. Lin, and L. Chen. 2002. Atmospheric mercury monitoring survey in Beijing, China. Chemosphere 48:97–107. doi:10.1016/S0045-6535(02)00026-7
- Lynam, M., and G. Keeler. 2005. Automated speciated mercury measurements in Michigan. Environ. Sci. Technol. 39:9253–62. doi:10.1021/es040458r
- Nguyen, H.T., K.M. Kim, M.Y. Kim, et al. 2007. Monitoring of atmospheric mercury at a global atmospheric watch (GAW) site on An-Myun Island, Korea. Water Air Soil Pollut. 185:149–64. doi:10.1007/s11270-007-9438-5
- Pacyna, E.G., and J.M. Pacyna. 2002. Global emission of mercury from anthropogenic sources in 1995. Water Air Soil Pollut. 137:149–165. doi:10.1007/s11270-007-9438-5
- Pecheyran, C., B. Lalere, and O. Donard. 2000. Volatile metal and metalloid species (Pb, Hg, Se) in a European urban atmosphere (Bordeaux, France). Environ. Sci. Technol. 34:27–32. doi:10.1021/es980887n
- Poissant, L. 2000. Total gaseous mercury in Quebec (Canada) in 1998. Sci. Total Environ. 259:191–201. doi:10.1016/S0048-9697(00)00582-9
- Sakata, M., and K. Marumoto. 2002. Formation of atmospheric particulate mercury in the Tokyo metropolitan area. Atmos. Environ. 36:239–46. doi:10.1016/S1352-2310(01)00432-0
- Schroeder, W.H., and J. Munthe. 1998. Atmospheric mercury—An overview. Atmos. Environ. 32:809–22. doi:10.1016/S1352-2310(97)00293-8
- Temme, C., F. Slemr, R. Ebinghaus, and J.W. Einax. 2003. Distribution of mercury over the Atlantic Ocean in 1996 and 1999–2001. Atmos. Environ. 37:1889–97. doi:10.1016/S1352-2310(03)00069-4
- Wan, Q., X. Feng, W. Zhen. 2008. Seasonal characteristics of the atmospheric total gaseous mercury concentration of the Mt. Changbai. Environ. Sci. 29(2): 296–99.
- Wang, L., Q. Zhang, J. Hao, et al. 2005. CO anthropogenic emission inventory of Mainland China. Environ. Sci. 25:1580–85.
- Wang, Z.W., Z.S. Chen, N. Duan, et al. 2007. Gaseous elemental mercury concentration in atmosphere at urban and remote sites in China. J. Environ. Sci. 19:176–80. doi:10.1016/S1001-0742(07)60028-X
- Wu, Y., S.X. Wang, D.G. Streets, et al. 2006. Trends in anthropogenic mercury emissions in China from 1995 to 2003. Environ. Sci. Technol. 40:5312–18. doi:10.1021/es060406x
- Yang, Y.K., H. Chen, and D.Y. Wang. 2009. Spatial and temporal distribution of gaseous elemental mercury in Chongqing, China. Environ. Monit. Assess. 156:479–89. doi:10.1007/s10661-008-0499-8
- Zhang, Y., G. Xiu, D. Zhang, M. Zhang, and R. Zhang. 2010. Seasonal variation of total gaseous mercury and its relation to meteorological conditions in Shanghai ambient air. Environ. Sci. Technol. 35:155–158. (in Chinese)