
Abstract
Emissions of volatile organic compounds (VOCs) and hazardous air pollutants (HAPs) from oil and natural gas production were investigated using direct measurements of component-level emissions on pads in the Denver-Julesburg (DJ) Basin and remote measurements of production pad-level emissions in the Barnett, DJ, and Pinedale basins. Results from the 2011 DJ on-site study indicate that emissions from condensate storage tanks are highly variable and can be an important source of VOCs and HAPs, even when control measures are present. Comparison of the measured condensate tank emissions with potentially emitted concentrations modeled using E&P TANKS (American Petroleum Institute [API] Publication 4697) suggested that some of the tanks were likely effectively controlled (emissions less than 95% of potential), whereas others were not. Results also indicate that the use of a commercial high-volume sampler (HVS) without corresponding canister measurements may result in severe underestimates of emissions from condensate tanks. Instantaneous VOC and HAP emissions measured on-site on controlled systems in the DJ Basin were significantly higher than VOC and HAP emission results from the study conducted by Eastern Research Group (ERG) for the City of Fort Worth (2011) using the same method in the Barnett on pads with low or no condensate production. The measured VOC emissions were either lower or not significantly different from the results of studies of uncontrolled emissions from condensate tanks measured by routing all emissions through a single port monitored by a flow measurement device for 24 hr. VOC and HAP concentrations measured remotely using the U.S. Environmental Protection Agency (EPA) Other Test Method (OTM) 33A in the DJ Basin were not significantly different from the on-site measurements, although significant differences between basins were observed.
Implications: VOC and HAP emissions from upstream production operations are important due to their potential impact on regional ozone levels and proximate populations. This study provides information on the sources and variability of VOC and HAP emissions from production pads as well as a comparison between different measurement techniques and laboratory analysis protocols. On-site and remote measurements of VOC and HAP emissions from oil and gas production pads indicate that measurable emissions can occur despite the presence of control measures, often as a result of leaking thief hatch seals on condensate tanks. Furthermore, results from the remote measurement method OTM 33A indicate that it can be used effectively as an inspection technique for identifying oil and gas well pads with large fugitive emissions.
Introduction
With revolutionary advancements in oil and natural gas extraction capability comes enhanced responsibility to understand air pollutant emissions associated with this growing sector (U.S.Environmental Protection Agency [EPA], Citation2013c). Environmentally responsible development requires accurate knowledge of methane (CH4) emissions from all parts of the supply chain (Moore et al., Citation2014; Caulton et al., Citation2014; Howarth et al., Citation2011) as well as an understanding of overall air impacts from relatively short-lived well site creation, drilling, and completion, and the long-term production operations (Allen et al., Citation2013; EPA, Citation2007; McKenzie et al., Citation2012). To support low-environmental-impact ongoing field operations, an understanding of emissions and mitigation approaches for upstream oil and natural gas production sites (well pads) is required (EPA, Citation2013c). In addition to CH4, well pad emissions can include volatile organic compounds (VOCs), which may impact regional ozone levels (Rodriguez et al., Citation2009; Kemball-Cook et al., Citation2010; Schnell et al., Citation2009; Pétron et al., Citation2012), and hazardous air pollutants (HAPs) that could potentially create air quality concerns for near-site residents (Zielinska et al., Citation2014; Colorado Department of Public Health & Environment [CDPHE], Citation2007; Walther, Citation2011). Well pad emission profiles vary based on the geologically determined composition of the product, age of the well, production equipment design, and maintenance states of systems and emission control devices. Well pad emissions can be difficult to measure and model due to the large number of potential sources (vented and fugitive), including temporally variable emissions from condensate storage tanks with and without emission controls (Field et al., Citation2014; Brandt et al., Citation2014; Hendler et al., Citation2006; Gidney and Pena, Citation2009; Allen et al., Citation2013). Other common production pad components with associated combustion emissions such as separator burners, enclosed combustion devices (ECDs), and engines were not included in this work.
Compared with the growing information base on CH4 emissions from oil and natural gas, the topic of well pad VOC and HAP emissions inspection and measurement is underdeveloped. Knowledge of CH4 emissions has been driven by years of government and industry efforts (EPA, Citation2009, Citation2013b, Citation2010, Citation1993) and through a surge of recent research activity, in part enabled by the emergence of high-performance CH4 measurement systems (Wang et al., Citation2008; Crosson, Citation2008; Pétron et al., Citation2012). Although CH4 is ubiquitous in all phases of oil and natural gas production and distribution, product-related VOC and HAP emissions are confined primarily to upstream production activities and exhibit large basin-to-basin differences. These factors, combined with a lack of easily implemented field instruments to measure VOCs and HAPs, have made emissions data from well pads challenging to obtain. The intermittent nature of flash emissions, which occur when pressurized hydrocarbon liquids (oil or condensate) are transferred from a separator into a storage tank at atmospheric pressure, adds further complexity. Speciated emissions and control effectiveness are important emerging topics, especially in light of new regulations on condensate storage tank emissions designed to reduce ozone impacts (EPA, Citation2013a; CDPHE, Citation2008, Citation2014).
Development of cost-effective direct and remote measurement tools that can facilitate leak detection and repair, inform inventories, and support compliance activities is key to understanding well pad emissions. Manually executed well pad emission assessment techniques include optical gas imaging (OGI) devices that can efficiently detect the presence of hydrocarbon leaks (Carbon Limits, Citation2013; EPA, Citation2009), direct source measurements with high-volume samplers (HVSs), and bagging techniques to characterize and quantify component-level emissions (EPA, Citation2010). With supporting laboratory analysis, the latter can provide detailed speciated emission rate data but can be resource intensive and require special safety considerations. In the future, on-site (source) measurement approaches may be complemented with fence line sensor and remote mobile inspection techniques that provide higher levels of temporal and spatial coverage to help rapidly identify well pad malfunctions and gathering pipeline leaks (Brantley et al., Citation2014; Environmental Defense Fund [EDF], Citation2014; U.S. Department of Energy Advance Research Projects Agency—Energy [ARPA-E], Citation2014; EPA, Citation2014; Thoma et al., Citation2012; Eapi et al., Citation2014).
This paper compares VOC and HAP well-pad emission data from several studies that use different measurement approaches. New data from an EPA on-site study and a series of remote mobile surveys are compared with four previous on-site studies (). VOC and HAP well pad emissions are driven by hydrocarbon liquids (condensate or oil) production rates, basin profiles, and efficacy of pollution control strategies. Examples of well pad components used for pollution control are ECDs and vapor recovery units (VRUs).
Table 1. Comparison of field study attributes
The EPA study of well pad emissions in the Denver-Julesburg (DJ) Basin (Modrak et al., Citation2012) was similar in form to the City of Fort Worth Natural Gas Air Quality Study conducted by Eastern Research Group (ERG, Citation2011). Each study used OGI to locate emission points and HVSs to provide a rapidly executed measure of emissions. The studies differed in the canister analysis utilized and in the condensate production level and tank emission controls, with tank emissions from the ERG study ascribed primarily to produced water storage, emissions from which are not controlled but vented to the atmosphere. Only two of the sites in the ERG study utilized controls, whereas ECDs were present on all of the condensate tanks measured in the EPA on-site study.
Three other on-site studies conducted in Texas focused exclusively on well pad condensate tanks using a “seal and measure” approach where all potential emission points were routed through a single port monitored by a flow measurement device for extended time periods (Hendler et al., Citation2006; Gidney and Pena, Citation2009; ENVIRON, Citation2010). In these studies, the Gas Processors Association (GPA) method 2286-95 (GPA, Citation1999) was used to determine the composition of the vented gas. This somewhat invasive approach guarantees sampling of periodic flash emission events potentially missed by the short-duration, single-point HVS measurement. To further inform approach comparisons and source complexity, the on-site studies are compared with remote measurements of VOC and HAP well pad emissions acquired using a mobile inspection approach, EPA Other Test Method (OTM) 33A (EPA, Citation2014).
Methods
The EPA on-site study of 23 Weld County, Colorado, well pads in the DJ Basin was executed over a 1-week period in July 2011 by the same measurement team (Sage Environmental Consulting) using identical equipment and procedures similar to those detailed in the ERG study report (ERG, Citation2011; Modrak et al., Citation2012). Each pad in the EPA study contained on average 258 valves, 2583 connectors, three condensate tanks, a produced water tank, four thief hatches (one for each tank), five pressure relief devices, and three separators. All sites were fitted with one ECD as per current State of Colorado requirements. Four of the 23 sites were fitted with VRUs and one production pad contained a dehydration unit. Nineteen sites were fitted with single-stage separators, and four sites utilized two-stage separators and buffer tanks designed to reduce the pressure of the liquid sent to the condensate tanks (to reduce flash emissions). Field conditions in the EPA study were sunny to partly cloudy, with temperatures ranging from 73.3 to 101.0 °F (average 87.8 °F). Following daily instrument quality assurance checks, site photos and details of the well pad equipment and layout were recorded, and an OGI emission inspection survey was conducted using a model GasFinderIR (FLIR, Inc., Billerica, MA), with emission points video-documented. Based on the OGI survey, emission rate data were acquired using a HVS (Bacharach Hi Flow Sampler; Bacharach, Inc., New Kensington, PA) on all safely accessible emission points (Supplementary Material, Figure S1). For low emission rates where vapor concentrations were below the detection limit of the HVS, the concentration was determined with a Thermo Toxic Vapor Analyzer 1000B (Thermo Scientific, Franklin, MA).
From the largest emission point on each well pad, at least one sample was acquired at the exit of the HVS (N = 33 total) using a leak-free, subatmospheric 6-L stainless steel canister with a valve and passivated interior. The canister-derived concentration values were used with the measured HVS flow rates to calculate emission rates for individual and groups of compounds. Where canisters were not acquired, the default HVS-derived emission rate was utilized. One major difference between the ERG (ERG, Citation2011) and EPA on-site studies is that the ERG study used EPA method TO-15 (EPA, Citation1999) for source canister VOC and HAP analysis and gas chromatography with a thermal conductivity detector for CH4 analysis, whereas in the EPA on-site study the concentrations of total and speciated nonmethane volatile organic compounds were determined using gas chromatography with flame ionization detection (GC-FID) as described in EPA/600-R-98/161 (EPA, Citation1998) coupled with American Society for Testing and Materials (ASTM) 1946/D1945 (2010) analysis of CH4, ethane (C2H6), and propane (C3H8). EPA method TO-15 (EPA, Citation1999) is an ambient method, but was used by ERG for the source measurements in order to facilitate comparison with ambient measurements focusing on HAPs. The EPA on-site analysis set includes 57 compounds, 52 of which are VOCs, and has significantly more overlap with oil- and natural gas product–related compounds, compared with the TO-15 method, which provides more coverage of general HAPs. Twenty-three VOCs are included in both the EPA on-site and ERG (ERG, Citation2011) analysis sets, but, notably, propane is omitted from the latter.
Off-site, or remote, measurements of CH4 well pad emissions were collected using the EPA OTM 33A (EPA, Citation2014) mobile remote sensing approach during field campaigns in the Colorado DJ Basin, in July 2010 and 2011; Texas Barnett Shale, in September 2010 and 2011; and Wyoming Pinedale, which includes the Pinedale Anticline and Jonah fields, in June 2011, July 2012, and June 2013, and are detailed elsewhere (Brantley et al., Citation2014; EPA, Citation2014). For this approach, the sampling vehicle was positioned at a downwind observation location in the emission plume of the well pad using real-time CH4 data from the concentration measurement instrument (CMI), either a G1301-fc cavity ring-down spectrometer (Picarro, Inc., Santa Clara, CA) or a GG-24-r off-axis integrated cavity output spectrometer (Los Gatos Research Inc., Mountain View, CA). During the CMI measurement, the engine was turned off and a 20-min observation was executed. When elevated CH4 concentration levels were present, the operator triggered the acquisition of a nominal 30-sec duration evacuated canister sample, collocated with the CH4 CMI inlet (Supplemental Material, Figure S2). The 1.4-L canisters were analyzed using the same method employed in the EPA on-site study (EPA, Citation1998; ASTM, Citation2010). The canisters provide snapshot measures of CH4 and speciated VOC and HAP concentrations in the off-site plume representing distance-dispersed emissions from the well pad. The CH4 concentrations were compared with the CMI measurements for quality assurance purposes.
To determine individual compound emission estimates, the OTM 33A (EPA, Citation2014) point-source Gaussian (PSG) CH4 emission assessment from the 20-min observation is used in conjunction with the canister data in a ratio-based approach (eq 1).
where Fc is the emission estimate of canister compound (g/sec); Cc is the measured concentration of canister compound (ppb); Fo is PSG the emission rate estimate for CH4 (g/sec); Co is CH4 concentration in canister above background (ppb); Mc is the molecular weight of canister compound (g/mol); and Mo is the molecular weight of CH4 (g/mol).
The acceptance criteria for the canister-based emission estimates include the criteria described for the CH4 measurement (Brantley et al., Citation2014) with the additional criterion that canister-derived CH4 concentrations exceed 100 ppb above the background value determined by the PSG calculation to ensure robust plume sampling. No background correction was applied to the nonmethane compounds, leading to a slight positive bias in results. As with the on-site measurements, the compound set for the OTM 33A VOC emission assessments includes all C3+ species present above detection limit in the canister analysis (EPA, Citation1998; ASTM, Citation2010). Propane concentrations determined using the ASTM method were utilized in the analysis because of the increased accuracy over the GC-FID method (EPA, Citation1998). The term VOC used herein does not include CH4 or C2H6 (ethane) species.
The HAPs quantified using GC-FID as described in EPA/600-R-98/161 (EPA, Citation1998) include benzene, toluene, ethylbenzene, m-xylene, o-xylene, and p-xylene (BTEX) as well as n-hexane and 2,2,4-trimethylpentane. Pring (Citation2012) used the data collected by Hendler et al. (Citation2006) to develop BTEX emission factors for condensate tanks in Texas. BTEX emissions measured in both the on-site and OTM 33A measurements were compared with the emissions measured by Hendler et al. (Citation2006) and used by Pring (Citation2012) as well as those measured by ERG for the City of Fort Worth (2011).
Study results were compared by summing individual emission point measurements from the on-site studies by pad to represent total emissions from the well pad and then using geometric means because both HAP and VOC emissions were log normally distributed. Henceforth, mean will refer to geometric mean unless otherwise specified. The mean and 95% confidence intervals (CIs) of the log-transformed data were calculated using a nonparametric bootstrap (Wickham, Citation2009; Harrell and Dupont, Citation2007) and then transformed back into the original scale. The nonparametric bootstrap involved resampling with replacement 1000 times, the mean of each of the samples was taken and the 95% CIs were calculated from the resulting normally distributed means. The nonparametric bootstrap was chosen because it does not assume the underlying data comes from a normal distribution.
Information on condensate production was provided by the owners for 19 of the sites measured in the EPA on-site study. In addition, 14 of these sites had operator-provided high-pressure liquid sample analyses. For these sites, the E&P TANKS software version 2.0 (American Petroleum Institute, Washington, DC) was used to calculate the condensate tank potential to emit (PTE) under a variety of temperature and pressure conditions. The model inputs include the chemical composition of a liquid or gas sample, the American Petroleum Institute (API) gravity of the sales oil, ambient temperature and pressure, solar insolation, estimated annual production rate, and separator pressure and temperature. The model outputs include predicted uncontrolled emissions (PTE) of HAPs and of VOCs. Recent samples were collected at seven of the sites for extended natural gas liquid analysis, whereas analytical results from samples taken in 2009 or 2010 were available at the other seven sites. A range of ambient temperatures and pressures was used in the model representing the recorded ambient conditions when the emission measurements were made: 73.3 to 101 °F and 12.14 to 12.57 psia. The site operators provided separator pressures and temperatures, and condensate production rates.
Results and Discussion
Comparison of canister and HVS samples
In the EPA on-site study, a total of 106 emission points were observed with OGI and measured with the HVS and 33 evacuated canister samples were acquired and analyzed to establish the composition of the emitted vapor streams (Supplemental Material) and to compare with the HVS combustible concentration (% hydrocarbon [HC]) determination. In the DJ Basin, condensate tanks with six tons of emissions per year or greater are now required to be controlled to 95% either through flaring or vapor recovery pollution control practices (CDPHE, Citation2014). Emissions in excess of this rate can be referred to as fugitives or leaks. Thief hatches were one of the most frequently observed leak locations on condensate tanks, indicating that the systems may not have been optimally controlled. As in most locations, emissions from produced water storage tanks were uncontrolled (vented) at the time of the study. The canister samples were divided into five categories based on the location of the emission (). Condensate tank working and breathing emissions were separated from flash emissions initially, but because the compositions were not substantially different, the categories were combined. The sampling protocol called for a canister sample to be acquired at the highest emission point on the pad, which was condensate tank-related in most cases (n = 27). The compositions of the condensate tank leaks were fairly consistent, with an arithmetic mean molecular weight of 41.9 g/mol (). The emissions with the largest fraction of carbon in the form of CH4 were collected from a dehydrator, whereas the emissions with the greatest fraction of carbon in the form of VOCs and HAPs were acquired from a produced water tank.
Table 2. Arithmetic means, minimums, and maximums of molecular weight and percent of carbon in emissions in the form of CH4, VOCs, and HAPs from on-site canister samples by location
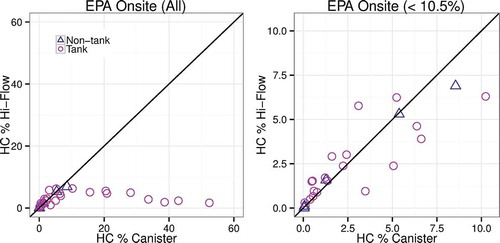
The HVS used in this study is designed for downstream natural gas leak measurements and has not been thoroughly evaluated for use in upstream well pad applications with mixed VOC and CH4 emission streams. The HVS calculates emission rate by multiplying instrument flow rate by the sensor-determined combustible concentration (% HC, calibrated as CH4). The HVS determinations of % HC in the emissions were compared with the concentrations measured in the canister samples for the EPA on-site study. For emissions with ≤10% HC, the HVS and canister measurements were correlated with a slope of 1.1 and a coefficient of determination (R2) of 0.87 (). However, for canister samples with summed HC concentrations >10%, the HVS sensor underreported % HC (). In these cases, the HVS pellistor sensor or the control system is believed to have malfunctioned by failing to switch from catalytic oxidation (low range) to thermal conductivity mode (high range), causing significant underestimation of combustible concentration and therefore emission rate (Modrak et al., Citation2012). The results shown here differ slightly from those in Modrak et al. (Citation2012) due to the correction of some data transcription errors. The changes did not affect the interpretation or implication of the results. This malfunction was detected only during large emissions from condensate tank thief hatches (VOC-rich stream) and may be partly due to an undetected range limitation of the instrument caused in part by limited airflow around the emission point (Supplemental Material, Figure S3). The four highest % HC measurements were acquired during condensate tank flashing, with the next four highest canister measurements exhibiting evidence of larger than typical breathing emissions (Supplemental Material). Further observations of this type of HVS malfunction resulting from the failure of the sensor to transition are described in Howard et al. (Citation2015).
Figure 1. Comparison of HVS measurements and canister measurements. The solid black line represents y = x. Circles represent measurements of tank emissions, whereas triangles represent nontank emissions.
In the EPA on-site study at six of the sites, two canister samples of a condensate tank emission point were collected. At four of the sites, one sample represented a flashing emission whereas the other represented breathing emissions (). While being observed, the condensate tank measured at site E flashed 10 times within 20 min, indicating that although the measurements were not recorded as occurring during a flashing event, they likely represent more than breathing emissions. Flash emissions were always higher than breathing emissions, with VOC emissions increasing by 0.1–2 g/sec (). Because of the lack of reliability in the HVS % HC measurements at elevated ranges, we were unable to obtain complete information on the duration of the flash emissions, although they were on the order of 30 sec to a couple minutes for the primary event. The temporal variability in emissions illustrates the need for cost-effective efficient measurement strategies for identifying significant leaks of an intermittent nature.
Table 3. Repeat measurements of condensate tank emissions
Comparison of condensate canister measurements with modeled emissions
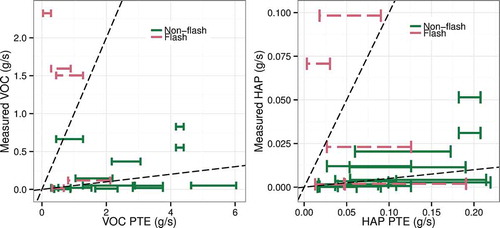
Condensate tank VOC and HAP emissions from the EPA on-site study were modeled using API E&P TANKS and compared with measurements (). The modeled PTE values represent the combined flashing, working, and breathing emissions expressed as an average sustained emission rate in (g/sec). For each point, the error bars represent the maximum and minimum modeled values resulting from the range of ambient temperatures and pressures observed during the study with annual average insolation. The upper dashed line represents an ordinate-to-the-abscissa 1:1 value, whereas the lower dashed line is 5% of this slope, representing a 95% emission control value. As expected, two of the measurements made during flashing events were larger than the range of modeled VOC emissions. Flashing events are typically short-lived and cannot be extrapolated to yearly estimates without knowledge of their duration and frequency. Seven of the samples were completely below the 5% line for VOCs PTE and below the 5% line for the upper estimates of HAPs PTE, indicating that the sustained tank breathing emissions during near peak emissions conditions (daytime, summer) appear to be effectively controlled. Six of the measured emissions represent levels greater than 5% of the modeled potential to emit values for both VOCs and HAPs, but this does not take into account diurnal or seasonal effects which should reduce breathing emissions during colder times of the year. Two of these samples were taken at site E and may likely represent more than breathing emissions due to the high frequency of separator dumps at the time of measurement. Remote inspection techniques such as OTM 33A could be used to identify cases where emissions are not being effectively controlled.
Figure 2. Comparison of VOC and HAP measurements with potential to emit values calculated using E&P TANKS version 2.0 (API Publication 4697) with a range of ambient temperatures (73.3–101 °F) and pressures (12.14–12.57 psia). Dashed lines represent y = x and y = 0.05x.
Comparison of on-site and remote methods
To determine total well pad VOC and HAP emissions for the EPA on-site study, the HVS measurements without canister samples were assigned the arithmetic mean molecular weight (MW), percent VOC, and percent HAP concentrations by location category (). Measurements of documented flash emissions in the EPA on-site study were not included in the site totals, because the duration and frequency were unknown. All of the emissions measured with the HVS were then summed by site and compared with measurements from the EPA OTM 33A study as well as previously published studies. A total of 133 canister samples out of 201 collected remotely using OTM 33A met data quality criteria and were spatially matched with active well pads (Brantley et al., Citation2014).
The geometric means and corresponding 95% CIs of the on-site measurements of VOC emissions rates by Hendler et al. (Citation2006), Gidney et al. (Citation2009), and ENVIRON (Citation2010) ranged from 0.32 (0.16, 0.62) g/sec to 2.94 (0.94, 9.85) g/sec (). The lowest mean emission rate of these three studies that utilized GPA method 2286-95 (1999) was observed by Hendler et al. (Citation2006) at pads in the Barnett Shale, which also reported the lowest average condensate production rates for the set (6.5 bbl/day). The highest mean VOC emission rates were observed by Gidney et al. (Citation2009) at sites in the Permian Basin with the largest average condensate production rates (510 bbl/day). However, mean VOC emissions measured by Gidney et al. (Citation2009) in the Anadarko Basin, 0.69 (0.22, 3.11) g/sec, were lower than those in the Barnett, 1.10 (0.70, 1.75) g/sec, despite the higher condensate production level, 72 and 22 bbl/day, respectively. This difference may be due to differences in condensate composition and engineering factors. The basin-level VOC emission factors used in the 2011 EPA National Emissions Inventory (EPA, Citation2011) were 3.15, 7.07, 9.76, 11, 13.7, and 19.6 lbs VOC/bbl of condensate in the Anadarko, Permian, Fort Worth (Barnett), Western Gulf, DJ, and Pinedale basins, respectively. This general correlation of emissions with emission factor and production rate is to be expected, since the studies used the single-vent 24-hr measurement approach, where all flash and other emissions are represented.
Figure 3. Comparison of VOC study results. Boxes represent the 1st and 3rd quartiles of the data, whereas whiskers extend to the largest measurement that is within 1.5 times the interquartile range. Geometric means are labeled and are shown in black along with 95% CIs and were calculated using a nonparametric bootstrap.
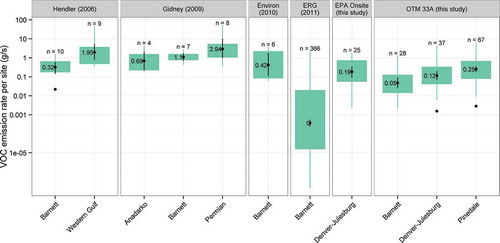
In comparison, the ERG on-site study (2011) using instantaneous HVS measurement in the Eastern Barnett has the lowest mean well pad VOC emission rate by a large margin <0.01 (0.00, 0.00) g/sec (). This result is in part due to extremely low condensate production at the sites measured, but also contributing to these low values is the choice of compounds (e.g., no propane) quantified in the canister sample analysis for VOC determination and short-term nature of the measurement. None of the ERG (Citation2011) sites with VOC emissions greater than 0.1 g/sec measured with a canister sample reported condensate production, although production rates were unavailable for 3 of the 11 sites and all of the measurements were taken at either tank vents or thief hatches. The HVS measurements may also have missed flashing events on the pad because of the short-term nature of the measurements.
At 0.19 (0.09, 0.36) g VOC/sec mean, the EPA on-site study was significantly higher than the ERG results (2011) and significantly lower than the results of Hendler et al. (Citation2006) in the Western Gulf, 1.95 (0.73, 5.23) g VOC/sec, and Gidney (Citation2009) in the Barnett Shale, 1.10 (0.70, 1.75) g VOC/sec, and Permian Basin, 2.94 (0.97, 10.38) g VOC/sec. Several competing factors complicate the comparison of VOC emissions measured in the EPA on-site study with the emissions measured in the other on-site studies, including differences in production levels, the presence of controls, basin emission factors, and measurement techniques. If the VOC emissions in the EPA on-site study were uncontrolled and routed through a single emission point, we would expect them to be higher than the emissions in the other basins due to the higher National Emissions Inventory (NEI) emission factor. However, because the EPA on-site measurements were component-level real-time measurements of controlled systems, we would expect them to be lower than the Hendler (Citation2006), Gidney (Citation2009), and Environ (Citation2010) studies.
The OTM 33A method is most applicable as an inspection technique because of its higher leak detection threshold, and ability to detect CH4 plumes from off-site (Brantley et al., Citation2014; EPA, Citation2014). As a result, the emission rates measured by OTM 33A tend to represent the upper end of the emissions distribution. Furthermore, the OTM 33A measurements do not include background value corrections and thus may exhibit a slight positive bias.
The mean emission rate measured using OTM 33A in the DJ Basin, 0.12 (0.06, 0.20) g VOC/sec, was not significantly different from the EPA on-site mean, 0.19 (0.09, 0.36) g VOC/sec, despite the lower average condensate production: 6.7 and 34.5 bbl/day, respectively. Calculating the potentially emitted VOCs using the NEI emission factor of 13.7 lbs VOC/bbl of condensate, pads that produced 34.5 and 6.7 bbl/day and consistently emitted 5% of their VOC PTE would result in constant emission rates of 0.12 and 0.02 g/sec, respectively. OTM 33A measurements in the DJ Basin generally focused on smaller pads, many of which had OGI-observed thief hatch seal leaks, and in some cases malfunctions (open thief hatches and failed pressure relief valves) so were nonoptimally controlled. The nominal 20-min OTM 33A measurements may have also included flash emissions events. All measurements in the Barnett Shale both by ERG and using OTM 33A were acquired primarily on lower condensate producing sites, with VOC emissions measured using OTM 33A found to be significantly higher, in part due to the differences in canister sample analysis methods between the studies. As was seen in the analysis of the CH4 OTM 33A measurements (Brantley et al., Citation2014), emissions located and measured using OTM 33A are not readily explained by production.
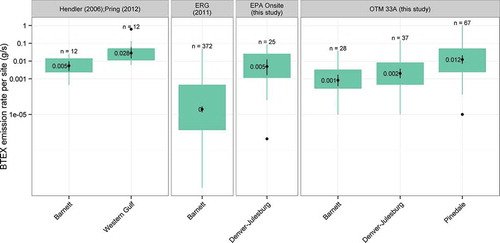
Trends in HAP emissions () were similar to the VOC emission trends. In both the on-site and OTM 33A EPA studies, the measured HAP emissions were significantly greater than those reported by ERG (Citation2011) but not significantly different from the uncontrolled emission measurements reported by Hendler (Citation2006) and Pring (Citation2012). HAP emissions measured using OTM 33A in Pinedale, 0.015 (0.007, 0.022) g BTEX/sec, were significantly higher than those measured in the DJ Basin, 0.002 (0.001, 0.004) g BTEX/sec, and the Barnett, 0.001 (0.000, 0.002) g BTEX/sec. The differences in mean basin HAP emissions measured using OTM 33A are more pronounced than the differences in mean VOC emissions, which is in part due to a higher number of nondetects in the measurements from the DJ Basin and Barnett Shale. Other contributing factors may include differences in condensate composition, produced water production levels, and handling procedures in the different regions. Produced water ponds have been found to be significant sources of HAPs (Thoma, Citation2009), and the canister sample with the highest percentage of carbon in the form of HAPs in the EPA on-site study was collected at a produced water tank ().
Figure 4. Comparison of HAPs study results. Boxes represent the 1st and 3rd quartiles of the data, whereas whiskers extend to the largest measurement that is within 1.5 times the interquartile range. Geometric means are labeled and are shown in black along with 95% CIs and were calculated using a nonparametric bootstrap.
Summary
Responsible oil and natural gas development requires an improved understanding of air emissions from production operations. Although a significant amount of research has recently been conducted to investigate CH4 emissions (Allen et al., Citation2013; Brantley et al., Citation2014; Brandt et al., Citation2014), VOC and HAP emissions from upstream production operations are also important due to their potential impact on regional ozone levels and proximate populations. This study provides important information on the sources and variability of VOC and HAP emissions from production pads as well as a comparison between different measurement techniques and laboratory analysis protocols. Our finding that the HVS can malfunction and underestimate emissions suggests that the instrument may not be suitable for general use in upstream applications, measuring tank emissions in particular, without canister measurement normalization. The similarity between the concentrations measured on-site and those measured remotely suggests that OTM 33A can be used effectively as an inspection technique for identifying oil and gas well pads with large fugitive emissions. The EPA on-site and OTM 33A studies in the DJ Basin conducted under peak summertime conditions, in the 2010–2011 time frame, indicate that significant VOC emissions from controlled systems can occur and are often a result of thief hatch leaks. Due to recent changes in state regulations, the current field conditions may differ from those presented here.
Acknowledgment
The authors would like to thank Bill Squier and Bill Mitchell for their great efforts in the development of the mobile measurement systems used in this work. Special thanks to Mark Modrak, Shahrooz Amin, and Frank Grainger with ARCADIS for their field and analysis support. Thanks to EPA colleagues Mike Miller, Jason DeWees, Robin Segall, and Ken Garing and his team for ongoing support in development of OTM 33 and 33A. Particular thanks to many individuals at Enthalpy Analytical and Sage Environmental Consulting for their work on these projects.
Funding
Primary funding for this effort was provided by U.S. Environmental Protection Agency Office of Research and Development’s Air, Climate, and Energy (ACE) and Regional Applied Research Effort (RARE) programs.
Disclaimer
The views expressed in this paper are those of the authors and do not necessarily represent the views or policies of the U.S. Environmental Protection Agency. Mention of trade names or commercial products does not constitute endorsement or recommendation for use.
Supplemental Material
Supplemental data for this paper can be accessed on the publisher’s website.
Supplemental Material
Download Zip (2.3 MB)Additional information
Funding
Notes on contributors
Halley L. Brantley
Halley Brantley is an Oak Ridge Institute of Science and Education (ORISE) fellow at the U.S. Environmental Protection Agency and a doctoral student in Statistics at North Carolina State University.
Eben D. Thoma
Eben D. Thoma and Adam P. Eisele are scientists at the U.S. Environmental Protection Agency.
Adam P. Eisele
Eben D. Thoma and Adam P. Eisele are scientists at the U.S. Environmental Protection Agency.
Related Research Data
References
- Allen, D.T., V.M. Torres, J. Thomas, D.W. Sullivan, M. Harrison, A. Hendler, S.C. Herndon, C.E. Kolb, M.P. Fraser, and A.D. Hill. 2013. Measurements of methane emissions at natural gas production sites in the United States. Proc. Natl. Acad. Sci. U. S. A. 110:17768–17773. doi:10.1073/pnas.1304880110
- American Society for Testing and Materials (ASTM). 2010. ASTM D1945-03. Standard Test Method for Analysis of Natural Gas by Gas Chromatography. West Conshohocken, PA: ASTM International. www.astm.org. doi:10.1520/D1945-03R10
- Brandt, A.R., G.A. Heath, E.A. Kort, F. O’Sullivan, G. Pétron, S.M. Jordaan, P. Tans, J. Wilcox, A.M. Gopstein, and D. Arent. 2014. Methane leaks from North American natural gas systems. Science 343:733–735. doi:10.1126/science.1247045
- Brantley, H.L., E.D. Thoma, W.C. Squier, B.B. Guven, and D. Lyon. 2014. Assessment of methane emissions from oil and gas production pads using mobile measurements. Environ. Sci. Technol. 48:14508–14515. doi:10.1021/es503070q
- Carbon Limits. 2013. Quantifying cost-effectiveness of systematic leak detection and repair programs using infrared cameras. Carbon Limits report CL-13-27. http://www.catf.us/resources/publications/files/CATF-Carbon_Limits_Leaks_Interim_Report.pdf (accessed November 26, 2014).
- Caulton, D.R., P.B. Shepson, R.L. Santoro, J.P. Sparks, R.W. Howarth, A.R. Ingraffea, M.O.L. Cambaliza, C. Sweeney, A. Karion, and K.J. Davis. 2014. Toward a better understanding and quantification of methane emissions from shale gas development. Proc. Natl. Acad. Sci. U. S. A. 111:6237–6242. doi:10.1073/pnas.1316546111
- Colorado Department of Public Health & Environment. 2007. Garfield County Air Toxics Inhalation: Screening Level Human Health Risk Assessment: Inhalation of Volatile organic Compounds Measured in Rural, Urban, and Oil & Gas Areas in Ambient Air Study (June 2005–May 2007). Denver, CO: Environmental Epidemiology Department, Colorado Department of Public Health & Environment. http://www.garfield-county.com/public-health/documents/Working%20Draft%20CDPHE%20Screeing%20Level%20Risk%20Air%20Toxics%20Assessment%2012%2020%2007.pdf (accessed November 26, 2014).
- Colorado Department of Public Health & Environment. 2008. Denver Metro Area & North Front Range Ozone Action Plan Including Revisions to the State Implementation Plan. Denver, CO: Colorado Department of Public Health & Environment Air Quality Control Commission. https://www.colorado.gov/pacific/sites/default/files/AP_PO_Denver-Ozone-Action-Plan-2008.pdf (accessed November 26, 2014).
- Colorado Department of Public Health & Environment. 2014. 5 CCR 1001-9: Control of Ozone via Ozone Precursors and Control of Hydrocarbons via Oil and Gas Emissions (Emissions of Volatile Organic Compounds and Nitrogen Oxides). Denver, CO: Colorado Department of Public Health Air Quality Control Commission. http://www.colorado.gov/cs/Satellite?blobcol=urldata&blobheadername1=Content-Disposition&blobheadername2=Content-Type&blobheadervalue1=inline%3B+filename%3D%22Regulation+7+-+Control+of+Ozone+via+Ozone+Precursors+and+Control+of+Hydrocarbons+via+Oil+and+Gas+Emissions+%28Emissions+of+Volatile+Organic+Compounds+and+Nitrogen+Oxides%29.pdf%22&blobheadervalue2=application%2Fpdf&blobkey=id&blobtable=MungoBlobs&blobwhere=1251950633132&ssbinary=true (accessed November 26, 2014).
- Crosson, E.R. 2008. A cavity ring-down analyzer for measuring atmospheric levels of methane, carbon dioxide, and water vapor. Appl. Phys. B 92:403–408. doi:10.1007/s00340-008-3135-y
- Eapi, G.R., M.S. Sabnis, and M.L. Sattler. 2014. Mobile measurement of methane and hydrogen sulfide at natural gas production site fence lines in the Texas Barnett Shale. J. Air Waste Manage. Assoc. 64:927–944. doi:10.1080/10962247.2014.907098
- Eastern Research Group. 2011. City of Fort Worth Natural Gas Air Quality Study Final Report. http://fortworthtexas.gov/uploadedFiles/Gas_Wells/AirQualityStudy_final.pdf (accessed December 1, 2014).
- ENVIRON. 2010. Upstream Oil and Gas Tank Emission Measurements. TCEQ Project 2010-39. https://www.tceq.texas.gov/assets/public/implementation/air/am/contracts/reports/ei/5820784004FY1025-20100830-environ-Oil_Gas_Tank_Emission_Measurements.pdf (accessed November 26, 2014).
- Environmental Defense Fund. 2014. Methane detectors challenge: Catalyzing next generation air emissions monitors. http://www.edf.org/energy/natural-gas-policy/methane-detectors-challenge (accessed August 8, 2014).
- Field, R.A., J.J. Soltis, and S. Murphy. 2014. Air quality concerns of unconventional oil and natural gas production. Environ. Sci. Process. Impact. 16:954–969. doi:10.1039/C4EM00081A
- Gas Processors Association. 1999. GPA Standard 2286-95: Tentative Method of Extendend Analysis for Natural Gas and Similar Gaseous Mixtures by Temperature Programmed Gas Chromatography. Vol. adopted as a tentative standard 1986, reprinted 1989, 1991, 1995, revised 1995, reprinted 1997, 1998, 1999. Tulsa, OK: Gas Processors Association.
- Gidney, B., and S. Pena. 2009. Upstream Oil and Gas Storage Tank Project Flash Emissions Models Evaluation Final Report. Austin, TX: Texas Commission on Environmental Quality. http://www.bdlaw.com/assets/htmldocuments/TCEQ%20Final%20Report%20Oil%20Gas%20Storage%20Tank%20Project.pdf (accessed December 1, 2014).
- Harrell, F.E., Jr., and C. Dupont. 2007. Hmisc R package, version 3.14–1. http://CRAN.R-project.org/package=Hmisc (accessed June 29, 2015).
- Hendler, A., J. Nunn, J. Lundeen, and R. McKaskle. 2006. VOC Emissions from Oil and Condensate Storage Tanks. Austin, TX: Houston Advanced Research Center. http://www.bdlaw.com/assets/htmldocuments/TCEQ%20Final%20Report%20Oil%20Gas%20Storage%20Tank%20Project.pdf (accessed November 26, 2014).
- Howard, T., F. Thomas, and A. Townsend-Small. 2015. Sensor transition failure in the high volume sampler: Implications for methane emission inventories of natural gas infrastructure. J. Waste Manage. Assoc. 65:856–862. doi:10.1080/10962247.2015.1025925
- Howarth, R.W., R. Santoro, and A. Ingraffea. 2011. Methane and the greenhouse-gas footprint of natural gas from shale formations. Climatic Change 106:679–690. doi:10.1007/s10584-011-0061-5
- Kemball-Cook, S., A. Bar-Ilan, J. Grant, L. Parker, J. Jung, W. Santamaria, J. Mathews, and G. Yarwood. 2010. Ozone impacts of natural gas development in the Haynesville Shale. Environ. Sci. Technol. 44:9357–9363. doi:10.1021/es1021137
- McKenzie, L.M., R.Z. Witter, L.S. Newman, and J.L. Adgate. 2012. Human health risk assessment of air emissions from development of unconventional natural gas resources. Sci. Total Environ. 424:79–87. doi:10.1016/j.scitotenv.2012.02.018
- Modrak, M.T., M. Amin, J. Ibanez, C. Lehmann, B. Harris, D. Ranum, E.D. Thoma, and B.C. Squier. 2012. Understanding direct emission measurement approaches for upstream oil and gas production operations, control # 2012-A-411-AWMA. In Proceedings of the 105th Annual Conference of the Air & Waste Management Association, San Antonio, Texas, June 19–22, 2012. San Antonio, TX: Air & Waste Management Association.
- Moore, C.W., B. Zielinska, G. Petron, and R.B. Jackson. 2014. Air impacts of increased natural gas acquisition, processing, and use: A critical review. Environ. Sci. Technol. 48:8349–8359. doi:10.1021/es4053472
- Pétron, G., G. Frost, B.R. Miller, A.I. Hirsch, S.A. Montzka, A. Karion, M. Trainer, C. Sweeney, A.E. Andrews, and L. Miller. 2012. Hydrocarbon emissions characterization in the Colorado Front Range: A pilot study. J. Geophys. Res. Atmos. 117(D4):D04304. doi:10.1029/2011JD016360
- Pring, M. 2012. Condensate Tank Oil and Gas Activities. Prepared for Texas Commission on Environmental Quality by Eastern Research Group. https://www.tceq.texas.gov/assets/public/implementation/air/am/contracts/reports/ei/5821199776FY1211-20121031-ergi-condensate_tank.pdf (accessed December 1, 2014).
- Rodriguez, M.A., M.G. Barna, and T. Moore. 2009. Regional impacts of oil and gas development on ozone formation in the western United States. J. Air Waste Manage. Assoc. 59:1111–1118. doi:10.3155/1047-3289.59.9.1111
- Schnell, R.C., S.J. Oltmans, R.R. Neely, M.S. Endres, J.V. Molenar, and A.B. White. 2009. Rapid photochemical production of ozone at high concentrations in a rural site during winter. Nat. Geosci. 2:120–122. doi:10.1038/ngeo415
- Thoma, E.D. 2009. Measurement of Emissions from Produced Water Ponds: Upstream Oil and Gas Study #1. EPA/600/R-09/132. Washington, DC: U.S. Environmental Protection Agency. http://nepis.epa.gov/Adobe/PDF/P100EACG.pdf (accessed December 1, 2014).
- Thoma, E.D., B.C. Squier, D. Olson, A.P. Eisele, J.M. DeWees, R.R. Segall, M.S. Amin, and M. Modrak. 2012. Assessment of methane and VOC emissions from select upstream oil and gas production operations using remote measurements, interim report on recent survey studies. In Proceedings of the 105th Annual Conference of the Air & Waste Management Association, Control No. 2012-A-21-AWMA. San Antonio, TX: Air & Waste Management Association.
- U.S. Department of Energy Advance Research Projects Agency—Energy (ARPA-E). 2014. Funding Opportunity No. DE-FOA-0001128: Methane Observation Networks with Innovative Technology to Obtain Reductions (Monitor). https://arpa-e-foa.energy.gov/ (accessed November 26, 2014).
- U.S. Environmental Protection Agency. 1993. Natural Gas STAR Program. http://www.epa.gov/gasstar/ (accessed November 26, 2014).
- U.S. Environmental Protection Agency. 1998. Technical Assistance Document for Sampling and Analysis of Ozone Precursors. http://www.epa.gov/ttnamti1/files/ambient/pams/newtad.pdf (accessed November 26, 2014).
- U.S. Environmental Protection Agency. 1999. Compendium of Methods for the Determination of Toxic Organic Compounds in Ambient Air, Second Edition, Compendium Method TO-15, Determination of Volatile Organic Compounds (VOCs) in Air Collected in Specially-Prepared Canisters and Analyzed by Gas Chromatography/Mass Spectrometry (GC/MS). EPA/625/R-96/10b. Washington, DC: U.S. Environmental Protection Agency http://www.epa.gov/ttnamti1/files/ambient/airtox/to-15r.pdf (accessed November 26, 2014).
- U.S. Environmental Protection Agency. 2007. Reducing methane emissions during completion operations. Natural Gas STAR Producer’s Technology Transfer Workshop. http://epa.gov/gasstar/documents/workshops/glenwood-2007/04_recs.pdf (accessed December 1, 2014).
- U.S. Environmental Protection Agency. 2009. 40 CFR Part 98 Subpart W—Petroleum and Natural Gas Systems. http://www.ecfr.gov/cgi-bin/text-idx?SID=457c8f4a0a7d738d2c3b1ef275e75e2c&node=sp40.21.98.w&rgn=div6 (accessed December 1, 2014).
- U.S. Environmental Protection Agency. 2010. Greenhouse Gas Emissions Reporting from the Petroleum and Natural Gas Industry, Background Technical Supporting Document, supporting 40 CFR Part 98.230. 77 FR 11039 Subpart W—Petroleum and Natural Gas Systems. http://www.epa.gov/ghgreporting/documents/pdf/2010/Subpart-W_TSD.pdf (accessed December 1, 2014).
- U.S. Environmental Protection Agency. 2011. National Emissions Inventory Oil and Gas Emissions Estimation Tool. ftp://ftp.epa.gov/EmisInventory/2011nei/doc/EPA_Oil_and_Gas_Production_Emission_Estimation_Tool_2011_NEI_V1_4_20130919. zip (accessed December 1, 2014).
- U.S. Environmental Protection Agency. 2013a. 40 CFR Part 60, supart OOOO Oil and Natural Gas Sector: Reconsideration of Certain Provisions of New Source Performance Standards. http://www.gpo.gov/fdsys/pkg/FR-2013-09-23/pdf/2013-22010.pdf ( accessed December 1, 2014).
- U.S. Environmental Protection Agency. 2013b. Inventory of U.S. Greenhouse Gas Emissions and Sinks: 1990–2011. http://www.epa.gov/climatechange/Downloads/ghgemissions/US-GHG-Inventory-2013-Main-Text.pdf (accessed December 1, 2014).
- U.S. Environmental Protection Agency. 2013c. EPA Needs to Improve Air Emissions Data for the Oil and Natural Gas Production Sector. Report No. 13-P-0161. Washington, DC: U.S. Environmental Protection Agency Office of Inspector General. http://www.epa.gov/oig/reports/2013/20130220-13-P-0161.pdf (accessed December 1, 2014).
- U.S. Environmental Protection Agency. 2014. DRAFT “Other Test Method” OTM 33A (Ver. 1.2): Geospatial Measurement of Air Pollution-Remote Emissions Quantification—Direct Assessment (GMAP-REQ-DA). http://www.epa.gov/ttn/emc/prelim.html ( accessed Decemeber 1, 2014).
- Walther, E. 2011. Screening Health Risk Assessment Sublette County, Wyoming. Sacramento, CA: Sierra Research Inc. http://www.sublettewyo.com/DocumentCenter/Home/View/438 (accessed December 1, 2014).
- Wang, C., N. Srivastava, B.A. Jones, and R.B. Reese. 2008. A novel multiple species ringdown spectrometer for in situ measurements of methane, carbon dioxide, and carbon isotope. Appl. Phys. B 92:259–270. doi:10.1007/s00340-008-3077-4
- Wickham, H. 2009. ggplot2: Elegant Graphics for Data Analysis. New York: Springer.
- Zielinska, B., D. Campbell, and V. Samburova. 2014. Impact of emissions from natural gas production facilities on ambient air quality in the Barnett Shale area: A pilot study J. Air Waste Manage. Assoc. 64:1369–1383. doi:10.1080/10962247.2014.954735