
Abstract
A process for filtering an aerosol of ultrafine metallic particles (UFP) has been designed and tested, based on the principle of a multistage granular bed. The filtration system comprised a succession of granular beds of varying thickness composed of glass beads of different diameters. This system allows the pressure drop to be regenerated during filtration (“on-line” mode) using a vibrating probe. Tests monitoring the pressure drop were conducted on a “10-L/min” low airflow rate device and on a “100-m3/hr” prototype. Granular bed unclogging is automated on the latter. The cyclic operation and filtration performances are similar to that of filter medium-based industrial dust collectors.
Implications: Filtration of ultrafine metallic particles generated by different industrial processes such as arc welding, metal cutting, or spraying constitutes a difficult problem due to the high filter clogging properties of these particles and to the high temperatures generally encountered. Granular beds represent an advantageous means of filtering these aerosols with difficult properties.
Introduction
Many industrial processes are likely to generate ultrafine particles (UFP: size < 100 nm), which may be encountered in airborne particles form in workplaces where operations involving welding, metal thermal cutting, thermal spraying, or a combustion phenomenon, among others, are performed (Witschger, Citation2007; Lehnert, Citation2012). The granular bed represents an advantageous means of filtering aerosols with difficult properties that are produced in these industrial environments: ultrafine particles, high concentrations and temperatures (Xiao, Citation2013), chemically reactive particles, and so on. Multiple techniques can be implemented for separating such aerosols, including filtration by fibrous media, electrofiltration, wet scrubbers, and others (Peukert, Citation2001). Compared with these techniques, granular beds offer certain advantages, such as their low cost, robustness, ease of manufacturing, suitability for encountered situations, easy elimination of contaminated granules, and resulting regeneration potential for new usage. On the other hand, they have the disadvantage of low initial collection efficiency (clean granule) in the “most penetrating particle size (MPPS)” range, between 0.1 and 0.5 µm (Ozis, Citation2004). Low MPPS collection efficiency can be partially overcome by involving electrostatic (Shapiro, Citation1986; Gutfinger, Citation1979) or acoustic (Moldavsky, Citation2013) forces. However, their collection efficiency is above all improved during filtration by particle accumulation within the bed (Kuo, Citation2010). This self-filtering phenomenon is well known and used in filtration using media filters to increase filter efficiencies (Japuntich, Citation1994; Walsh, Citation1996). Gutfinger has proposed a model of this phenomenon for granular beds (Gutfinger, Citation1988). Nevertheless, filtration efficiency improvement by this self-filtering mechanism has its limits: Beyond a certain pressure drop, the filtration cake is likely to fracture locally, thereby creating preferential paths of the air, degrading the filtration efficiency (Rodon, Citation2005). Once the layer is clogging, a regeneration operation must be therefore performed to recover the initial pressure drop. Moving granular beds embody this type of solution (El-Hedock, Citation2011), as do static beds in which the pressure drop is regenerated by injecting a compressed-air reverse pulse (Lee, Citation2005). However, these systems have been designed for filtering particle sizes greater than 10 µm at high filtration velocities. But, as UFP filtration by a granular bed is essentially controlled by the Brownian diffusion mechanism, low filtration velocities are required (~10 cm/sec) (Boulaud, Citation1991). The fact that particle accumulation occurs mainly at the interfacial region air/granules (El-Hedock, Citation2011), that is, where the airflow enters the granular bed, has led us to work with a granular bed composed of several stages. The first stage is used to collect the major part of the sampled aerosol. The pressure drop regeneration is then easier to perform than on a nonstaged setup.
The proposed study details the possibilities offered by a multistage granular bed, unclogged using a vibrating probe inserted inside the bed without stopping filtration (“on-line” mode), designed and tested in relation to filtering ultrafine metallic particles.
Methodology
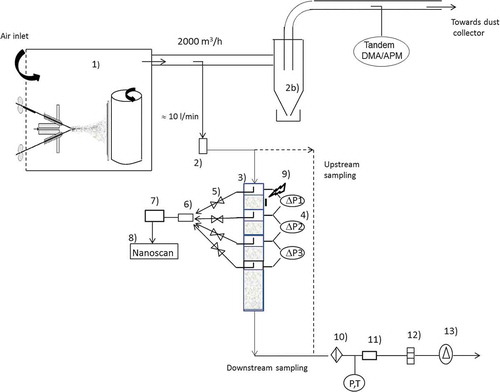
Two testing systems were implemented for studying ultrafine metallic particle filtration on a granular bed: A “10-L/min” column and a larger size “100-m3/hr” pilot system. Tests were conducted in a test bench where a UFP-concentrated aerosol is generated by thermal spraying of metal using an electric arc gun (Margarido M25). A Zn/Al (85/15%) alloy wire was fed into the electric arc gun. The metallic UFP were collected and directed toward the test bench (). The cyclone eliminates the fraction of particles greater than 1 µm in order to only retain the ultrafine fraction of the aerosol (Bémer and Régnier, Citation2013). The air temperature inside the test bench during a thermal spraying operation is 27 ± 3°C and the pressure is equal to atmospheric pressure.
Figure 1. Laboratory setup for tests on “10-L/min” column: (1) collection of fumes generated by electric arc metal spraying, (2) cyclone 10 L/min, (2b) cyclone 2000 m3/hr, (3) granular bed, (4) differential pressure measurement, (5) manual ball valves, (6) airflow splitter, (7) aerosol diluter, (8) Nanoscan analyzer, (9) vibrating system (stage 1), (10) sampling filter, (11) mass flowmeter, (12) sonic nozzle, (13) vacuum pump.
“10-L/min” column
The 10-L/min (40 mm internal diameter) column comprised three 11-mm-thick stages and a 105-mm-thick final stage vertically positioned. Glass beads with mean diameter = 0.695 mm were used to form the granular medium. Stages 11 mm thick were filled with 21 g of glass beads and the stage 105 mm thick with 200 g. Glass bead packing fraction (αg), after compaction by vibrations, was 61.5%. Each layer of beads rested on a metal grid (0.7 mm mesh size). Static pressure sensors were mounted upstream and downstream of each stage, enabling the differential pressure (ΔP) across each layer to be recorded.
Empty stages, on which a small elbowed probe (2 mm internal diameter) was mounted, were incorporated between the granular stages to allow aerosol sampling. The 105-mm-thick final stage was filled or not filled, depending on the tested configuration. The aerosol particle size distribution at the four levels studied (upstream of the column and downstream of the three stages) was measured using a Nanoscan (3910, TSI) analyzer after a sample dilution by 100 (VKL100, Palas). This analyzer has 13 channels distributed from 10 nm to 420 nm and an air sampling flow rate of 0.75 L/min. The particle size distribution is established in 1 min. The aerosol particle size distribution was measured sequentially on the four sampling lines (3 × 1 min analysis per line) by acting on the four manual ball valves. The diluter sampling flow rate (0.3 L/min) was insignificant with respect to the airflow rate in the column. This airflow rate leads to a sampling air velocity inside the 2-mm inner diameter probe of 1.6 m/sec, greater than the air velocity inside the column (0.13 m/sec). But this superisokinetic flow condition has no effect on the sampling efficiency, considering the ultrafine size of the particles. Similarly, the particle transport inside the different sampling probes is not influenced by UFP sedimentation.
Particles sampled on the test bench () were passed through a sharp cut cyclone (BGI SCC 1.829) to remove the mode >1 µm. Thus, only the UFPs forming the metal fumes were directed toward the granular bed. These particles have a mass median aerodynamic diameter of 115 nm (σg = 2.1) and a mass concentration of 90 ± 5 mg/m3, for a number concentration of 7 × 10⁸ /cm3.
The airflow rate through the column was set by a sonic nozzle and was continuously measured by a mass flowmeter (TSI 4100). The pressure and temperature upstream of the mass flowmeter was also monitored (setup shown in ). The “10-L/min” column was operating at a static pressure lower than the atmospheric pressure. A sampling filter was mounted downstream of the column throughout the experiment to determine the mass of particles leaving the column. Glass-fiber filters (Whatman GFC 47 mm) mounted in a stainless-steel filter holder were used. The collected particle mass was measured by weighing the filter (Mettler Toledo AT21 balance). The column was bypassed at the end of the test to allow measurement of the upstream concentration.
Two series of experiments were performed:
Study of stages clogging by monitoring the variation in pressure drop,
Study of pressure drop regeneration.
Study of clogging—Mass balance
In this case the test column was only composed of three 11-mm stages, with the 105-mm stage remaining empty. The airflow rate Q was set to 11.6 ± 0.3 L/min, leading to an air filtration velocity of 15.4 cm/sec.
The mass of particles entering (mexp,1) and leaving (mexp,4) the column during the experiment was obtained from the particle mass flow rates, which were determined from the upstream/downstream mass concentrations measured by filter sampling and from the air volume flow rate.
The Nanoscan analyzer was used to determine the aerosol collection efficiency of the three column stages. To do this, the metal particle mass concentrations upstream and downstream of the three column stages (i = 1 to 4, with Cm1 designating the concentration upstream of stage 1 and Cm4 designating the concentration at the column outlet) were calculated from the following relation:
in which ρp is the density of the Zn/Al (85/15%) alloy = 5.74 g cm−3, dvj is the volume equivalent diameter of particles in class j of the Nanoscan analyzer (j = 1 to 13), and Cni,j is the measured number concentration.
Diameter dv was determined from the electric mobility diameter (dm) measured by the Nanoscan analyzer and the mean apparent density of the metal particles (ρe) (DeCarlo, Citation2004):
The particle apparent density ρe was determined using a differential mobility analyzer (DMA; 3080, TSI) and an aerosol particle mass analyzer (APM; 3601 Kanomax) mounted in series (Charvet, Citation2014). The aerosol analyzed by the tandem DMA/APM was sampled downstream of the cyclone (). The mean density ρe derived from the aerosol number distribution was ρe = 0.96 g/cm3.
The resulting mass concentrations (eq 1) enabled us to calculate the particle collection efficiencies (in mass) associated with each stage (i = 1 to 3):
The particle mass collected by each stage i is then given by
where mi is the particle mass entering stage i during the experiment of duration t. This is given by the following relations:
in which m1 = mexp,1 is the mass obtained by filter sampling and gravimetric analysis.
The total efficiency of the three stages is given by
The experiment consisted of three clogging phases of about 30 min. The third phase was shortened (13.8 min) due to the too high stage 1 pressure drop reached (>2500 Pa). After each clogging phase the sampling filters were recovered to determine the masses mexp,1 and mexp,4.
Study of pressure drop regeneration
In this case, the test column was composed of three 11-mm stages and the final 10.5-cm stage. The airflow rate was set to 6.1 ± 0.2 L/min, leading to an air filtration velocity of 8.1 cm/sec. No measurements were taken with the Nanoscan analyzer during these “long-term” tests. Only the samples on the upstream and downstream filters were kept in order to monitor the overall mass efficiency variation of the column.
Stage 1 was unclogged by applying a vibrating probe to the stage 1 external wall (1-sec impulse at 50 Hz) as soon as the pressure drop had reached a predefined limit value of 1000 Pa. The head of a small electric engraver (Brennenstuhl) was modified to be able to applied it on the wall of stage 1. At the end of the test, the particle mass collected at each stage was measured by Zn dosing.
Zn determination
Zn determination was performed on (i) the glass beads and (ii) stage internal walls. Zn solubilization of these two substrates was separately carried out as follows:
Zn analysis in beads: Sample treatment consists of a leaching procedure of each stage. Beads were recovered and placed in 20 mL of 35% HNO3 solution at ambient temperature, placed in an ultrasonic bath, and shaked for 24 hr. Supernatants were then collected prior to analysis. Three blanks were made using 21 g of new beads by following the same treatment.
Zn analysis of the stage internal walls: The internal walls of each stage were rinsed using a total volume of 50 mL ultrapure water. Then there were wiped with a filter (AAWP 0.8 µm, Millipore), which was then placed in 5 mL of 69% HNO3 solution and ultrasound treated for 1 min, at room temperature, for complete dissolution. This solution was transferred to the 50 mL of rinsing solution for a final volume of 55 mL.
Zn analyses were conducted using inductively coupled plasma optical emission spectrometry (Varian 720 ES) under matrix matching conditions.
“100 m3/hr” pilot system
In order to study the ability of a granular bed to collect UFP at a greater air flow rate, a larger system, based on the previous tested configuration, was designed using the pressure drop model of Kozeny and Carman (Puncochar, Citation1990). It consists of one or two 5-cm-thick stages followed by a 20-cm-thick final stage (300 mm diameter). The 5-cm-thick stages were filled with glass beads of = 0.7 mm, and the 20-cm stage with beads of
= 1.5 mm. Each layer of beads is supported by a metallic grid (0.7 mm mesh size). With this configuration it is expected that the major part of the aerosol will be collected inside the 5-cm/0.7-mm stages. The last 20-cm/1.5-mm stage acts as a barrier against particles that could be released by the previous stages during the unclogging phases. Beads of greater size were used to limit the initial pressure drop of the granular layer. Two configurations were tested: Configuration 1 consists of one 5-cm-thick (
= 0.7 mm) stage + one 20-cm-thick (
= 1.5 mm) stage, and configuration 2 is made of two 5-cm-thick (
= 0.7 mm) stages (20-cm-thick stage is empty).
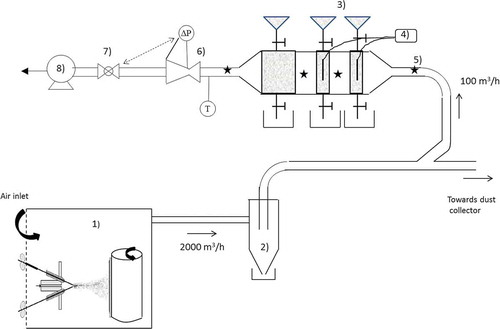
Static pressure inlets and aerosol sampling probes were arranged at the different filter stages. The unit was horizontally positioned (). The vertical or horizontal column configuration is of no great importance, due to the absence of UFP sedimentation. A solenoid valve allowed the flow rate to be maintained at a constant value, which was measured using a Venturi flowmeter (maximum/minimum diameters, 80/32 mm). The air was sampled on the test bench downstream of the cyclone, with the aim again being to exclude the metal particles greater than 1 µm generated by the thermal spraying process. As with the “10-L/min” column, the “100-m3/hr” granular bed is operating at a pressure lower than the atmospheric pressure.
Figure 2. Laboratory setup for “100 m3/hr” pilot granular filtration system tests: (1) metallic fumes generator, (2) cyclone, (3) feed hopper (new beads), (4) vibrating probes, (5) upstream/downstream sampling points, (6) airflow meter, (7) pneumatic valve, (8) vacuum pump.
A mechanical vibration-based unclogging system (electric vibrator, Enarco) was fitted to the 5-cm stages. A vibrating probe (25 cm long, 2.5 cm diameter) was inserted inside the bed and the duration of the vibrating pulse was fixed at about 2 sec with a frequency of 50–60 Hz. Unclogging was initiated when the pressure drop in the relevant stage reached a predefined limit value of about 13,000 Pa. The granular bed in the considered stage can be replaced by a new bed, when it reaches a state of irreversible clogging. For this purpose, each stage was fitted with a new bead feed hopper and a contaminated bead recovery bin. Stage emptying and filling with new beads were ensured by opening and closing two solenoid valves. The contaminated bed was simply discharged under gravity. A bead level monitoring device ensured the optimum stage filling with clean beads.
The differential pressure at the different stage terminals was continuously measured along with the air flow rate. An electrical low pressure impactor (ELPI; Dekati) was used to determine the particle size distributions upstream and downstream the different stages. The upstream mass concentration was measured by filter sampling (Whatman GFC 47 mm) and gravimetric analysis.
Results
“10 L/min” column—Study of clogging
provides an example of the number distributions measured at the different 11-mm stages of the column used to establish the particle mass balance and the calculation of particle masses, m and mc.
Figure 3. Number particle size distributions of metallic particles determined using a Nanoscan analyzer at different stages of the “10-L/min” column, with mean values for last 7 min of phase 2 clogging.
shows the particle masses determined during the three experimental clogging phases and the total filtration efficiency E.
As we can see, the difference between the calculated mass leaving the column and the measured mass (mexp,4) is small (the calculated mass is slightly underestimated, except at phase 3), which effectively validates the method based on measuring collection efficiencies Ei (eq 3). Some data from are reported on the graph (). The variation over time of masses mc1, mc2, mc3, and mexp,4 is clearly shown and especially the stage 1 clogging, which, as we can see, rapidly controls the pressure drop and efficiency of the whole system.
Table 1. Particle masses established during the three clogging phases
Figure 4. Particle mass distribution within the different stages of “10-L/min” column (stages 1 to 3, 4: column outlet). Clogging, phase 1 (◊), phase 2 (Ο), phase 3 (□).
shows the variation in pressure drop for the three stages during clogging. Phase 3 is not reported, since the stage 1 differential pressure sensor was saturated (ΔP > 2500 Pa). The stage 1 pressure drop has increased from 100 Pa to 1910 Pa for a collected particle mass of 24.4 mg (mc1 (phase 1) + mc1 (phase 2), ). Stage 1 clogging is again clearly revealed as its protective effect on downstream stages 2 and 3. The volume of particles corresponding to the collected mass mc = 24.4 mg is determined from
Figure 5. Variation in pressure drop of the three stages of “10-L/min” column during clogging: phases 1 and 2 (— stage 1, ….. stage 2, —- stage 3). Q = 11.6 L/min.
where αp is the particle packing fraction estimated from Kim’s data (Kim, Citation2009), equal to 0.05, and ρp is the particle density (Zn/Al alloy 85/15 %), equal to 5.74 g.cm−3. The volume Vp calculated in this way is equal to 0.085 cm3, that is, 1.6% of the porous volume of the layer (5.3 cm3). This clogged volume (1.6%) is therefore enough to increase the stage 1 pressure drop to a high value (1910 Pa).
These results confirm the fact that clogging occurs in the first millimeters of the granular layer (Bémer and Subra, Citation2013). If the particle cake so formed at the bed surface increases the pressure drop significantly, this is also beneficial insofar as it also enhances the filtration efficiency.
“10-L/min” column—Study of pressure drop regeneration
shows the variation in pressure drop with time for the three 11-mm-thick stages (initial pressure drop equal to 40 Pa). In this experiment, stage 1 unclogging was initiated when its pressure drop reached a value of 1000 Pa. The figure also shows the variation of the total mass efficiency of the column (3 × 11 mm + 105 mm) during filtration. When clogging starts, the stage 1 pressure drop kinetic behavior is slow and similar to that described in the previous experiment. It then evolves cyclically due to unclogging, akin to the variations observed for industrial dust collectors using media filters cleaned by injecting compressed air in reverse flow (Kavouras, Citation2005). The low variation in stages 2 and 3 pressure drop confirm the protective effect of the first layer. The column mass efficiency in the three 11-mm stages + one 105-mm stage configuration is high, between 98.5 and 99%. At the end of the experiment, we note an increase in cycle frequency, indicating that layer 1 is near to saturation and hence to possible replacement.
Figure 6. Variation in pressure drop of the three stages of “10-L/min” column during clogging/unclogging cycles (— stage 1, ….. stage 2, — stage 3): 3 × 11 mm + 105 mm (dg = 0.7 mm) column stages, Q = 6.1 L/min – Cm1 = 80.6 mg/m3. Numbers in italics represent the column total efficiency.
Zn dosing at the different stages allowed us to perform the mass balance shown in . The masses are slightly better distributed in the four stages than in the previous clogging experiments (without unclogging) (, phase 3). This can be attributed to the unclogging operation, which in destabilizing the granular layers could redistribute the particles on other stages.
Table 2. Mass balance on the “10-L/min” column during clogging/unclogging cycles: Zn analyses
A test was conducted to monitor the air quality downstream of the clogged column following the previously described experiment. This test involved supplying the column with filtered air at the same flow rate of 6.1 L/min and analyzing the concentration downstream the column using a condensation particle counter (CPC 5400, Grimm) when stage 1 unclogging was activated. The results, not reported here, showed absolutely no increase in particle concentration following unclogging under clean air. No reentrainment of the collected particles was therefore detected in this test configuration, in which the 105-mm final stage enables capture of particles possibly emitted by the previous stages during unclogging.
“100-m3/hr” pilot system
The variation in pressure drop of the two stages of the “100-m3/hr” pilot is shown in . The initial pressure drop of stages 5-cm/0.7-mm and 20-cm/1.5-mm was respectively equal to 860 and 740 Pa. As we can see, these are very similar to the results obtained with the “10-L/min” column: The first stage again plays a protection role with respect to the layer downstream of it. A fairly regular increase in the stage 1 residual ΔP with time can be observed (the residual ΔP is defined by the ΔP after unclogging). The total efficiency (eq 6) lies between 96.4% and 97.4%. (Technical problems did not allow us to perform unclogging at the ΔP limit value of 13,000 Pa at the start of the test.)
Figure 7. Variation in pressure drop of the two stages of the “100-m3/hr” pilot system during clogging/unclogging cycles: (◊) 5 cm (dg = 0.7 mm), (–) 20 cm (dg = 1.5 mm); Q = 100 m3/hr, Ce = 93 mg/m3. Numbers in italics represent column total efficiency.
The downstream concentration was monitored using the ELPI () for both the pilot system assembly configuration comprising one 5-cm stage ( = 0.7 mm) followed by one 20-cm stage (
= 1.5 mm) and a second configuration comprising only two 5-cm stages (
= 0.7 mm). At the end of the test, unclogging was activated when the particle generation system had been stopped. (ELPI calculations were performed using the apparent density ρe = 0.96 g/cm3 as the particle density.)
Figure 8. Variation in number concentration downstream of “100-m3/hr” pilot system in the two configurations tested: 5 cm/0.7 mm + 20 cm/1.5 mm, and 2 × 5 cm/0.7 mm, ELPI measurements. At end of test the cleaning was activated when particle generation system was stopped.
The concentration peaks related to each activation of the unclogging system are clearly highlighted. These were followed by a regular decrease of the concentration due to the gradual reconstitution of the particle cake at the upstream stage surface. The decrease in concentration was much faster with the two 5-cm stages configuration ( = 0.7 mm). In the two configurations, the concentration peak disappears completely when the generation system is stopped and the granular bed is supplied with clean air. This result confirms the absence of particles reentrainment already observed with the “10-L/min” column experiments. These tests show that the observed concentration peaks are caused by preferential paths for the air being created by instantaneous dislocation of the granular medium during unclogging. The 20-cm-thick stage (
= 1.5 mm) would appear to be insufficient to completely stop particle emission, while the incorporation of a 5-cm final stage (
= 0.7 mm) seems to have a very significant improvement.
Conclusion
The solution of a multistage granular bed unclogged by a vibrating probe for filtering metal UFP appears promising. The tests conducted on both the low-flow-rate experimental column and the 100-m3/hr prototype show that performance in terms of pressure drop and filtration efficiency is good and would permit an industrial-scale application to be envisaged.
The multistage configuration of the granular bed offers many advantages compared to a single layer:
The first stage concentrates the major part of the sampled aerosol and for this reason facilitates the pressure drop regeneration of the whole system. This configuration also limits the quantity of granular material to be regenerated once the layer is saturated and needs to be replaced.
If the accumulation of the UFP inside the first layer contributes to increase the pressure drop, it also has a beneficial effect in strongly increasing the filtration efficiency. This increase in filtration efficiency is maintained during the clogging/unclogging operating regime.
The other layers also contribute to the filtration efficiency of the whole granular bed but are essentially used to control the particles not retained by the first layer during its unclogging.
However, several points remain to be examined:
The optimization of the multistage granular bed must be made based on theoretical models for filtration taking into account the bed loading: number of stages, beads diameter, layer thickness, filtration velocity, and so on.
Beads regeneration for a possible reuse: Regeneration by soaking in water baths subjected to ultrasonic waves is envisaged.
The granular bed unclogging by vibrating probe could be improved, in particular by minimizing the particle concentration peaks while maintaining the same pressure drop decrease.
Increasing the exchange surface areas, drawing on honeycomb-type filter structures used to filter combustion gases, for example.
Implementation of the system in an industrial environment is currently being studied. This would allow system performance characteristics to be tested over longer periods and more accurate determination of certain parameters, such as the usage time of the granular bed before replacement and hence the consumption of required granular material.
Nomenclature
| Cm | = | = particle mass concentration, mg/m3 |
| Cn | = | = particle number concentration, 1/cm3 |
| = | = mean glass beads diameter, mm | |
| dm | = | = equivalent mobility particle diameter, m |
| dv | = | = equivalent volume particle diameter, m |
| E | = | = efficiency |
| mci | = | = mass of particles collected by stage i, mg |
| mexp,1, mexp,4 | = | = measured mass of particles entering and leaving the column, mg |
| mi | = | = calculated mass of particles entering the stage i, mg |
| Q | = | = air flow rate, m3/hr |
| t | = | = time, sec |
| Vp | = | = volume of particles, cm3 |
Greek symbols
| αg = granular bed packing fraction | = | |
| αp = particle layer packing fraction | = | |
| ΔP = differential static pressure, Pa | = | |
| ρe = particle apparent density, g/cm3 | = | |
| ρp = density, g/cm3 | = | |
| σg = geometric standard deviation of the particle size distribution | = |
Subscripts
i = fitration stage
j = class of the Nanoscan analyzer
Acknowledgment
The authors thank their colleagues V. Matera and J. M. Elcabache at the INRS pollutant metrology laboratory for the analyses performed within the scope of this study.
Additional information
Notes on contributors
D. Bémer
D. Bémer, L. Wingert, Y. Morele, and I. Subra all work at the Institut National de Recherche et Sécurité (INRS).
L. Wingert
D. Bémer, L. Wingert, Y. Morele, and I. Subra all work at the Institut National de Recherche et Sécurité (INRS).
Y. Morele
D. Bémer, L. Wingert, Y. Morele, and I. Subra all work at the Institut National de Recherche et Sécurité (INRS).
I. Subra
D. Bémer, L. Wingert, Y. Morele, and I. Subra all work at the Institut National de Recherche et Sécurité (INRS).
Related Research Data
References
- Bémer, D., I. Subra, Y. Morele, A. Charvet, and D. Thomas. 2013. Experimental study of granular bed filtration of ultrafine particles emitted by a thermal spraying process. J. Aerosol Sci. 63:25–37. doi:10.1016/j.jaerosci.2013.04.005
- Bémer, D., R. Régnier, and Y. Morele. 2013. Study of clogging and cleaning cycles of a pleated cartridge filter used in a thermal spraying process to filter ultrafine particles. Powder Technol. 234:1–6. doi:10.1016/j.powtec.2012.09.035
- Boulaud, D. 1991. Use of granular beds in the inertial impaction regime for aerosol size distribution measurement. J. Aerosol Sci. 22:273–287. doi:10.1016/S0021-8502(05)80006-0
- Charvet, A., S. Bau, N. C. Paez-Coy, D. Bémer, and D. Thomas. 2014. Characterizing the effective density and primary particle diameter of airborne nanoparticles produced by spark discharge using mobility and mass measurement (tandem DMA/APM). J. Nanopart. Res. 16:3–11. doi:10.1007/s11051-014-2418-y
- DeCarlo, P.-F., J. G. Slowik, D. R. Worsnop, P. Davodovits, and J. Jimenez. 2004. Particle morphology and density characterization by combined mobility and aerodynamic diameter. Aerosol Sci. Technol. 38:1185–1205. doi:10.1080/027868290903907
- El-Hedock, I., L. Whitmer, and R. C. Brown. 2011. The influence of granular flow rate on the performance of a moving bed granular filter. Powder Technol. 214:69–76. doi:10.1016/j.powtec.2011.07.037
- Gutfinger, C., and G. I. Tardos. 1979. Theoretical and experimental investigation on granular bed dust filters. Atmos. Environ. 13:853–867. doi:10.1016/0004-6981(79)90276-2
- Gutfinger, C., D. Pnueli, and M. Fichman. 1988. Effect of particle loading on granular bed filtration—Extension of the CEF model to polydisperse systems. J. Aerosol Sci. 19:443–450. doi:10.1016/0021-8502(88)90019-5
- Japuntich, D. A., J. I. T. Stenhouse, and B. Y. H. Liu. 1994. Experimental results of solid monodisperse particle clogging of fibrous filters. J. Aerosol Sci. 25:385–393. doi:10.1016/0021-8502(94)90089-2
- Kim, S-C., J. Wang, J. Shin, et al. 2009. Structural properties and filter loading characteristics of soot agglomerates. Aerosol Sci. Technol. 43:1033–1041. doi:10.1080/02786820903131081
- Kavouras, A., and G. Krammer. 2005. A model analysis on the reasons for unstable operation of jet-pulsed filters. Powder Technol. 154:96–105. doi:10.1016/j.powtec.2005.03.016
- Kuo, Y.-M., S.-H. Huang, W.-Y. Lin, et al. 2010. Filtration and loading characteristics of granular bed filters. J. Aerosol Sci. 41:223–229. doi:10.1016/j.jaerosci.2009.09.011
- Lee, K.-C., R. Pfeffer, and A. M. Squires. 2005. Granular-bed filtration assisted by filter-cake formation. 1) Exploiting a new mode of soil failure for renewal of filtration surfaces in a panel bed. Powder Technol. 155:5–16. doi:10.1016/j.powtec.2005.03.010
- Lehnert, M., B. Pesch, and A. Lotz. 2012. Exposure to inhalable, respirable, and ultrafine particles in welding fumes. Ann. Occup. Hyg. 56(5):557–567. doi:10.1093/annhyg/mes025
- Lu, H.-C., and C.-J. Tsai. 1998. A pilot-scale study of the design and operation parameters of a pulse-jet baghouse. Aerosol Sci. Technol. 29:510–524. doi:10.1080/02786829808965587
- Moldavsky, L., C. Gutfinger, A. Oron, and M. Fichman. 2013. Effect of sonic waves on gas filtration by granular beds. J. Aerosol Sci. 57:125–130. doi:10.1016/j.jaerosci.2012.10.002
- Ozis, F., M. Singh, J. Devinny, and C. Sioutas. 2004. Removal of ultrafine and fine particulate matter from air by a granular bed filter. J. Air Waste Manage. Assoc. 54:935–940. doi:10.1080/10473289.2004.10470962
- Peukert, W., and C. Wadenpohl. 2001. Industrial separation of fine particles with difficult dust properties. Powder Technol. 118:136–148. doi:10.1016/S0032-5910(01)00304-7
- Puncochar, M., J. Drahos, and J. Cermak. 1990. The limits of applicability of pressure drop correlations. Chem. Eng. Sci. 45:2994–2998. doi:10.1016/0009-2509(90)80198-N
- Rodon, I., K.-C. Lee, R. Pfeffer, A. M. Squires, and O. K. Sonju. 2005. Granular-bed filtration assisted by filter-cake formation. 2) The panel bed gas filter with puffback renewal of gas-entry surfaces. Powder Technol. 155:52–61. doi:10.1016/j.powtec.2005.03.009
- Shapiro, M., G. Laufer, and C. Gutfinger. 1986. Experimental study on electrostatically enhanced granular filters. Aerosol Sci. Technol. 5:435–445. doi:10.1080/02786828608959107
- Walsh, D. C. 1996. Recent advances in the understanding of fibrous filter behaviour under solid particle load. Filtration Separation June:501–506. doi:10.1016/S0015-1882(97)84316-9
- Witschger, O. 2007. Les Nanoparticules—Un enjeu majeur pour la santé au travail, ed. Avis d’experts INRS, Les Ulis, France: EDP Science, 157–190.
- Xiao, G., X. Wang, J. Zhang, et al. 2013. Granular bed filter: A promising technology for hot gas clean-up. Powder Technol. 244:93–99. doi:10.1016/j.powtec.2013.04.003