
ABSTRACT
The Deepwater Horizon oil spill is considered one of the largest marine oil spills in the history of the United States. Air emissions associated with the oil spill caused concern among residents of Southeast Louisiana. The purpose of this study was to assess ambient concentrations of benzene (n=3,887) and fine particulate matter (n=102,682) during the oil spill and to evaluate potential exposure disparities in the region. Benzene and fine particulate matter (PM2.5) concentrations in the targeted parishes were generally higher following the oil spill, as expected. Benzene concentrations reached 2 to 19 times higher than background, and daily exceedances of PM2.5 were 10 to 45 times higher than background. Both benzene and PM2.5 concentrations were considered high enough to exceed public health criteria, with measurable exposure disparities in the coastal areas closer to the spill and clean-up activities. These findings raise questions about public disclosure of environmental health risks associated with the oil spill. The findings also provide a science-based rationale for establishing health-based action levels in future disasters.
Implications: Benzene and particulate matter monitoring during the Deepwater Horizon oil spill revealed that ambient air quality was a likely threat to public health and that residents in coastal Louisiana experienced significantly greater exposures than urban residents. Threshold air pollution levels established for the oil spill apparently were not used as a basis for informing the public about these potential health impacts. Also, despite carrying out the most comprehensive air monitoring ever conducted in the region, none of the agencies involved provided integrated analysis of the data or conclusive statements about public health risk. Better information about real-time risk is needed in future environmental disasters.
Introduction
The Deepwater Horizon oil spill was the largest marine oil spill in the history of the United States (U.S. Environmental Protection Agency [EPA], Citation2015a), and some scholars and news media argue that it was one of the worst environmental disasters (Houck, Citation2010; Silverleib, Citation2010; British Broadcasting Corporation, Citation2010). The disaster began on April 20, 2010, when an explosion and fire occurred on a drilling rig in the Gulf of Mexico approximately 50 miles offshore of Venice, Louisiana (EPA, Citation2010a; Middlebrook et al., Citation2012). With the uncapped well spewing an estimated 50,000–70,000 barrels of oil a day (McNutt et al., Citation2012), the United States Coast Guard (USCG) and British Petroleum (BP) began controlled burns to keep the oil from reaching and damaging the coastline (Mufson, Citation2010). The explosion, evaporating oil, controlled surface oil burns, emissions from the ships used for cleanup and recovery, and secondary aerosols combined to create unknown air quality conditions in the Southeast Louisiana region. Middlebrook et al. (Citation2012) made new scientific discoveries related to oil spill emission particle size, secondary aerosol formation, and advection/dispersion in the atmosphere and concluded that “it was likely that secondary organic aerosols from the Deepwater Horizon site impacted aerosol levels in populated areas near the Gulf Coast” (pp. 20285). The impact of oil spill emissions on people on the ground, however, has been less studied. To address this gap in knowledge, we evaluated urban, coastal, and regional concentrations of fine particulate matter (aerodynamic diameter <2.5 μm [PM2.5]) and benzene in ground-level ambient air. Our study offers new results about the possible public health implications of the oil spill.
Prior to the Deepwater Horizon oil spill, the Southeast Louisiana region was considered an area with moderate air quality in terms of primary air pollutants (except for St. Bernard Parish); however, the region had a high risk of cancer from toxic air pollutant exposure, primarily benzene (EPA, Citation2011a, Citation2013a). A limited set of permanent stationary air monitoring devices monitored compliance with Clean Air Act standards in the region. Recognizing the inadequacy of this network to monitor public environmental exposures during the oil spill, an extensive emergency air monitoring effort—led by the EPA, the Centers for Disease Control and Prevention (CDC), the National Oceanic and Atmospheric Administration (NOAA), and BP—quickly emerged to fill the gaps in air monitoring (Wright and Nance, Citation2014). The emergency network utilized mobile and stationary devices to take spatially and temporally integrated samples and readings. This was perhaps the most extensive sampling regime ever undertaken in the region. Over 1 million ambient air measurements were gathered during the oil spill; however, only the permanent stationary monitoring stations met the federal criteria for regulatory monitors (Wright and Nance, Citation2014). Worker exposure measurements were also gathered by the CDC, Occupational Safety and Health Administration (OSHA), USCG, BP, as well as atmospheric measurements gathered by NOAA but were not the subject of this study.
By law (Protection of Environment, 40 CFR Part 50 Appendix N), regulatory monitors are usually located in highly populated urban areas to ensure that standards are being met in areas most likely to exhibit public health impacts (EPA, Citation2011b). Yet, the areas most likely impacted by oil spill emissions were along the sparsely populated coast where no regulatory monitors were available. The EPA worked to address this gap by installing 13 emergency stationary monitors along the Louisiana coast. These emergency stationary monitors measured hydrogen sulfide (H2S), carbon monoxide (CO), particulate matter (PM), and volatile organic compounds (VOCs) (EPA, 2010, Citation2013). For the purposes of this study, we chose to examine ambient air concentrations of PM and the VOC benzene, both of which were prevalent during the oil rig explosion, oil spill, and subsequent cleanup. We also chose to compare the data gathered during the disaster with health-based levels under the federal provision that recognizes comparison with National Ambient Air Quality Standards (NAAQS) when ambient air concentrations are high enough to cause concern (40 CFR Part 50 Section 50.14).
According to the EPA, PM is one of two pollutants that pose the greatest threat to human health in the United States—the other is ground-level ozone (Air Now, Citation2015; EPA, Citation2015b). PM is a complex mixture of extremely small particles and liquid droplets made up of acids (such as nitrates and sulfates), organic chemicals, metals, and soil or dust particles (EPA, Citation2013b). The size of PM determines the potential health impact. Consequently, the EPA separates PM into two groups: inhalable coarse particles (aerodynamic diameter <10 μm; PM10) and fine particles (PM2.5). PM10 is often found near roadways and dusty industries, whereas PM2.5 particles are emitted from fires or can form when gases released from industrial sources and fossil fuel combustion react in the air. PM2.5 is of greater concern because its small particle size allows for deep penetration into the lungs and possibly into the bloodstream (EPA, Citation2013b). Adverse health effects include nonfatal heart attacks, aggravated asthma, and impaired lung function. Because of the known health effects of PM, residents of Southeast Louisiana were rightly concerned about possible health threats from the oil spill (Institute of Medicine [IOM], Citation2010).
The Clean Air Act National Ambient Air Quality Standards (NAAQS) take into account the public health impacts of exposure to PM in the short term (hours to days) and in the long term (months to years). The annual (long-term) PM2.5 standard of 12 μg/m3 is less than the 24-hr (short-term) standard of 35 μg/m3 because a healthy human body has the capacity to recover from a higher short-term dose. Exposure to continual doses over time is difficult for the body to absorb; hence, a lower long-term standard is required to protect public health (EPA, Citation2014a). Presently, the Clean Air Act requires hourly continuous monitoring of PM using specified monitoring equipment at targeted locations based on population density. These data are used to calculate short-term and long-term concentrations for comparison with the standards.
Benzene is a component of petroleum and is listed as one of the top 20 chemicals produced in the United States. It is a colorless, volatile, and highly flammable liquid present in both natural and urbanized environments. Common sources of benzene include tobacco smoke, gas stations, and motor vehicle exhaust (CDC, Citation2013; Agency for Toxic Substances and Disease Registry [ATSDR], Citation2007). The most common route of exposure is inhalation, and benzene exposure has been shown to result in leukemia and blood-related diseases following long-term exposure (ATSDR, Citation2007; American Cancer Society [ACS], Citation2013). The EPA estimates an increased lifetime cancer risk of 2.2 × 10⁻⁶ to 7.8 × 10⁻⁶ for an individual who is continuously exposed to 1 µg/m3 of benzene in the air over their lifetime (EPA, Citation2012). More than 100 studies show there is no safe level of benzene; all concentrations contribute to cancer risk (Baan et al., Citation2009).
Regulatory air monitors located in the urban centers of Southeast Louisiana showed no exceedances of Clean Air Act standards during the oil spill (Louisiana Department of Environmental Quality [LDEQ], Citation2010). This finding implies there were no public health impacts of concern. However, not addressed are the potential public health impacts not measured by the formal regulatory monitoring network. During the spill, an enormous number of independent samples of urban, coastal, and mixed regional air were taken using stationary and mobile monitors, and these data were recently made available to the public. These unique data sets make the Southeast Louisiana region a relatively well-constrained case for evaluating potential public health impacts from the spill. The Southeast Louisiana coastal region in question is a poorly sampled area (in terms of air monitoring), with large variations in background cancer risk, household income, and population density (EPA, Citation2011a; LDEQ, Citation2010; U.S. Census Bureau, Citation2010). A rich body of research definitively concludes that socioeconomically disadvantaged groups in general are more likely to be at risk of environmental hazards (Bullard, Citation2000; Bullard et al., Citation2007; James et al., Citation2012). The oil spill represented a potentially catastrophic environmental health hazard with both immediate and long-term effects (Solomon and Janssen, Citation2010). People living and working in the area, especially people along the coast, were apprehensive about their exposures. Therefore, the objectives of this study were (1) to determine if health-based standards were exceeded during the oil spill; and (2) to assess the possibility of disparities in environmental exposures between the urban centers and the more rural coastal region of Southeast Louisiana.
Experimental methods
Study area and time frame
Six parishes in Southeast Louisiana were selected as the study area: Jefferson, La Fourche, Orleans, Plaquemines, St. Bernard, and Terrebonne. This 4138-square-mile (10,717-km2) region was selected because it was located closest to the oil spill, had the largest potentially exposed population, and was well sampled throughout the disaster. The time frame for the study was May 1, 2010, to September 30, 2010. Although additional data were partly available 3 days before and 3 months after this period, the selected months represent the core period of oil spill emissions and burning and account for residual effects after the well was temporarily capped in July, and later permanently capped in early September.
Oil spill air monitoring data
Over 1 million measurements of ambient air were gathered during the oil spill. The EPA and BP established independent ambient air monitoring and air sampling programs. Monitoring made use of either stationary or mobile (i.e., mounted on a vehicle) direct-read equipment (British Petroleum, Citation2010, Citation2015). Air sampling involved taking a volume of air and sending it to a laboratory for analysis.
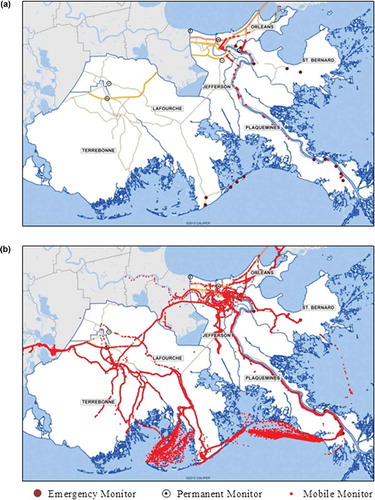
BP and EPA deployed stationary and mobile monitoring devices that took random-grab samples and time-weighted samples. For the purposes of this study, air monitoring was divided into three categories: urban, coastal, and regional. The urban category encompassed permanent and emergency stationary monitors located in the major cities of each parish. The coastal category was composed of emergency stationary monitors installed along the coastline in response to the spill. The regional category consisted of emergency mobile monitors installed on vehicles that traversed the parishes (e.g., coastal and urban) during the disaster. As shown in and , BP conducted more regional air monitoring over a larger study area than the EPA, whereas much of the EPA’s efforts were focused on emergency stationary monitoring at discrete coastal locations.
Figure 1. (a) EPA permanent and emergency monitoring sites and mobile monitoring routes. (b) BP mobile monitoring routes. Data by EPA and BP. Samples and readings taken over water by boat were not included in the analysis.
It is important to distinguish emergency monitoring from permanent monitoring not only because of location differences. The data collected from emergency monitors (both coastal and regional) are considered “unofficial” because the equipment used did not meet formal Clean Air Act requirements. Only the permanent monitors (urban only) maintained by the Louisiana Department of Environmental Quality (LDEQ) met the strict Clean Air Act regulatory criteria for monitoring equipment. Consequently, only results from official permanent monitors have to be reported to the public. There are no reporting requirements for environmental data gathered during an emergency. In this study, we compared data gathered during the oil spill via emergency monitors with Clean Air Act standards and with regulatory data gathered at permanent monitors to assess potential public health impacts. The paper therefore presents findings that to our knowledge have not been reported.
Selected pollutants
Particulate matter and benzene were assessed in this study because of the potential for significant ambient air emissions, the availability of data across the parishes, and clear health-based guidelines/standards. EPA installed stationary filter samplers to take 24-hr particulate matter readings and installed stationary Met One E-BAM monitors (Met One Instruments, Inc., Grants Pass, Oregon) to take 1-hr PM readings. BP deployed a TSI Sidepack Personal Aerosol Monitor 265 (AM510) (TSI Incorporated, Shoreview, MN) instrument with cyclone to take continuous mobile PM readings. For benzene, EPA installed stationary 24-hr samplers and brought in its Trace Atmospheric Gas Analyzer (TAGA) (US Environmental Protection Agency, Washington, DC) for continuous mobile monitoring. Detection limits ranged from 0.127 to 16.00 μg/m3. BP outfitted its mobile monitoring vehicle with a GASTEC (GASTEC Corporation, Fukayanaka, Ayase-City, Kanagawa, Japan) gas detection instrument to take continuous benzene readings, with a detection limit of 0.05–0.50 ppm. Taken together, these instruments (GASTEC Corporation, Fukayanaka, Ayase-City, Kanagawa, Japan) gathered a total of 106,569 data points within the study area for the duration of the study period.
Particulate matter
Particulate matter (PM) was a significant contaminant released during the oil spill. Two days of aircraft measurements were taken above the oil spill by scientists from the National Oceanic and Atmospheric Administration. With these data, Middlebrook et al. (Citation2012, figure 7) estimated that over 1000 metric tons of soot particles were emitted from controlled burns and over 10,000 metric tons of secondary aerosol particles were created from evaporating hydrocarbons between April 20 and July 20, 2010. Daily and hourly PM data were gathered by the EPA via emergency stationary coastal monitors. When pooled across monitors, this sampling produced 1144 hourly PM2.5 data points (August 21, 2010, to September 6, 2010) in coastal areas only. BP’s emergency mobile monitors gathered 101,261 continuous PM2.5 data points (May 14, 2010, to December 21, 2010) in both urban and coastal areas. Daily PM2.5 data consisting of 277 24-hr averages (from an estimated 63,200 hourly PM2.5 data points) were simultaneously gathered at six permanent stationary monitors operating continuously in the urban areas of the region in accordance with Clean Air Act requirements (May 1, 2010, to September 30, 2010). Total raw sample size was 102,682 data points.
Benzene
Benzene was a significant contaminant in the oil and was released in massive quantities during the oil spill. A large quantity of benzene data was collected across the six parishes. The EPA also identified benzene as one of the leading air toxics that drives national cancer risk in the United States via the National-Scale Air Toxics Assessment (NATA) (EPA, Citation2010b). Only EPA ambient benzene concentration data was examined in this study because BP’s benzene data did not meet instrument sensitivity criteria. The benzene data consisted of 1053 daily stationary data points (April 28, 2010, to September 18, 2010) and 2834 continuous mobile data points (April 28, 2010, to September 21, 2010). Total raw sample size for benzene was 3887 data points.
Data preparation
Raw data obtained from EPA and BP were sorted by pollutant, parish, and monitoring station, and were truncated to the study period. The data were then averaged to the appropriate time interval to examine short-term and long-term concentrations of PM and long-term concentrations of benzene ( and ). Nondetect data points were eliminated. In addition, coastal data obtained by boat and other data gathered from locations outside of the study area were not used.
Table 1. Descriptive statistics for oil spill PM2.5 data.
Table 2. Descriptive statistics for oil spill benzene data.
Long-term and short-term comparisons
For our study, the study period for the analysis was 5 months (May 1, 2010 to September 30, 2010), which corresponded to the primary period of potential exposure. Although potential exposure continued as long as oil was floating and burning on the ocean surface and as long as disaster vehicles and equipment were active, there likely was a tapering off of air pollution after the well was permanently capped in September 2010. It is certainly possible that exposure continued beyond the 5-month active oil spill. BP continued gathering ambient air data into December 2010, perhaps to document the rate at which air pollution levels tapered off after the spill. But because the EPA did not extend their data gathering efforts that far and because we wanted to have more than one data source for the purposes of triangulation and validity, we set the study period to 5 months. Our study therefore addresses both short-term (hours to days) and medium-term (weeks to months) ambient air concentrations.
National Ambient Air Quality Standards (NAAQS) for particulate matter are based on 24-hr and annual means. These short-term and long-term NAAQS were derived from many epidemiological studies that investigated exposure dose–response as a function of PM concentration. Schwartz (Citation2000) and Krewski et al. (Citation2000, Citation2009) showed that short-term exposure studies failed to characterize the full impact of exposure to PM in the presence of days or months of prior exposure. Their findings demonstrated that mortality due to PM exposure is a function of both the concentration as well as the number of days at a given concentration (EPA, Citation2010b). Consequently, a short-term standard alone is not sufficient to understand health impact. Studies by Beverland et al. (Citation2012) and Alexeeff et al. (Citation2011) confirmed that medium-term (1–3-month) exposures produced larger health effects than short-term (1–3-day) exposures, and that long-term (up to 10 yr) effects were stronger still. Given these findings from the literature, we concluded that 5 months of data better approximated the health impacts associated with an annual exposure than a 24-hr exposure and that, lacking a medium-term standard, applying the NAAQS annual standard was reasonable for the exploratory and comparative purposes of our study.
Stationary monitors captured a single data point on every first, second, third, or fourth day, and the mobile monitors captured data nearly continuously for 24 hr each day. Each data set contained a sufficient number and frequency of measurements (i.e., the proportion of hours or days with available data to the total hours or days in the period) to allow direct comparisons with short-term and long-term standards or guidelines, and all valid data points were used in the analysis. Because the data were taken in varying locations, it was possible to make generalized comparisons of overall air quality at different locations during the spill.
We used the Kruskal-Wallis H test to assess the distributions of regional, coastal, and urban data because two of the data sets were non-normally distributed and all had large variations in sample size (Ghasemi and Zahediasl, Citation2012). Only the urban PM data were normally distributed and the Kruskal-Wallis H test results demonstrated that the urban, coastal, and regional data sets were statistically different and could therefore be treated separately.
To examine the potential health concerns associated with air quality prior to and during the oil spill, we counted the number of times the EPA’s Air Quality Index (AQI) for PM2.5 exceeded 100 in each parish. When an AQI value exceeds 100, air quality is considered unhealthy for certain sensitive groups, and as AQI values continue to rise, the general public is then affected. The number of AQI exceedances in each parish was calculated and recorded as exceedance days (EPA, Citation2013a, Citation2014b; LDEQ, Citation2010). The AQI is reported throughout the day to inform the public of the health effects of their local air. Currently, the AQI is calculated for five air pollutants: ground-level ozone, PM, carbon monoxide, nitrogen dioxide, and sulfur dioxide (EPA, Citation2014b). The reported AQI typically represents the worst of the five pollutants. For this study, we focused only on PM2.5 contributions to the AQI during the spill.
To examine benzene-associated cancer risk and conduct a comparison with long-term standards for benzene, we analyzed benzene data available by parish for the study period. The resulting means were converted to cancer risk based on a benzene unit risk factor of 7.8 × 10⁻⁶. We then compared per parish cancer risk from benzene during the spill with the EPA’s low, high, and unacceptable cancer risk levels. These levels correspond to 1, 10, and 100 × 10−6, respectively. Although cancer risk from benzene exposure was calculated using benzene exposure data during the 5-month study period, the cancer risk estimation was conducted to allow for comparison with lifetime risk of benzene exposure.
Study results
shows the location of EPA’s emergency monitors and mobile routes, and LDEQ’s permanent monitoring stations. Terrebonne, La Fourche, St. Bernard, and Orleans parishes each had one permanent station located in the main city. Jefferson Parish had two permanent monitoring stations; however, Plaquemines Parish did not have a monitoring station. BP’s mobile monitoring routes used during the oil spill are shown in . We used two tests to determine the oil spill’s potential impact on public health. First, the oil spill data were compared with health-based or Clean Air Act standards. Second, the data were compared with background concentrations. Concentrations that exceeded background or Clean Air Act standards by at least a factor of 2, and concentrations that increased cancer risk by at least an order of magnitude (i.e., a factor of 10) suggested cause for concern.
Particulate matter: Before and during the disaster
provides descriptive statistics for the regional, urban, and coastal PM2.5 data collected during the oil spill. The mean PM2.5 concentrations observed from regional monitoring, stationary urban and coastal monitoring were 22.30, 9.68, and 17.33 μg/m3, respectively. The current primary annual PM2.5 NAAQS used for enforcement of the Clean Air Act is 12 μg/m3 (EPA, Citation2014a). Therefore, PM2.5 concentrations detected via regional and coastal monitoring during the oil spill both exceeded the NAAQS safe and acceptable limit designed to protect the general population against adverse health effects.
shows background AQI levels for the Southeast Louisiana parishes. Three parishes exceeded the AQI limit for unhealthy air on at least 1 day in 2009, indicating that background air pollutants were too high. St. Bernard Parish was excessively high prior to the disaster, having exceeded an AQI of 100 on 93 days in 2009, driven primarily by high SO2 levels for which the parish had been declared in nonattainment. Plaquemines Parish had no air monitoring station; thus, background air quality data were unavailable. The remaining two parishes had no AQI exceedance days in the year prior to the spill.
Figure 2. AQI exceedances (a) prior to and (b) during the Gulf oil spill. Data by EPA. AQI exceedances for (b) were determined from short-term particulate matter concentrations per parish.
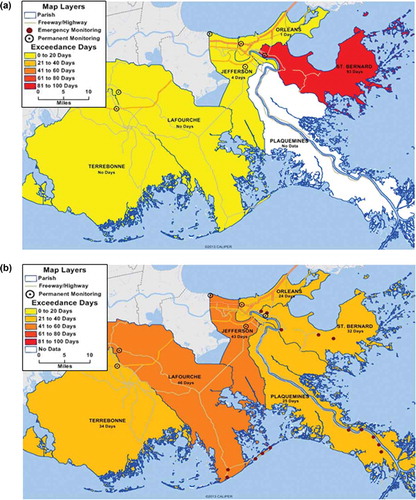
presents the results of the PM2.5 data analysis during the oil spill. Comparing these levels with the background AQI levels in reveals a sharp increase from 0–4 AQI exceedance days in 2009 (before the oil spill) to 24–46 AQI exceedance days during the oil spill. This represents estimated increases in exceedance days ranging from 10 to 45 times higher and indicates an unequivocal escalation of ambient PM exposure consistent with oil spill emissions.
In addition to the frequency of exceedance days, we also looked for increased PM2.5 concentrations that clearly exceeded the Clean Air Act standards. As shown in , the estimated long-term PM2.5 concentrations detected during the oil spill were approximately 2–3 times higher than the concentrations observed prior to the disaster in Jefferson, St. Bernard, and Terrebonne parishes, thus indicating the possibility of public health impacts.
Table 3. Summary of potential public health impacts from Gulf oil spill air emissions.
Benzene levels before and during the disaster
Descriptive statistics for benzene concentrations detected via regional and stationary coastal monitoring revealed mean benzene concentrations of 4.83 and 2.96 μg/m3, respectively (). The EPA established a 1-yr oil spill screening level of 20 μg/m3. The state of Louisiana’s ambient standard is 12 μg/m3 and the Clean Air Act’s Unacceptable Risk Level is 13 μg/m3. All three standard levels exceed the regional and coastal mean benzene concentrations observed during the oil spill, suggesting no threat to public health.
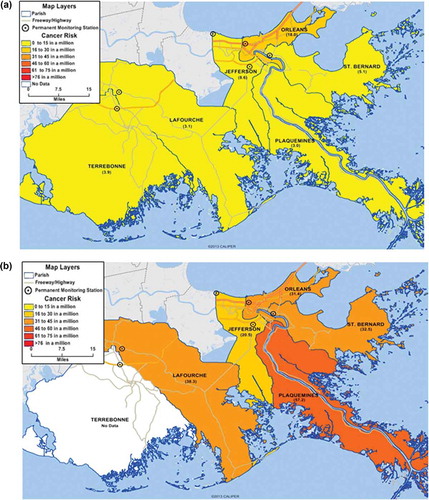
presents benzene-associated cancer risk per parish in 2005, the last year National-Scale Air Toxic Assessment (NATA) data were available. Orleans Parish (18 × 10−6) and Jefferson (8 × 10⁻⁶) were above the state mean of 6.8-in-a-million, although Orleans Parish had the highest risk. The remaining parishes had a 3–5-in-a-million increased chance of developing cancer. The state of Louisiana’s ambient air standard for benzene (12 μg/m3) corresponds to a cancer risk of 92-in-a-million chance. Therefore, background benzene levels in all six parishes met the Louisiana standard as well as the EPA oil spill screening level (20 μg/m3 or 154 × 10−6). But according to the EPA and the city of Houston, slightly more benzene (13 μg/m3) would correspond to the “unacceptable risk” end of the Clean Air Act’s cancer risk range, which is 100-in-a-million (EPA, Citation2010c; Raun, Citation2008). This means that Louisiana’s standard and the EPA’s screening level are about 2 orders of magnitude above the health-protective low risk limit of 1-in-a-million (0.13 μg/m3) established by the Clean Air Act.
Figure 3. (a) Benzene cancer risks (a) prior to and (b) during the Gulf oil spill. Data by EPA, BP, and LDEQ. Cancer risks were determined from average benzene concentration per parish.
Background benzene risk levels exceeded the Clean Air Act health-protective low risk cancer level in all six parishes, with Orleans and Jefferson exceeding the standard by approximately 1 order of magnitude and the remaining parishes exceeding the standard by up to half an order of magnitude. The existing background levels were unhealthy and presented an increased cancer risk. To determine excess public health impacts beyond background due to benzene released during the oil spill, we also looked for sharp increases in cancer risk at much higher levels than background. Because the EPA’s oil spill screening level for benzene and the state’s ambient benzene standard were not health protective, they could not be used to assess potential health impacts.
presents the benzene data analysis during the oil spill. Comparing these levels with the background cancer risk in reveals a sharp increase from a range of 3–18-in-a-million before the oil spill to 20–57-in-a-million during the oil spill. This represents an estimated 1 order of magnitude increase in risk and a 2–19-fold increase above background concentration, which indicates an unequivocal escalation of ambient benzene. These results provide a basis for concluding that benzene concentrations went from the low end of the cancer risk range (1–10 × 10−6) to the high end of that range (10–100 × 10−6) in each parish ().
Figure 4. Estimated cancer risk before and during the Gulf oil spill by parish. Benz = “benzene only” concentration in ambient air. Total = “all toxics” concentration in ambient air. Low cancer risk is 1 × 10⁻⁶; high cancer risk is 10 × 10−6; unacceptable cancer risk is 100 × 10−6 (EPA, Citation2012).
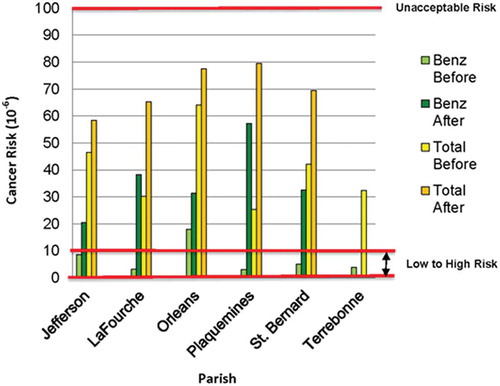
EPA’s 1-yr benzene screening level (20 μg/m3 or 154 × 10−6) for the Deepwater Horizon oil spill was defined as a level above which action would be taken. Despite significant increases in ambient air benzene concentrations measured via emergency monitoring equipment during the spill, all of the parishes still met the EPA screening level. Unfortunately, this screening level is not considered protective of health and could not be used to assess the potential health impacts of increased benzene. Lacking an effective benzene standard or guideline directly applicable to public health during the oil spill, we used the unit low risk level for benzene (0.13 μg/m3 or 1 × 10⁻⁶) to evaluate potential health impacts (). With this standard, the results indicate that ambient levels of benzene during the Deepwater Horizon oil spill were high enough to cause public health impacts.
Analysis of urban versus coastal exposure disparities
In , PM2.5 and benzene results are presented for urban and coastal areas. Overall, coastal (Jefferson, La Fourche, Plaquemines, and St. Bernard parishes) concentrations of PM2.5 and benzene were higher than urban (Jefferson, La Fourche, Plaquemines, St. Bernard, and Terrebonne) concentrations. This observation confirms that exposure to hazardous air pollutants was increased along the coast compared with the urban centers.
Table 4. Comparison of urban and coastal air quality during the oil spill.
shows that the coastal, urban, and regional PM data sets are statistically different. Air quality in the urban centers, measured by permanent stationary urban monitors, was relatively normal and exhibited far less variance than the coastal and regional data sets. The coastal data showed increased variation and higher absolute values that exceeded air quality standards. These findings suggest that there were at least two separate airsheds during the oil spill, and the populations within each airshed possibly encountered different exposures. The regional data, which included urban and coastal areas, reflect the wide variability of pollutant levels present in the six parishes during the disaster. These geographic exposure disparities were measurable in real time and therefore could have been used to issue region-specific preventive health announcements and precautions.
Table 5. Results of Kruskal-Wallis H tests of statistical similarity.
Discussion
Ambient concentrations of known air pollutants that exceed health-based Clean Air Act standards and guidelines are indeed an environmental health concern. Government agencies face extremely challenging circumstances during environmental disasters, and potentially controversial decisions have to be made in real time. Such decisions would benefit from having plans already in place that include thresholds for informing the public about potential health threats during a disaster. For the Deepwater Horizon oil spill, the EPA established that existing Clean Air Act standards were the appropriate threshold for primary air pollutants, including PM, during the disaster. However, there is no federal PM standard for a 5-month exposure period, and there is no threshold below which exposure to PM would be harmless (Brook et al., Citation2010). Rather than using an existing health-based guideline for benzene, EPA established a relatively high “one-year screening level.” There is no federal ambient benzene standard, neither is there a threshold concentration below which there is no benzene cancer risk (Baan et al., Citation2009).
The EPA’s level of concern for 1-yr benzene exposure (20 μg/m3) significantly exceeded other similar guidelines, such as the state of Louisiana’s ambient benzene standard (12 μg/m3), the state of Texas’ 1-yr benzene screening level (4.5 μg/m3), EPA’s regional cancer screening level (0.312 μg/m3), and the World Health Organization’s ambient benzene guideline (0.02 μg/m3). The EPA’s level of concern for benzene exposure during the oil spill also exceeded the Clean Air Act’s high risk cancer level (1.3 μg/m3). We concluded that the benzene screening level was not protective of public health and therefore was not an effective threshold for use during the spill.
Even though health-based air pollution thresholds were already established for short- and long-term PM2.5, they apparently were not used as a basis for informing the public about potential health impacts, especially with regard to more susceptible and/or more exposed population segments. Comprehensive air monitoring was conducted by numerous agencies, but none provided integrated analysis or conclusive statements about public health risk. People in Southeast Louisiana were exposed to higher PM levels for a minimum of 5 months in a row during the study period. Because in our view these concentration levels were high enough to cause concern, we compared them with the NAAQS PM annual standard. We also compared the hourly and daily PM concentrations with the NAAQS PM 24-hr standard. Our study was observational, not experimental; therefore, we had no control over the duration of possible exposure. But no matter how one looks at these data, we conclude there should have been cause for concern. Better information about real-time risk is needed in future disasters.
Given the results of this study, we recommend that government agencies involve local officials and the public in discussions about the health-based and regulatory air quality levels that should apply during an environmental disaster. These discussions could also cover the types of emergency monitoring equipment that would be acceptable so that as much data as possible would be recognized as valid in the context of a disaster. Similar plans could be developed for “fenceline” communities who may have to shelter in place during industrial accidents and whose sensitive populations may need to be temporarily evacuated. Adopting health-based disaster thresholds would facilitate decision-making, enhance public awareness, and reduce potential public health impact during an environmental crisis.
Conclusion
All available ambient air quality data gathered during the Deepwater Horizon oil spill were reviewed, and a total of 106,569 measurements of fine PM and benzene were evaluated. Ambient air concentrations of PM2.5 were generally higher during the oil spill than the previous year and exceeded the Clean Air Act’s 12 μg/m3 annual and 35 μg/m3 hourly standards in the parishes studied. Daily AQI exceedances for PM2.5 were 10–45 times higher than background in all of the parishes studied. All parishes also exceeded the annual 12 μg/m3 concentration standard by factors of 1.65–1.99. Similarly, ambient air concentrations of benzene were generally higher during the oil spill than during previous years. Benzene concentration reached 2–19 times higher than background, and the estimated cancer risk exceeded the Clean Air Act’s 10-in-a-million high risk guideline. These findings provide a basis for concluding that ambient air quality—for PM2.5 and benzene—was a likely threat to public health during the oil spill.
Acknowledgments
The authors gratefully acknowledge Angel Torres for providing mapping assistance. The authors also thank the U.S. Environmental Protection Agency and British Petroleum for making their data available to the public.
Funding
This research was supported by a grant from the US Environmental Protection Agency.
Additional information
Funding
Notes on contributors
Earthea Nance
Earthea Nance is an associate professor in the Department of Urban Planning and Environmental Policy and an associate dean in the Barbara Jordan-Mickey Leland School of Public Affairs at Texas Southern University in Houston, Texas.
Denae King
Denae King is the interim associate director of the Mickey Leland Center for Environment, Justice and Sustainability in the Barbara Jordan-Mickey Leland School of Public Affairs at Texas Southern University in Houston, Texas.
Beverly Wright
Beverly Wright is the executive director of the Deep South Center for Environmental Justice at Dillard University in New Orleans, Louisiana.
Robert D. Bullard
Robert D. Bullard is the dean of the Barbara Jordan-Mickey Leland School of Public Affairs at Texas Southern University in Houston, Texas.
References
- Agency for Toxic Substances and Disease Registry. 2007. Public Health Statement: Benzene. Division of Toxicology and Environmental Medicine, Centers for Disease Control and Prevention, Atlanta, GA, August 2007. http://www.atsdr.cdc.gov/toxprofiles/tp3.pdf (accessed October 22, 2015).
- Air Now. 2015. Air Quality Index (AQI)—A Guide to Air Quality and Your Health. http://airnow.gov/index.cfm?action=aqibasics.aqi (accessed October 22, 2015).
- Alexeeff, S.E., B.A. Coull, A. Gryparis, H. Suh, D. Sparrow, P.S. Vokonas, and J. Schwartz. 2011. Medium-term exposure to traffic-related air pollution and markers of inflammation and endothelial function. Environ. Health Perspect. 119:481–486. doi:10.1289/ehp.1002560
- American Cancer Society. 2013. Benzene. http://www.cancer.org/cancer/cancercauses/othercarcinogens/intheworkplace/benzene (accessed October 22, 2015).
- Baan, R., Y. Grosse, K. Straif, B. Secretan, F. El Ghissassi, V. Bouvard, L. Benbrahim-Tallaa, N Guha, C. Freeman, L. Galichet, V. Cogliano, and WHO International Agency for Research on Cancer Monograph Working Group. 2009. A review of human carcinogens–Part F: Chemical agents and related occupations. Lancet Oncol. 10:1143–1144. doi:10.1016/S1470-2045(09)70358-4
- Beverland, I.J., G.R. Cohen, M.R. Heal, M. Carder, C. Yap, C. Robertson, C.L. Hart, R.M. Aguis. 2012. A comparison of short-term and long-term air pollution exposure associations with mortality in two cohorts in Scotland. Environ. Health Perspect. 120:1280–1285. doi:10.1289/ehp.1104509
- British Broadcasting Corporation. 2010. Timeline: BP oil spill. http://www.bbc.com/news/world-us-canada-10656239 (accessed October 22, 2015).
- British Petroleum. 2010. Environmental sampling and monitoring during the response. http://www.bp.com/en/global/corporate/gulf-of-mexico-restoration/deepwater-horizon-accident-and-response/health-and-safety-in-the-response-effort.html (accessed May 13, 2015). Web site was updated to http://gulfsciencedata.bp.com/go/doc/6145/1942258/ ( accessedOctober 22, 2015).
- British Petroleum. 2015. Gulf Science Data: Air. http://gulfsciencedata.bp.com/go/doc/6145/2439086/Air (accessed October 22, 2015).
- Brook, R.D., S. Rajagopalan, C.A. Pope III, J.R. Brook, A. Bhatnagar, A.V. Diez-Roux, F. Holguin, Y. Hong, R.V. Luepker, M.A. Mittleman, et al. 2010. Particulate matter air pollution and cardiovascular disease: An update to the scientific statement from the American Heart Association. Circulation 121:2331–2378. doi:10.1161/CIR.0b013e3181dbece1
- Bullard, R.D. 2000. Dumping in Dixie: Race, Class and Environmental Quality, 3rd ed. Boulder, CO: Westview Press.
- Bullard, R., P. Mohai, R. Saha, and B. Wright. 2007. Toxic Wastes and Race at Twenty 1987–2007. http://www.ucc.org/environmental-ministries_toxic-waste-20 (accessed October 22, 2015).
- Centers for Disease Control and Prevention. 2013. Facts about Benzene. http://www.bt.cdc.gov/agent/benzene/basics/facts.asp (accessed October 22, 2015).
- Ghasemi, A., and S. Zahediasl. 2012. Normality tests for statistical analysis: A guide for non-statisticians. Int. J. Endocrinol. Metab. 10:486–489. doi:10.5812/ijem
- Houck, O.A. 2010. Worst case and the Deepwater Horizon blowout: There ought to be a law. Tulane Environ. Law J. 24:1–18.
- Institute of Medicine. 2010. Assessing the Effects of the Gulf of Mexico Oil Spill on Human Health: A Summary of the June 2010 Workshop. Washington, DC: The National Academies Press.
- James, W., C. Jia, and S. Kedia. 2012. Uneven magnitude of disparities in cancer risks from air toxics. Int. J. Environ. Res. Public Health. 9:4365–4385; doi:10.3390/ijerph9124365.
- Krewski, D., M. Jerrett, R.T. Burnett, R. Ma, E. Hughes, Y. Shi, M.C. Turner, C.A. Pope III, G. Thurston, E.E. Calle, and M.J. Thun. 2009. Extended Follow-Up and Spatial Analysis of the American Cancer Society Study Linking Particulate Air Pollution and Mortality. HEI Research Report 140. Boston, MA: Health Effects Institute.
- Krewski, D., R. Burnett, M. Goldberg, K. Hoover, J. Siemiatycki, M. Jarret, M. Abrahamowicz, and W. White. 2000. Reanalysis of the Harvard Six Cities Study and the American Cancer Society Study of Particulate Air Pollution and Mortality. Health Effects Institute Special Report. Boston, MA: Health Effects Institute, July 2000.
- Louisiana Department of Environmental Quality. 2010. Air Monitoring Fact Sheet. http://www.deq.louisiana.gov/portal/Portals/0/AirQualityAssessment/air%20quality%20fact%20sheet.pdf (accessed October 22, 2015).
- McNutt, M.K., R. Camilli, T.J. Crone, G.D. Guthrie, P.A. Hsieh, T.B. Ryerson, O. Savas, and F. Shaffer. 2012. Applications of science and engineering to quantify and control the Deepwater Horizon oil spill. Proc. Natl. Acad. Sci. U. S. A. 109:20260–20267.
- Middlebrook, A.M., D.M. Murphy, R. Ahmadov, E.L. Atlas, R. Bahreini, D.R. Blake, J. Brioude, J.A. de Gouw, F.C. Fehsenfeld, G.J. Frost, et al. 2012. Air quality implications of the Deepwater Horizon oil spill. Proc. Natl. Acad. Sci. U. S. A. 109:20280–20285. doi:10.1073/pnas.1110052108
- Mufson, S. Oil spill burned in Gulf of Mexico, in hope of saving coast. Washington Post April 29, 2010. http://www.washingtonpost.com/wp-dyn/content/article/2010/04/28/AR2010042800368.html (accessed October 22, 2015).
- Raun, L. 2008. City of Houston, Benzene Risk: Determining Carcinogenic Health Risk Concentration Levels for Benzene in Ambient Air at EPA, TCEQ and the City of Houston, September. http://www.greenhoustontx.gov/reports/benzenerisk.pdf (accessed October 22, 2015).
- Schwartz, J. 2000. Harvesting and long term exposure effects in the relation between air pollution and mortality. Am. J. Epidemiol. 151:440–448. doi:10.1093/oxfordjournals.aje.a010228
- Silverleib, A. 2010. The Gulf Spill: America’s worst environmental disaster? Cable News Network (CNN) August 10, 2010. http://www.cnn.com/2010/US/08/05/gulf.worst.disaster/ (accessed October 22, 2015).
- Solomon, G., and S. Janssen. 2010. Health effects of the Gulf oil spill. JAMA 304:1118–1119. http://jama.jamanetwork.com/article.aspx?articleid=186531 (accessed October 22, 2015). doi:10.1001/jama.2010.1254
- U.S. Census Bureau. 2010. Thematic maps. http://www2.census.gov/geo/pdfs/maps-data/maps/thematic/us_popdensity_2010map.pdf (accessed October 22, 2015).
- U.S. Environmental Protection Agency. 2010a. EPA Region 6 Air Sampling and Monitoring Quality Assurance Sampling Plan for the Deepwater Horizon Incident. http://www.epa.gov/bpspill/samplingplanjune1/EPA_Region_6_Air_Sampling_and_Monitoring_QASP_050510.pdf (accessed October 22, 2015).
- U.S. Environmental Protection Agency. 2010b. Quantitative Health Risk Assessment for Particulate Matter, 3–11. EPA-452/R-10-005. Washington, DC: U.S. Environmental Protection Agency. http://www3.epa.gov/ttn/naaqs/standards/pm/data/PM_RA_FINAL_June_2010.pdf (accessed October 19, 2015).
- U.S. Environmental Protection Agency. 2010c. Summary of results for the 2002 National Scale Assessment. http://www3.epa.gov/airtoxics/nata2005/risksum.html (accessed October 22, 2015).
- U.S. Environmental Protection Agency. 2011a. Summary of results for the 2005 National Scale Assessment. http://www.epa.gov/airtoxics/nata2005/05pdf/sum_results.pdf (accessed October 22, 2015).
- U.S. Environmental Protection Agency. 2011b. 40 CFR Appendix N to Part 50—Interpretation of the National Ambient Air Quality Standards for PM2.5. http://www.gpo.gov/fdsys/pkg/CFR-2011-title40-vol2/pdf/CFR-2011-title40-vol2-part50-appN.pdf (accessed October 22, 2015).
- U.S. Environmental Protection Agency. 2012. Benzene: Hazard Summary. http://www.epa.gov/ttnatw01/hlthef/benzene.html (accessed October 22, 2015).
- U.S. Environmental Protection Agency. 2013a. EPA response to the BP oil spill in the Gulf of Mexico. http://www.epa.gov/bpspill/air.html#historical (accessed October 22, 2015).
- U.S. Environmental Protection Agency. 2013b. Particulate Matter: Basic Information. http://www.epa.gov/airquality/particlepollution/basic.html (accessed October 22, 2015).
- U.S. Environmental Protection Agency. 2014a. National Ambient Air Quality Standards (NAAQS). http://www3.epa.gov/ttn/naaqs/criteria.html (accessed October 22, 2015).
- U.S. Environmental Protection Agency. 2014b. Air Quality Index: A Guide to Air Quality and Your Health. http://www.epa.gov/airnow/aqi_brochure_02_14.pdf (accessed October 22, 2015).
- U.S. Environmental Protection Agency. 2015a. Deepwater Horizon—BP Gulf of Mexico oil spill. http://www2.epa.gov/enforcement/deepwater-horizon-bp-gulf-mexico-oil-spill (accessed October 22, 2015).
- U.S. Environmental Protection Agency. 2015b. Air and Radiation: Basic Information. http://www.epa.gov/air/basic.html (accessed October 22, 2015).
- Wright B.L., and E.A. Nance. 2014. Clearing the Air: An Analysis of Air Emissions from the Deepwater Horizon Oil Spill. A Report to the Environmental Protection Agency. Deep South Center for Environmental Justice, Dillard University.