
ABSTRACT
Noise is a major source of pollution that can affect the human physiology and living environment. According to the World Health Organization (WHO), an exposure for longer than 24 hours to noise levels above 70 dB(A) may damage human hearing sensitivity, induce adverse health effects, and cause anxiety to residents nearby roadways. Pavement type with different roughness is one of the associated sources that may contribute to in-vehicle noise. Most previous studies have focused on the impact of pavement type on the surrounding acoustic environment of roadways, and given little attention to in-vehicle noise levels. This paper explores the impacts of different pavement types on in-vehicle noise levels and the associated adverse health effects. An old concrete pavement and a pavement with a thin asphalt overlay were chosen as the test beds. The in-vehicle noise caused by the asphalt and concrete pavements were measured, as well as the drivers’ corresponding heart rates and reported riding comfort. Results show that the overall in-vehicle sound levels are higher than 70 dB(A) even at midnight. The newly overlaid asphalt pavement reduced in-vehicle noise at a driving speed of 96.5 km/hr by approximately 6 dB(A). Further, on the concrete pavement with higher roughness, driver heart rates were significantly higher than on the asphalt pavement. Drivers reported feeling more comfortable when driving on asphalt than on concrete pavement. Further tests on more drivers with different demographic characteristics, along highways with complicated configurations, and an examination of more factors contributing to in-vehicle noise are recommended, in addition to measuring additional physical symptoms of both drivers and passengers.Implications: While there have been many previous noise-related studies, few have addressed in-vehicle noise. Most studies have focused on the noise that residents have complained about, such as neighborhood traffic noise. As yet, there have been no complaints by drivers that their own in-vehicle noise is too loud. Nevertheless, it is a fact that in-vehicle noise can also result in adverse health effects if it exceeds 85 dB(A). Results of this study show that in-vehicle noise was strongly associated with pavement type and roughness; also, driver heart rate patterns presented statistically significant differences on different types of pavement with different roughness.
Introduction
In today’s modernized society, traffic has become more congested, which has increased air and noise pollution in the human living environment. Many studies have been dedicated to reducing air pollution (Air & Waste Management Association [A&WMA], 2007; Li et al., Citation2015; Qiao et al., Citation2014) and the traffic noise that has been complained about, particularly neighborhood traffic noise. In fact, in addition to traffic-impacted neighborhood residents, drivers are also chronically exposed to traffic noise.
While traffic noise is one of the many environmental background sounds, like that from televisions, radios, and household appliances, many studies have reported that when background sounds are higher than a certain threshold, adverse health effects may occur, including damage to the sensitivity of individual hearing, high blood pressure and hypertension, and increased anxiety levels of residents nearby the roadways (U.S. Federal Highway Administration [FHWA], 1995; Oishi and Schacht, Citation2011). In a study on the harmfulness of noise, Stansfeld et al. found that noise can impair hearing, disturb sleep, lead to cardiovascular and psychophysiological effects, cause psychiatric symptoms, and affect fetal development (Stansfeld et al., Citation2000). With respect to the psychological impacts of noise, individuals may feel annoyed, experience reduced productivity at work, and exhibit increased aggressive behavior (Committee on Environmental Health [CEH], 1997; World Health Organization [WHO], 2001). As a result, the quality of human life has been lowered and traffic noise is considered an environmental pollutant in both metropolitan and rural areas (Christine, Citation2004; Michigan Department of Transportation [MDOT], 2001; Douglas et al., Citation2004).
In a human being’s inner ear, there are 15,000 to 20,00 microscopic sensory receptors in the cochlea, which could easily be damaged by excessive sound exposure (H.E.A.R., Citation2015; Sight & Hearing Association [SHA], 2015). In the United States, 28 million hearing-loss cases were recorded, 80% of which are irreversible and permanent (H.E.A.R., Citation2015). According to the World Health Organization (WHO), the maximum safe noise level for human beings without harmful effects is 70 dB(A) for 24-hr exposure (WHO, 2000). A noise level of 85 dB(A) or higher can cause permanent damage to hearing sensitivity and even induce hearing loss (Noise Induced Hearing Loss [NIHL], 2015). This paper focuses on the degree to which in-vehicle noise contributes to noise pollution for drivers and vehicle passengers, while driving on a freeway. If in-vehicle noise exceeds the maximum safe noise level, drivers could be the primary victims, particularly for commuters enduring longer daily travel time.
Generally speaking, drivers suffer from noises generated by the vehicle itself (vehicle noise) and by ambient traffic (traffic noise). More specifically, in-vehicle noise consists of the noise generated by dynamic traffic flow, aerodynamic noise, tire and pavement interaction noise, and noise generated by the vehicles themselves, such as engine or drive train and exhaust noises. While vehicle manufacturers have applied some strategies to minimize in-vehicle noise, such as the use of a suspension front fork and frame, better auto glass, and improved exhaust systems, minimizing tire and pavement interface noise may also be an effective way to mitigate in-vehicle noise for drivers. Some studies have demonstrated that tire and pavement interface noise is the subsource of dominant noise at speeds above 48 km/hr (Hibbs and Larson, Citation1996; Sandberg, 1979; Sandberg, Citation2002; Crocker, Citation2007). Applying more anechoic materials in highway pavement may be one option for effectively minimizing interface noise.
There are two main types of pavement materials: concrete and asphalt. Asphalt pavement is more skid resistant, more economical for building up the roadway, and easier to maintain than concrete pavement. On the other hand, concrete pavement is cheaper, lasts longer, and is more resistant to automobile fuel spillage and extreme weather. There are several pavements widely used for highway construction, including jointed plain concrete pavement (JPCP), continuously reinforced concrete pavement (CRCP), asphalt pavement (AP), and diamond-grinding pavement. CRCP has the potential to provide long-term, “zero-maintenance” service life under heavy traffic loadings and in challenging environmental conditions (U.S. Department of Transportation [DOT], 2012). The JPCP uses dowels (load transfer devices) across the joints of a series of contiguous concrete slabs, so that movement and deformation of the pavement can be tolerated (U.S. DOT, 2009). AP is a pavement whereby asphalt is applied on top of concrete pavement, which can significantly reduce noise on highways and even inside nearby homes and businesses (Asphalt Pavement Alliance, Citation2015). Diamond-grinding pavement is a concrete pavement that is an excellent choice for surface restoration, including roughness repair, increasing friction, and reducing tire/pavement noise (SR904P, Citation2001). The diamond grinding technique can complement a variety of the imperfections found in both concrete and asphalt pavements (Rao et al., Citation1999).
Pavement abrasions from vehicle movement may lead to as much as a 9-dB(A) variance in a single pavement type. Even so, there could be up to a 14-dB(A) difference between pavement types (Bernhard and Wayson, 2004). A stone matrix asphalt (SMA) or open-graded friction course (OGFC) mix can reduce highway noise by 3 to 5 dB, which is equivalent to doubling the distance between the source of the noise and an individual’s location (Asphalt Pavement Alliance, Citation2015).
Traffic noise has a great impact on the health and surrounding living environment of residents nearby highways. Significant improvement of public health can be achieved by reducing environmental noise levels (Hammer et al., Citation2014). Babisch confirmed the harmfulness of noise to public health, and suggested an environmental and health policy to improve acceptable noise standards that would take into account subjective well-being and somatic health (Babish, Citation2005).
While the analysis of noise impacts on the surrounding environment and human health is very important, less attention has been focused on the impacts of different pavement types on in-vehicle noise, which most people are exposed to either as a driver or as passenger.
The objective of this research is to explore the impacts of pavement types on in-vehicle noise levels and driver health in an on-road driving test. Driver heart rates while driving were selected as a health indicator, since the heart rate can indicate relative health, whether there is a risk of heart attack by those with a strong or weak heart, how much energy is consumed, and metabolic efficiency (Teller, Citation2010). We chose an old concrete pavement and a new thin asphalt overlay pavement as test beds for the study. In addition to measuring the in-vehicle noise caused by the asphalt and concrete pavements, driver heart rates and perceived riding comfort attributed to in-vehicle noise were investigated as well.
Methodology and data collection
Methodology
In an on-road test, the in-vehicle noise levels were measured when driving along different types of pavements with different roughness. Information regarding the pavement, in-vehicle noises, vehicle activity, and associated human physiological changes (e.g., the heart rate) was recorded and further analyzed in a systematic comparison of the recorded data sets. Levels of statistical significance for the differences were determined by t-test.
Test plan
In the test, drivers traveled 9 miles along the US-59 freeway in Houston, TX. Each driving test took between 20 and 30 min. The test route was undergoing maintenance work involving the overlay of a new seal coat and thin asphalt over the old concrete. In , old concrete pavement is on the path between point A and the exit for Bissonnet Street, and a new layer of asphalt is just overlaid on the path between the exit for Bissonnet Street and point B. Two test vehicles were driven along two routes: route 1 (from point A to point B) and route 2 (from point B to point A). The test data were recorded using in-vehicle equipment.
Figure 1. Test routes along freeway US-59 in the Houston metropolitan area.
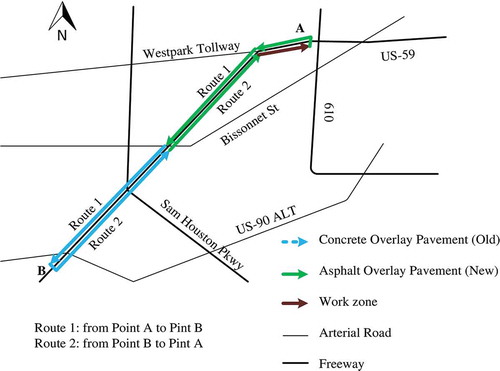
On the asphalt surfaces, there were several small concrete intervals (each 139.62 ± 82.08 m long) that were bare of any asphalt, as illustrated in . These concrete intervals separated and bridged large asphalt pavement segments. As a result, there was a slight vibration effect while crossing between the two pavements. In total, there were 9 and 8 concrete intervals along route 1 and route 2, respectively.
Figure 2. Configuration of test pavements.
Participants
Due to the variations in normal heart rates in individuals of different ages and gender, two drivers from different age groups and genders were recruited for this test. One was a male, age 50 years, and the other was a female, age 35 years. Both were experienced drivers, with more than 3 years of driving experience. According to the American Heart Association (AHA, 2015), an individual’s normal heart rate ranges from 60 to 100 bpm, and the target heart rate zone is within 50% to 85% of the individual’s maximum heart rate. For individuals 50 and 35 years old, a heart rate zone of 85–145 bpm and 93–157 bpm is expected, respectively.
Equipment
The equipment used in the on-road test includes:
An adaptor for the vehicle’s On-Board Diagnostic (OBD) II System connected by cable to a carry-on laptop, to provide real-time engine data, such as speed, acceleration rate, and engine rpm.
A digital sound-level meter that measures sound in a range between either 30 and 130 dB(A) or 35 and 130 dB(C), with an accuracy of + 1.5 dB. The frequency ranged from 31.5 Hz to 8.5 KHz. The sample rate was 2 times per second.
A global positioning system (GPS) device to record the geo-location, including longitude, altitude, and latitude, at a sampling rate of 10 Hz.
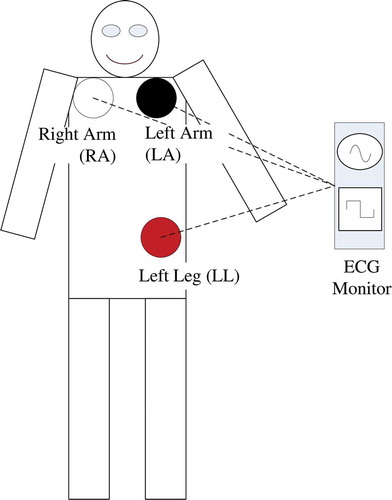
A handheld electrocardiogram (ECG) monitor with associated cables connected to three electrode leads attached to the body of the tested subject, to measure real-time heart rates.
An Android-based smartphone application to measure real-time roughness indexes of the roadway with good correspondence to the inertial profiler, and with good repeatability between measurements (Islam. et al., Citation2014).
A 1-year-old 4-door sedan vehicle (about 7,000 mileage), with 132-hp at 6,000 rpm and 1.8-L engine.
A technician was riding in the passenger seat and operating the above equipment, while the three electrodes of the ECG monitor were connected to the driver’s body at the positions illustrated in . The three locations are labeled as right arm (RA), left arm (LA), and left leg (LL). The American Heart Association recommended these limb electrodes, and the limb electrodes on the left and right limbs should be even, as directed (Macfarlane and Coleman, Citation2014).
Figure 3. Proper placement of three limb electrodes on a driver’s body.
Data collection
The test was conducted over the midnight hours of a weekday, between 10 p.m. and 2 a.m., in February 2015, when the traffic was in free-flow mode for most of the freeway segments, except for a short period in a work zone at the end portion of route 2. In the free-flow situations, the vehicle speeds could be easily maintained at around the speed limit of 96.56 km/hr (60 mph), and ambient noise from traffic was minimal. When driving through the work zone region, however, the vehicle speeds were necessarily reduced.
During the test, the recorded information includes vehicle activity data, in-vehicle sound levels, driver heart rates, roughness of the pavement, and geo-location. Each recorded variable was associated with the time indicated by the testing equipment.
Data processing
Recorded data were synchronized to remove system differences among all devices used. Due to the differences in sampling intervals of the different data sets over time, all recorded data were first interpolated into second-by-second data. Then, according to the GPS information that contained correlated time and space information, all recorded data sets were further interpolated into meter-by-meter data sets, so as to easily relate all data points and to conduct statistical analyses.
The impacts of in-vehicle sound levels from the pavement were measured by comparing in-vehicle sound levels with respect to each of the following three variables: (1) speed profile, (2) driver heart rate, and (3) roughness index.
Results and discussion
In-vehicle sound levels and speed profile
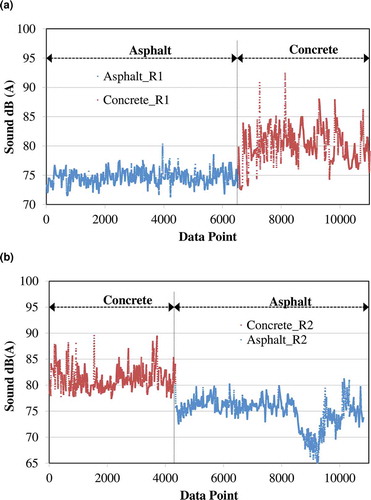
shows the impact of different pavement types on in-vehicle sound levels (left vertical axis), as they correspond to the speed profile (the first curve from the bottom on right vertical axis) along the two test routes. The second curve from the bottom of both and , is divided into two parts, indicating the sound levels for new pavement with an asphalt overlay and old concrete pavement, respectively. In , there is a small portion on the right representing the sound levels in the work zone region, where the pavement was also overlaid by asphalt.
Figure 4. (a) In-vehicle sound and speed profiles on test route 1. (b) In-vehicle sound and speed profiles on test route 2.
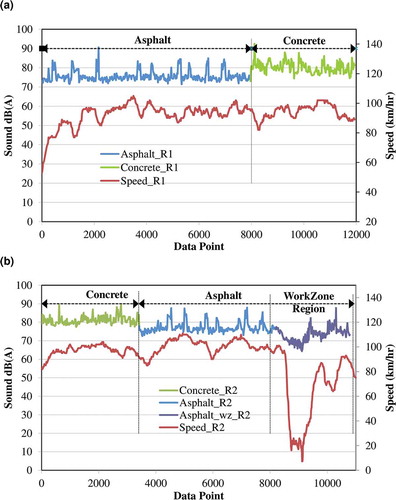
At first glance, except for a few data points in the work zone region, the overall in-vehicle sound levels were above 70 dB(A), which is the maximum safe sound level. The in-vehicle sound levels while driving on asphalt pavement were obviously lower than those for concrete pavement, by approximately 6 dB(A) on the two test routes. Some peaks occur on asphalt pavement, which can be explained by the small segments of concrete between the asphalt pavement segments. Apart from the concrete material, a vibration effect may be caused by the transit between the two pavement types, which may have resulted in a significant peak.
also illustrates that the in-vehicle sound levels dropped dramatically while driving through the work zone. Within the work zone, the vehicle speed of both drivers was approximately 66.69 ± 27.10 km/hr. These vehicle speeds were lower than the 95.56-km/hr speed limits on the test routes. It is likely that driving speeds may also influence in-vehicle sound levels; however, this observation was not reflected in the other segments of the two test routes. In fact, the sound that a test driver senses may come from many different sources, including wind, ambient traffic, bridge vibration, and noise from the vehicle itself. On the other route segments, the ambient sound sources from traffic can readily offset the slight difference in the in-vehicle sound levels caused by the test vehicle’s driving speed. In the work zone, while the variable of ambient sound sources was still present, all vehicles drove slowly. As such, the ambient sound levels due to vehicle speed dropped greatly.
To gain insight into the differences between asphalt and concrete pavements, the sound levels pertaining to the concrete intervals between the asphalt segments were moved to the calculation of sound levels for concrete pavement, resulting in the plot shown in . On average, the filtered in-vehicle sounds were 74.67 ± 1.13 dB(A) and 74.93 ± 2.66 dB(A) for the asphalt pavement along routes 1 and 2, respectively. On the concrete pavement, the in-vehicle sound levels increased to 80.09 ± 2.73 dB(A) and 81.27 ± 2.01dB(A) for routes 1 and 2, respectively. Note that most of the in-vehicle sounds exceed the maximum safe noise level of 70 dB(A). Only within the work zone (starting at about the 9,000 data point in ) were the in-vehicle sound levels lower than 70 dB(A) for a limited period of time. Regarding the higher in-vehicle sound levels, a long driving journey under such a situation may be harmful to driver health. Furthermore, based on the present in-vehicle noise measured at midnight, much higher in-vehicle noise levels can be predicted for daytime traveling, when traffic is much more congested.
Figure 5. (a) In-vehicle sound levels and heart rates on test route 1. (b) In-vehicle sound levels and heart rates on test route 2.
Further, there were statistically significant differences between these two test routes in the in-vehicle sound levels while driving on concrete and asphalt (p-value route 1 = 0.00E+00; p-value route 2 = 3.74E-51).
In-vehicle noise and roughness
Simply classifying pavement types into concrete and asphalt may not be sufficient to identify the impact of the pavement material on in-vehicle sounds. Roughness is also a major factor that induces tire and pavement interface noise in varied types of pavement. Accordingly, real-time roughness was measured to determine the impact of pavement on in-vehicle sound levels. An extensive International Roughness Index (eIRI) was adopted in this study, taken from a cellphone application. displays the eIRI profile in dashed lines during the two test routes, along with the in-vehicle sound levels in the solid lines. In , the asphalt was paved over a travel distance of 0 to about 8,000 m, while the rest of the road was paved with concrete. In , a travel distance from 0 to about 3,800 m was paved with concrete, while the rest was asphalt.
Figure 6. (a) In-vehicle sound levels and eIRI on test route 1. (b) In-vehicle sound levels and eIRI on test route 2.
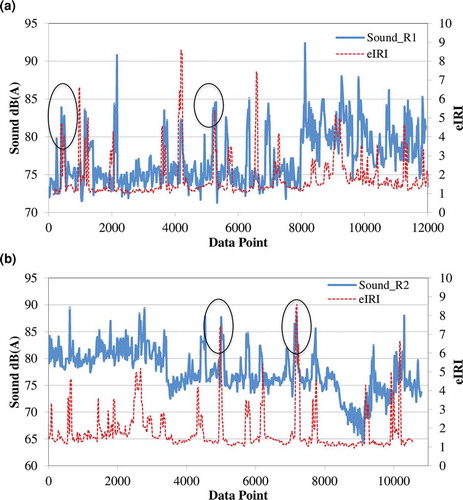
Like the in-vehicle sound profiles in , there are some peaks in roughness shown in for the two test routes, corresponding to asphalt pavement segments and the concrete interval. Meanwhile, the peaks of the in-vehicle sound levels and eIRI match each other perfectly in the profiles. Some of these matches are highlighted in the black circles. Further, the in-vehicle sound level was relatively correlated to the eIRI (R = 0.57). This observation further validates that pavement layout leads to sharp increases in in-vehicle sound levels, rather than the presence of asphalt pavement alone.
When the roughness measured for the concrete intervals was moved to the concrete pavement calculations, the overall roughness of the asphalt pavement was noticeably lower than that for concrete pavement. Specifically, the eIRI values for the asphalt were 1.25 ± 1.33 (m/km) and 1.25 ± 0.13 (m/km) for routes 1 and 2, respectively, which were less than 1.5 m/km, a threshold for a good category whereby drivers might experience a comfortable ride (Minnesota Department of Transportation [MnDOT], 2007). However, on the concrete pavement, the eIRI increased to 2.42 ± 0.15 (m/km) and 2.07 ± 1.14 (m/km) for routes 1 and 2, respectively, which nearly exceeded the 2.7-m/km threshold for acceptability (MnDOT, Citation2007). In other words, while on concrete pavement, drivers drove less comfortably, although the situation was still acceptable.
Pavement and heart rate
There is a real concern that increased in-vehicle sound levels may affect driver health. The heart rate is one indicator of health, showing drivers’ instant neurological response, whether stress or relaxation, and their physical status, such as a strong heartbeat or a risk of heart attack. Based on previous studies concluding that noise may induce adverse health effects, we chose to investigate the effect of in-vehicle noise on driver heart-rate patterns, and whether there is a significant difference in driver heart rates when driving on the two pavement types. shows the distribution of driver heart rates while driving on concrete and asphalt pavements during the test. The heart rates measured during the concrete intervals were included in the asphalt category.
Figure 7. (a) Heart rate distribution of the male driver. (b) Heart rate distribution of the female driver.
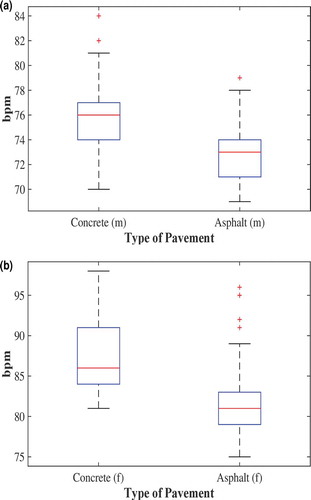
shows that male and female drivers’ heart rates were lower when driving on asphalt pavement. On the concrete pavement in , the male driver’s heart rate ranged from 70 bpm to 81 bpm. For 75% of the driving period, his heart rates were 74 bpm and above, while for 25% of the time, it was 77 bpm and above. The male driver’s highest heart rate was about 81 bpm, which is lower than 85 bpm, 50% of his maximum heart rate. Some recorded samples that reached nearly 85 bpm were classified as outliers. On the asphalt pavement, the male driver’s heart rates declined noticeably to 71 bpm and above for 75% of the driving period and 74 bpm and above for the remaining 25%. His highest heart rate on asphalt pavement was just 78 bpm.
The female driver’s highest heart rate on concrete pavement, as shown in , was about 98 bpm, and the lowest was 82 bpm, which were within her heart rate zone (93–157 bpm). When the pavement changed to asphalt, her heart rate decreased significantly to about 78 bpm and above for 75% of the driving period, and 84 bpm and above for the remaining 25%. Some outliers reached 96 bpm. Based on observations during the driving tests, the outliers may be due to the time stress when making decisions while driving, such as decisions regarding lane changes, overtaking, or exiting the highway.
Based on these results, it was found that the two drivers’ heart rates were within their individual normal heart rate zones. However, it seems that driving on concrete pavement may induce an increase in heart rates. Stress may be responsible for this difference in heart rate for the two pavement types. After the test, the two drivers reported the same opinion that they were more comfortable driving on asphalt pavement. The increased stress may be due to issues in controlling the vehicle, or the intense attention required while driving on the harsher concrete pavement in relatively higher in-vehicle noise levels. If such stress occurs chronically, serious physical and psychological health effects may take place, due to the sustained high levels of chemicals released in the “fight or flight” response. Over the long term, drivers may have a higher risk of cardiovascular disease (Collingwood, Citation2013).
illustrates the statistical significance of differences in the driver heart rates for the two pavement types. As shown in , the male driver’s heart was 76.11 bpm on average while driving on concrete pavement. When the pavement changed to asphalt, his heart rate decreased to 73.44 bpm. The variances in his heart rates on the two pavements were similar: 11.91 for concrete and 13.22 for asphalt. Moreover, the heart rate pattern for concrete pavement was only slightly correlated to that for asphalt, R= 0.11. The heart rate on the concrete pavement was significantly higher than on the asphalt pavement, with p = 1.43E-04.
Table 1. t-Test results for the comparison of heart rates while driving on asphalt and concrete pavement.
Likewise, the female driver’s heart rate on concrete pavement was significantly higher than that on the asphalt pavement, with p = 8.43E-06. Her heart rate patterns on the two pavements were even less correlated, R = 0.06, than those of the male driver. Further, the variances of her heart rates were similar for the two pavements.
Conclusions
In this paper, an on-road test was conducted to measure the differences in in-vehicle sound levels while driving along a freeway constructed with asphalt and concrete pavements in the Greater Houston Area. What were studied included the drivers’ speed profiles, real-time in-vehicle sound levels, roughness of the two pavement types, and real-time heart rates in relation to pavement type.
Our results show that the overall in-vehicle sound levels are above 70 dB(A) on US-59 at midnight. An average of 75 dB(A) was measured on the asphalt segment, while 81 dB(A) was recorded on the concrete segment. An overlay of asphalt pavement on the highway reduced the in-vehicle noise at a driving speed of 96.56 km/hr, by approximately 6 dB(A). The difference in the in-vehicle sound levels was statistically significant (p-value route 1 = 0.00E+00; p-value route 2 = 3.74E-51).
Moreover, the eIRI of the asphalt pavement was less than 1.5 m/km, well within the good category, whereas the eIRI for the concrete pavement nearly exceeded the 2.7-m/km threshold of the acceptable category. The difference in roughness may be responsible for the significant difference in the in-vehicle sound levels.
In terms of heart rate, both (male and female) drivers’ rates were significantly lower while driving on asphalt pavement. Compared to driving on concrete pavement, drivers also reported feeling more comfortable when driving on asphalt. The higher heart rates when driving on concrete pavement may be attributed to the stress associated with controlling the vehicle, and the intense attention required while driving on a harsher pavement with higher in-vehicle noise.
Further tests are recommended to identify the specific contributors to the increase in heart rate and the possible adverse health consequences. Parameters to consider include drivers ranging in demographic diversity, health status, and real-time physical symptoms on highways, as well as factors associated with in-vehicle noise, spectral noise, and complicated highway traffic situations.
Funding
The authors acknowledge the partial support for this research provided by the United States Tier 1 University Transportation Center TranLIVE number DTRT12GUTC17/ KLK900-SB-003, and the National Science Foundation (NSF) under grant 1137732. The opinions, findings, conclusions, and recommendations expressed in this material are those of the author(s) and do not necessarily reflect the views of the funding agencies.
ORCID
Qing Li

Fengxiang Qiao

Lei Yu

Additional information
Funding
Notes on contributors
Qing Li
Qing Li is a Ph.D. candidate majoring in Environmental Toxicology at Texas Southern University.
Fengxiang Qiao
Fengxiang Qiao is an associate professor and co-director of Innovative Transportation Research Institute (ITRI) at Texas Southern University (TSU).
Lei Yu
Lei Yu is a professor in the Department Transportation and Dean of College of Science, Engineering, and Technology at Texas Southern University (TSU).
References
- Air & Waste Management Association. 2007. Fact sheet: Air pollution emission control devices for stationary sources. http://events.awma.org/files_original/ControlDevicesFactSheet07.pdf (accessed October 22, 2015).
- American Heart Association. 2015. Target heart rates. http://www.heart.org/HEARTORG/GettingHealthy/PhysicalActivity/FitnessBasics/Target-Heart-Rates_UCM_434341_Article.jsp#.ViMgsNbYnTs. (accessed October 17, 2015).
- Asphalt Pavement Alliance. 2015. Asphalt Pavement Alliance quiet pavement. http://www.asphaltroads.org/why-asphalt/environment/quiet-pavement (accessed February 2015).
- Babish, W. 2005. Noise and health. J. Environ. Health Perspect. 113(1):A14–A15. http://www.ncbi.nlm.nih.gov/pmc/articles/PMC1253720/ (accessed November 2015).
- Bernhard, R., and R.L. Wayson. 20105. An introduction to tire/pavement noise of asphalt pavement. http://www.asphaltroads.org/assets/_control/content/files/anintroductiontotire-pavementnoiseofasphaltpavement.pdf (accessed February 2015).
- Christine, M. 2004. Romney orders noise buffer meeting. The Boston Globe, June 27. http://www.boston.com/news/local/articles/2004/06/27/romney_orders_meeting_on_noise_buffers/ (accessed November 2015).
- Collingwood, J. 2013. The physical effects of long-term stress. PsychCentral. http://psychcentral.com/lib/the-physical-effects-of-long-term-stress (accessed October 19, 2015).
- Committee on Environmental Health. 1997. Noise: A hazard for the fetus and newborn. Pediatrics 100:724–27. doi:10.1542/peds.100.4.724
- Crocker, M., J. 2007. Handbook of Noise and Vibration Control. Hoboken, NJ: John Wiley & Sons.
- Douglas, I.H., S.J. Robert, and N. Christopher. 2004. Tire/pavement noise study. National Center for Asphalt Technology, Auburn University, Auburn, AL. NCAT report 04–03.
- H.E.A.R. 2015. About hearing loss. http://www.hearnet.com/at_risk/risk_aboutloss.shtml (accessed October 22, 2015).
- Hammer, M.S., T.K. Swinburn, and R.L. Neitzel. 2014. Environmental noise pollution in the United States: Developing an effective public health response. J. Environ. Health Perspect. 122(2):115–119. doi:10.1289/ehp.1307272
- Hibbs, B.O., and R.M. Larson. 1996. Tire pavement noise and safety performance. Federal Highway Administration (FHWA), final report, FHW A-SA-96-068, May. https://www.fhwa.dot.gov/legsregs/directives/policy/sa_96_06.htm (accessed November 2015).
- Islam, S., W. Buttlar, R. Aldunate, and W. Vavrik. 2014. Measurement of pavement roughness using Android-based smartphone application. J. Transport. Res. Board. doi:10.3141/2457-04.
- Li, Q., F. Qiao, and L. Yu. 2015. Will vehicle and roadside communications reduce emitted air pollution?. Int. J. Sci. Tech. 5(1):17–23.
- Macfarlane, P.W., and E.N. Coleman. 2014. Resting 12-lead ECG electrode placement and associated problems. http://www.drtanzil.com/resetting-12-lead-electrocardiography-accociated-problems (accessed February 2015).
- Michigan Department of Transportation. 2015. MDOT reports success of I-275 project to State Transportation Commission. http://www.Michigan gov/minewswire/0,1607,7-136-3452-70697—M_2001_11,00.html (accessed February 2015).
- Minnesota Department of Transportation, 2007. Introduction to the international roughness index (IRI). Bituminous Smoothness Training Workshop. http://www.dot.state.mn.us/materials smoothnessdocs/IRIIntroduction.pdf (accessed February 2015).
- Noise Induced Hearing Loss. 2015. Dangerous decibels focuses on noise-induced hearing loss. http://www.dangerousdecibels.org/education/information-center/noise-induced-hearing-loss ( accessed on February, 2015).
- Oishi, N., and J. Schacht. 2011. Emerging treatments for noise-induced hearing loss. Expert Opin. Emerging Drugs 16(2):235–45. doi:10.1517/14728214.2011.552427. PMC 3102156. PMID 21247358.
- Qiao, F., J. Jia, L. Yu, Q. Li, and D. Zhai. 2014. Drivers’ Smart Assistance System Based on Radio Frequency Identification. Transportation Research Record: Journal of Transportation Research Board, No. 2458, Washington, DC: Transportation Research Board of the National Academies, pp. 37–46.
- Rao, S., H.T. Yu, and M.I. Darter. 1999. The longevity and performance of diamond-ground pavements (PDF). Research and Development Bulletin. Portland Cement Association. RD118. https://www.csuchico.edu/cp2c/documents/Library/dg25.pdf ( accessed September 30, 2015).
- Sandberg, U., and J. A. Ejsmont. 2002. Tyre/Road Noise Reference Book. Kisa, Sweden: Informex.
- Sight & Hearing Association. 2015. Noise-induced hearing loss. http://www.sightandhearing.org/soundcenter/nihl.asp (accessed October 22, 2015).
- SR904P. 2001. Special report, Concrete pavement technology & research. https://www.csuchico.edu/cp2c/documents/Library/dg19.pdf (accessed October 2015).
- Stansfeld, S., M. Haines, and B. Brown. 2000. Noise and health in the urban environment. Rev. Environ Health 15(1–2): 43–82. doi:10.1515/REVEH.2000.15.1-2.43
- Teller, R. 2010. Resting heart rate as a measure of health, fitness and lifespan. http://www.1vigor.com/article/resting-heart-rate-health-measurement (accessed October 17, 2015).
- U.S. Department of Transportation. 2009. Design and evaluation of jointed plain concrete pavement with fiber reinforced polymer dowels. Publication o. FHWA-HRT-06-106. September. http://www.fhwa.dot.gov/publications/research/infrastructure/pavements/06106/06106.pdf (accessed February 2015).
- U.S. Department of Transportation. 2012. Advanced concrete pavement technology (ACPT) products program. September. FHWA-HIF-12-039. http://www.fhwa.dot.gov/pavement/concrete/pubs/hif12039/hif12039.pdf (accessed February 2015).
- U.S. Federal Highway Administration. 1995. Highway traffic noise analysis and abatement policy and guidance. Washington, DC: FHWA Administration Office of Environment and Planning Noise and Air Quality Branch, June.
- World Health Organization. 2000. Guidelines for community noise. http://www.who.int/docstore/peh/noise/guidelines2.html (accessed February 2015).
- World Health Organization. 2001. Occupational and community noise. Fact sheet number 258. Geneva, Switzerland: World Health Organization. http://www.who.int/inf-fs/en/fact258.html (accessed February 20, 2015).