
ABSTRACT
Satellite imaging has emerged as a method for monitoring regional air pollution and detecting areas of high dust concentrations. Unlike ground observations, continuous data monitoring is available with global coverage of terrestrial and atmospheric components. In this study we test the utility of different sources of satellite data to assess air pollution concentrations in Iraq. SeaWiFS and MODIS Deep Blue (DB) aerosol optical depth (AOD) products were evaluated and used to characterize the spatial and temporal pollution levels from the late 1990s through 2010. The AOD and Ångström exponent (an indicator of particle size, since smaller Ångström exponent values reflect a source that includes larger particles) were correlated on 50 × 50 km spatial resolution. Generally, AOD and Ångström exponent were inversely correlated, suggesting a significant contribution of coarse particles from dust storms to AOD maxima. Although the majority of grid cells exhibited this trend, a weaker relationship in other locations suggested an additional contribution of fine particles from anthropogenic sources. Tropospheric NO2 densities from the OMI satellite were elevated over cities, also consistent with a contribution from anthropogenic sources. Our analysis demonstrates the use of satellite imaging data to estimate relative pollution levels and source contributions in areas of the world where direct measurements are not available.
Implications: The authors demonstrated how satellite data can be used to characterize exposures to dust and to anthropogenic pollution for future health related studies. This approach is of a great potential to investigate the associations between subject-specific exposures to different pollution sources and their health effects in inaccessible regions and areas where ground monitoring is unavailable.
Introduction
The Lower Mesopotamia is considered to be one of the world’s largest dust “hot spots,” as frequent storms in this region result in high concentrations of atmospheric mineral dust, (Prospero et al., Citation2002; Kutiel and Furman Citation2003; Ginoux et al., Citation2012). This region represents the second largest planetary dust source after the Sahara desert, and Iraq is the country with the highest number of dust storms (Ginoux 2012; Prospero et al., Citation2002; Washington et al., Citation2003). Depending on location in Iraq, there can be up to 122 sand and dust storms each year (Sissakian et al., Citation2013). Deserts cover over 40% of Iraq’s area (Malinowski Citation2003), and combined climate conditions, wind patterns, surface properties, topography, and human intervention contribute to the intense dust production. Dust-storm-related activity in the Tigris and Euphrates basin begins in May, reaches a maximum in July, and generally subsides by September–November (Middleton Citation1986; Al-Dabbas et al., Citation2012; Prospero et al., Citation2002). The following factors influence dust/sand storms dynamics in this region: (1) extremely hot summers and low precipitation, (2) natural funneling of large air masses by the high mountains in Turkey and Iran combined with the high plateaus in Saudi Arabia, across the Mediterranean into the Persian Gulf (Sissakian et al., Citation2013), (3) strong, sustained, periodic and seasonal winds (e.g., shamal and the sharki) generating sandstorms lasting hours to days that result in suspension and subsequent transport of dust throughout the country, (4) ineffective irrigation that perpetuates drought conditions, and (5) poor water management strategies, including excess drainage of soils along the Tigris and Euphrates.
There is emerging evidence that exposure to atmospheric mineral dust during the storms is associated with acute adverse health effects (Goudie Citation2014). In parts of the world accessible to ground monitoring of exposure, dust concentrations on storm days have been associated with increases in daily mortality rates and hospital admissions attributable to cardiovascular and respiratory causes (Chan et al., Citation2008; Chan and Ng, Citation2011; Cheng et al., Citation2008; Chiu et al., Citation2008; Merrifield et al., Citation2013; Middleton et al., Citation2008; Neophytou et al., Citation2013; Perez et al., Citation2008; Perez et al., Citation2012; Tam et al., Citation2012a; Tam et al., Citation2012b). Iraq, where U.S. and other military forces have been stationed over the past decade, is one such region of concern, and there is suggestive evidence that troops stationed in Iraq experienced more postdeployment respiratory symptoms consistent with asthma (Sanders et al., Citation2005; Roop et al., Citation2007; B. Smith et al., Citation2009; Szema et al., Citation2010) and postdeployment respiratory symptoms and medical encounters (T.C. Smith et al., Citation2009; Abraham et al., Citation2012). Efforts to assess exposures to particles for health effects studies have been hindered due to the lack of monitoring data. Attempts to assess exposure quantitatively in order to reconstruct particulate matter concentrations in Iraq have been limited (National Research Council, Citation2010).
Satellite imagery of the earth surface and atmosphere provides an important tool to air quality and pollution monitoring due to its extensive spatiotemporal monitoring of the earth surface and atmosphere. The most common parameter derived from satellite observations is the aerosol optical depth (AOD), which is a measure of the extinction of electromagnetic radiation at a given wavelength due to the presence of aerosols in an atmospheric column. An additional parameter that describes the dependence of the AOD on wavelength is the Ångström exponent (α), which is inversely related to the average size of atmospheric particles. The combined use of the AOD and α provides an approach to distinguish between different aerosol sizes (e.g., Eck et al., Citation1999; Citation2005; Reid et al., Citation1999; Holben et al., 2001; Dubovik et al., Citation2002). Values of α above 1.0 are indicative of size distributions dominated by fine particles, while 0 < α < 0.8 tends to be dominated by large particles Eck et al., Citation1999; Citation2005).
Generally, it is challenging to retrieve AOD and α above areas with high surface reflectance, such as deserts. This is because the upwelling radiance due to scattering by atmospheric aerosols and particles is small compared to the radiance resulting from surface reflection. The radiance attributable to surface reflection influences the relationship between AOD and particle concentrations (Kaufman, Tanré, et al., Citation1997; Kokhanovsky and de Leeuw, Citation2009). Therefore, in many highly populated regions worldwide (e.g., western United States, the Middle East, central Asia, etc.), AOD attribution to particulate concentrations is still uncertain because of the high ground reflectance. However, with the release of the “Deep Blue” (DB) product, which is based on data from the 412-, 470-, and 670-nm spectral channels, it has become possible to study spatial and temporal variability of transported dust/pollution over deserts, since bright surfaces show low reflectivity in the blue spectral region (Hsu et al., Citation2012; Hsu et al., Citation2013). These data are available from the Sea-viewing Wide Field-of-view Sensor (SeaWiFS) (in operation from September 1997 to December 2010) and Moderate Resolution Imaging Spectroradiometer (MODIS) (2000–current) that employ the DB algorithm (Hsu et al., Citation2004; Hsu et al., Citation2006).
To study possible locations of industrial sources, ozone monitoring instrument (OMI) NO2 vertical column density data was incorporated. Therefore, this study used SeaWiFS DB AOD data and α with combined AOD and NO2 data to investigate spatiotemporal patterns in regional aerosol loading over Iraq during a 13-yr period (1997–2010) that includes Operation Iraqi Freedom and Operation New Dawn.
Material and methods
To test the utility of satellite data to assess various metrics of pollution in Iraq, several data sources were downloaded and analyzed. To characterize and interpret our results, the 2009 land cover types for Iraq (MCD12Q1: MODIS Land Cover Product) was downloaded at spatial resolution of 500 m. The primary land cover scheme identifies 17 land cover classes defined by the International Geosphere Biosphere Programme (IGBP), which includes 11 natural vegetation classes, 3 developed and mosaicked land classes, and 3 nonvegetated land classes (Friedle et al., Citation2010); Next, AOD and Ångstrőm exponent (from MODIS Aqua and SeaWiFS satellites) data were mapped and correlated on a grid basis. Finally, NO2 vertical column density data (from OMI) were mapped and spatially compared.
Satellite data: AOD and Ångström exponent
We used SeaWiFS DB AOD and Ångström exponent at 0.5° by 0.5° (~50 km) spatial resolution available from 1997 through 2010 and MODIS DB AOD at 1° by 1° (~111 km) available from 2002 through 2010 to assess the temporal and spatial variability of dust concentrations over Iraq.
SeaWiFS
This aerosol retrieval system utilizes a combination of the DB algorithm over land (Hsu et al., Citation2004, Citation2006) and the SeaWiFS Ocean Aerosol Retrieval (SOAR) algorithm over ocean (Sayer et al., Citation2012). The latest algorithm retrieves aerosol data over both bright desert surfaces and surfaces with vegetation. Level 3 (gridded) products are available for daily and monthly averages at both 0.5º × 0.5º and 1º × 1º resolutions. Initially, the DB algorithm is applied to cloud-cleared SeaWiFS reflectance to retrieve AOD at full instrumental resolution, which is approximately 4.5 km × 4.5 km at the subsatellite point. The correlation coefficient between SeaWiFS AOD and ground-based located AERONET AOD values for North Africa/Middle East region was found to be 0.73–0.82 (Sayer et al., Citation2012).
The dependency of AOD on wavelength is mainly driven by the scattering efficiency and can be expressed by means of the classical Ångström’s equation (AOD(λ) ~ λα) (Ångstrőm, Citation1929). In the solar spectrum, α reflects the overall size of atmospheric particles. Both parameters can be used to distinguish different aerosol sizes (e.g., Eck et al., Citation1999; Citation2005; Reid et al., Citation1999; Holben et al., 2001; Dubovik et al., Citation2002).
MODIS
MODIS Collection 5.1 AOD DB data from the Aqua platform at the spatial resolution of 1° × 1°collected during 2002–2010 were downloaded. AOD products are derived operationally from spectral radiances measured by MODIS using seven spectral channels across the wavelength region 470–2130 nm (Remer et al., Citation2005). Additional wavelengths in other parts of the spectrum are used to identify and mask out clouds, snow, and suspended river sediments (Ackerman et al., Citation1998; Gao et. al., Citation2002; Martins et al., Citation2002). Aerosol properties are derived from the inversion of MODIS-observed reflectances using precomputed radiative transfer look-up tables based on dynamical aerosol models (Kaufman et al., Citation1997; Remer et al., Citation2005). More details about the MODIS AOD retrieval are reported in Remer et al. (Citation2005) and Levy et al. (Citation2007, Citation2010).
SeaWiFS and MODIS AOD values and α were acquired using the GES-DISC Interactive Online Visualization and analysis Infrastructure (GIOVANNI) developed by the National Aeronautics and Space Administration (NASA) Goddard Earth Sciences (GES) Data and Information Services Center (DISC).
Association between AOD and α
For the characterization of dust pollution temporal trends in in Iraq, the AOD SeaWiFS data were presented alongside the MODIS-derived AOD data. Using SeaWiFS data we calculated monthly AOD (at 550 nm) and α averages for all grids lying inside Iraq for 1997–2010 at a spatial resolution of 0.5° × 0.5°. Similarly, we calculated monthly AOD and α averages using MODIS Aqua in Iraq for 2002–2013 at the 1° × 1° spatial resolution.
Our next grid-based analyses were restricted to SeaWiFS data only. To assess seasonal spatial variability in AOD we calculated seasonal AOD averages during the period of September 1997 to December 2010 at the resolution of 0.5° × 0.5°. For these determinations, spring was defined as March–April–May, summer was defined as June–July–August, fall was defined as September–October–November, and winter as December–January–February.
We also calculated the Pearson correlation coefficient between AOD and angstrom exponent per grid for each season and the entire time period 1997–2010. Desert aerosols were characterized by high AOD values and low α values, resulting from an abundance of large particles (Longtin et al., Citation1988; D’Almeida et al., Citation1991).
OMI NO2
To characterize possible pollution sources, as well as to identify areas of different associations between AOD and α, additional data sets were implemented for analyses.
Ozone Monitoring Instrument (OMI) NO2 vertical column density data were obtained from the NASA Earth Observing System (EOS) Aura satellite in Iraq for 2005–2009. OMI aboard the Aura satellite provides column NO2 information (in units of molecules/cm2) at a nominal resolution of 13 × 24 km (at nadir) on a global scale. Daily NO2 data with cloud radiance fraction less than 30% were downloaded from Giovanni online data system, maintained by the NASA GES DISC at the resolution of 0.25° × 0.25° (OMNO2G_V003 product) (Krotkov, Citation2012). Winter and summer monthly averages during 2005–2009 were calculated. More details about the OMI sensor and NO2 data products can be found in the studies by Levelt et al. (Citation2006), Bucsela et al. (Citation2006), Boersma et al. (Citation2007), and Lamsal et al. (Citation2014).
Results and discussion
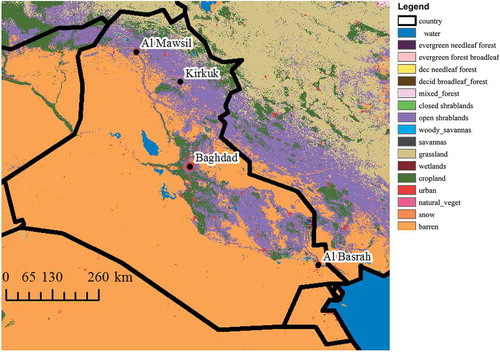
shows the 2009 land cover types for Iraq (MCD12Q1: MODIS Land Cover Product). As can be seen, Iraq has four major physiographic regions, including barren/sparsely vegetative (or desert areas) in the west and southwest, open shrub lands, croplands, and areas along the Euphrates and Tigris rivers, and grasslands on the north.
Figure 1. The 2009 land cover types for Iraq (MCD12Q1: MODIS Land Cover Product).
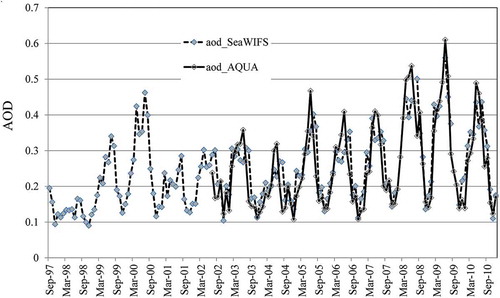
First, for the descriptive characterization of the time-related trends in dust pollution in the Iraq region, the AOD SeaWiFS data were presented alongside the MODIS derived AOD-data. shows the monthly mean AOD using SeaWiFS and MODIS (Aqua), which exhibit similar trends since each has the same Deep Blue retrieval (Sayer et al., Citation2012). In spite of instrumental and time differences between the two sensors, a trend of increasing AOD from the late 1990s through 2010 can be clearly seen. In previous study, Pozzer et al. (Citation2015) estimated a positive AOD trend for the Middle East region between 2001 and 2010 from satellite observations and from the model (using simulations with the EMAC: ECHAM5/MESSy Atmospheric Chemistry model) and noted similar trends. The uncertainty estimates of AOD retrievals in arid regions varied with R2 0.5–0.7 (AOD satellite vs. AOD AERONET) (Hsu et al., Citation2012; Petrenko and Ichoku, 2013).
Figure 2. Monthly mean AOD retrieved using SeaWIFS and MODIS (Aqua) over the 1997 to 2010 time period.
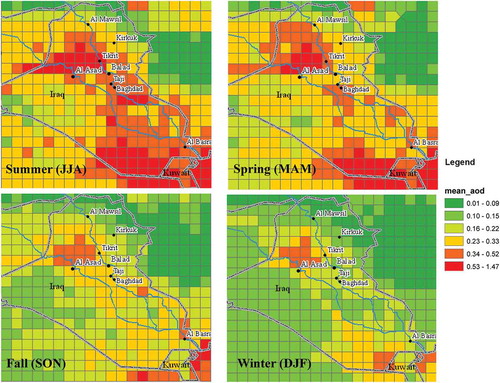
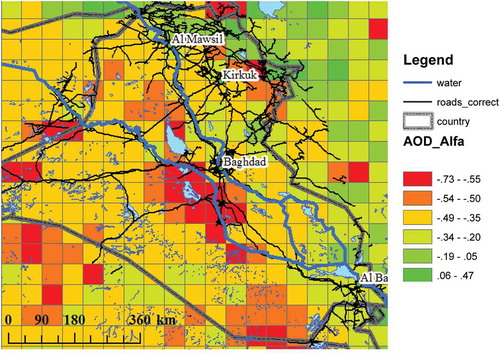
The AOD SeaWiFS seasonal averages from September 1997 to December 2010 are depicted in . There is a distinct intra- and interseasonal spatial pattern. Generally, there are greater AOD values beginning in May, reaching a maximum in July, with a reduction in September–November. Furthermore, there is a distinct spatial northwestern pattern of aerosol loadings in accordance with the prevailing wind direction. The highest mean AOD values are centered around Tikrit and on the southern border with Kuwait. Tikrit is in an area highly impacted by dust storms associated with northwestern and western winds, which transport dust toward the city (Hussain, Citation2012).
Figure 3. Maps of AOD seasonal (four panels) averages for 1997–2010 retrieved from SeaWIFS present the overall distributions of dust and anthropogenic pollution aerosols over source regions. Evident are distinct intra- and interseasonal variability patterns. Also note the northwesterly direction of aerosol loadings in accordance with the prevailing wind direction.
shows monthly averaged AOD at 550 nm and α for 2002–2010 in Iraq using MODIS Aqua (1° spatial resolution). Monthly AOD means were the highest in July and August and the lowest in November–January, reaching a minimum value of approximately 0.18 in December 2004. As it can be seen, there is an inverse relationship between AOD and α. As lower α values indicate the presence of large particles, the observed association suggests that coarse particles related to dust storms are mostly responsible for AOD maxima. The effect is particularly evident in the summer months. Similar trends were observed using the SeaWiFS sensor at 0.5° spatial resolution for the period 1997–2010 (data not shown).
Figure 4. AOD monthly averages at 550 nm and Angstrom exponents (α) for 2002–2010 in Iraq (MODIS Aqua). Note the inverse relationship between both parameters.
The strong negative relationship between AOD and α (e.g., AOD increasing (polluted atmosphere) versus α decreasing (coarse particles) indicates a significant contribution of dust storms to coarse particle concentrations. This finding can also indicate a greater contribution of soil dust attributable to from human activity. In this regard, we can assume that the contribution from other sources, for example, combustion sources, would reduce the strength of the correlation. Note that α decreases during the years whereas AOD shows an increasing trend (highlighted by trend lines, ). Therefore, it may be possible to use the correlation coefficient as indicator to assess the relative impact of desert dust and anthropogenic sources. In the Pearson correlation coefficients between AOD and α by grid 1997–2010 are graphically presented (p < 0.001 for 87% of grids). As shown, negative relationships between both parameters were observed for the majority of grids, again along the northwest direction and for desert regions. Note that the correlation coefficients varied by season, with mean values ranging from –0.41 in summer (June, July, and August) to –0.28 in spring (March, April, and May).
Figure 5. Pearson correlation coefficient between AOD and Angstrom exponent per pixel, 1997–2010.
The mountain region and several cities and locations exhibit greater variation in the relationship between AOD and α. These areas include locations with lower negative correlation values and some positive correlations. For example, southern Iraq, Al-Basra and adjacent areas near the Kuwait border, exhibit low positive correlations ( left). These correlations suggest that industrial/anthropogenic sources contribute to particulate pollution in these locations, an observation consistent with emissions from petrochemical industry sources in Al-Basra and adjacent areas near the Kuwait border.
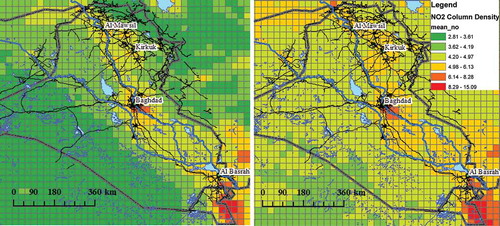
shows NO2 vertical column density data. The highest concentrations are shown in red. Elevated NO2 levels located near big urban centers and oil/gas refineries such as Baghdad, Kirkuk, Al-Mawsul, and Al-Basrah, and near the Kuwait border, next to the Persian Gulf area. Note that the concentrations are higher during summer months as compared to winter. These results are consistent with previous findings that showed high tropospheric NO2 columns in the Persian Gulf region and in general in urban and industrial regions in the Middle East region (Lelieveld et al., Citation2009; 2015). Generally, OMI NO2 columns are 1.6–2.7× higher in winter than in summer, reflecting the strong seasonal variation in photochemistry and NO2 lifetime (Boersma et al., 2009; Lamsal et al., 2015). For the Middle East, recent studies reported strong upward NO2 trends in summer, including the Arabian Gulf and eastern Mediterranean, in addition to high levels of O3 (Lelieveld et al., Citation2009, 2015; Schneider et al., 2012; Doche et al., 2014; Zanis et al., 2014).
Figure 6. Monthly mean OMI tropospheric NO2 columns over Iraq in (left) winter months (2005–2009) and (right) summer.
The relationship between monthly mean OMI tropospheric NO2 columns and AOD (–) also provides information about sources of particulate pollution. For example, the desert in the southwest and central provinces along the borders with Saudi Arabia exhibit high AOD values and low NO2 concentrations, suggesting that desert dust sources are the main contributors to particle mass. This is consistent with inverse relationships between AOD and α values in this area. Furthermore, to get additional insight into the relationship between AOD and α and NO2 densities, in we plot different ranges of NO2 conditional on AOD versus α correlations during summer (as an example). In general, low AOD versus α correlations correspond to areas with high measured NO2 densities consistent with anthropogenic sources.
Figure 7. Frequency distributions of NO2 densities conditional on AOD vs. α correlations during summer.
Recent research focuses on developing empirical models using ground measurements of the ambient particles. Several studies apply day-specific calibrations of AOD data to predict PM2.5 concentrations (Chudnovsky et al., Citation2012; Lee et al., Citation2011; Lee et al., Citation2012). However, the application of satellite-based exposure assessment in environmental health is still limited because the development of satellite-based PM prediction models depends on the availability of ground measurements that are still far too sparse in most of the high concentration regions and the lack of representative exposure estimates (Cohen et al. Citation2005; World Health Organization [WHO], 2006; Brauer et al., Citation2012).
Satellite data provide a good source of information to assess relative exposure levels and estimate relative source contributions in parts of the world where ground-level pollution data are limited or not available. Wang et al. (Citation2013) found that satellite MODIS AOD adjusted for relative humidity can be used directly to estimate the acute health impacts of ambient particles without prior calibrating to the sparse ground monitoring networks. Several other studies merged coincident AOD retrievals from MODIS, SeaWiFS, and MISR satellite instruments with aerosol vertical profiles from the GEOS-Chem global chemical transport model to estimate ground-level concentrations in remote areas (Van Donkelaar et al., Citation2010, Citation2015; Geng et al., 2015). Lin et al. (2014) used a visibility data set and the nested GEOS-Chem model to interpret the spatiotemporally varying relations between columnar and near-surface aerosols. Future studies should also consider application of high-resolution 1-km AOD data in arid regions such as with MAIAC (Multi-Angle Implementation of Atmospheric Correction) retrievals. This data source is of high potential to characterize a spatial variability in particle levels at a sub-10-km scale in future studies.
Conclusions
In this paper, we used AOD and α data as indicators of particle concentrations and size to investigate the origin of aerosols in Iraq. We demonstrated that AOD and α values vary both spatially and temporally, and in the majority of grids they are inversely correlated, suggesting that dust storms are mostly responsible for the observed high particle concentrations in these areas. Across the country, AOD values also varied both spatially and temporally. In areas where the inverse correlation between AOD and α values was weaker or the correlation was positive, it is likely that fine particle sources (e.g., anthropogenic) contributed to ambient particulate levels. The use of additional satellite products like OMI NO2 can identify possible anthropogenic sources of pollution. Our findings indicate that exposures attributable anthropogenic and nonanthropogenic sources varied by year, season, and location, indicating considerable variability across Iraq that can be described using satellite-based data.
Acknowledgments
The authors appreciate the suggestions of Planning Committee members the VA Cooperative Studies Program #595: Respiratory Health and Deployment to Iraq and Afghanistan: Nicholas L. Smith, Ph.D., Rebecca B. McNeil, Ph.D., and Jaime E. Hart, Sc.D. The authors also acknowledge the MODIS mission scientists and associated NASA personnel for the production of the data used in this research developed and maintained by the NASA GES DISC.
Funding
This work is supported by the U.S. Department of Veterans Affairs, Office of Research and Development, Clinical Science Research and Development, Cooperative Studies Program, U.S. Environmental Protection Agency (EPA) grant RD 83479801, and National Science Foundation Grant AGS-111916. Its contents are solely the responsibility of the authors and do not represent the official views of the EPA, U.S. Department of Veterans Affairs, or the U.S. Department of Defense/Army. Further, EPA, U.S. Department of Veterans Affairs, and the U.S. Department of Defense/Army do not endorse the purchase of any commercial products or services mentioned in the publication.
Additional information
Funding
Notes on contributors
A. Alexandra Chudnovsky
A. Alexandra Chudnovsky is an Assistant Professor at Tel-Aviv University and a visiting Scientist at the Harvard T.H. Chan School of Public Health. Her interests focus on developing modeling methods to predict and evaluate the contribution of local and regional pollution sources to the urban air quality. Petros Koutrakis is a Professor of Environmental Sciences at Harvard T.H. Chan School of Public Health and the Director of the EPA/Harvard University Center for Ambient Particle Health Effects. His research activities focus on the development of human exposure measurement techniques and the investigation of sources, transport, and the fate of air pollutants. Alex Kostinski is a Professor of Physics at MTU. His recent research has been in cloud, aerosol, and precipitation physics; radar meteorology; astrophysics; wave propagation in random media; turbulent fluids; adaptive optics; and polarization optics. Susan P. Proctor is a research scientist at U.S. Army Research Institute of Environmental Medicine (USARIEM), with appointments as a Research Scientist at the VA Boston Healthcare System and Research Associate Professor at Boston University. Her research interests focus on exposure assessment, health outcomes and environmental/occupational epidemiology. Eric Garshick is Associate Chief, Pulmonary, Allergy, Sleep, and Critical Care Medicine Section at the Veterans Affairs Boston Healthcare System; Professor of Medicine, Harvard Medical School; and a Research Physician at the Channing Division of Network Medicine, Brigham and Women’s Hospital. His research includes the study of the health effects of air pollution and diesel exhaust on respiratory health and the study of respiratory health in patients with chronic spinal cord injury.
References
- Ackerman, S., K. Strabala, W. Menzel, R. Frey, C. Moeller, and L. Gumley. 1998. Discriminating clear sky from clouds with MODIS. J. Geophys. Res. 103:32,141–57. doi:10.1029/1998JD200032
- Abraham, J.H., S.F. DeBakey, L. Reid, J. Zhou, and C.P. Baird. 2012. Does deployment to Iraq and Afghanistan affect respiratory health of US military personnel? J. Occup. Environ. Med. 54:740–45. doi:10.1097/JOM.0b013e318252969a
- Al-Dabbas M.A., A.M. Ayad, and R.M. Al-Khafaji. 2012. Dust storms loads analyses—Iraq Arabian Journal of Geosciences. 5:121–131.
- Angstrom, A. 1929. On the atmospheric transmission of sun radiation and on dust in the air. Geogr. Ann. 2:156–66.
- Boersma, K.F., H.J. Eskes, J.P. Veefkind, E.J. Brinksma, R.J. van der A, M. Sneep, G.H.J. van den Oord, P.F. Levelt, P. Stammes, J.F. Gleason, and E.J. Bucsela. 2007. Near-real time retrieval of tropospheric NO2 from OMI. Atmos. Chem. Phys. 7:2103–18. doi:10.5194/acp-7-2103-2007
- Bucsela, E.J., E.A. Celarier, M.O. Wenig, J.F. Gleason, J.P. Veefkind, K.F. Boersma, and E.J. Brinksma. 2006. Algorithm for NO2 vertical column retrieval from the ozone monitoring instrument. IEEE Trans. Geosci. Remote Sens. 44:1245−58. doi:10.1109/TGRS.2005.863715
- Brauer, M., et al. 2012. Exposure assessment for estimation of the global burden of disease attributable to outdoor air pollution. Environ. Sci. Technol. 46(2):652–60. doi:10.1021/es2025752
- Carn, S.A., A.J. Krueger, N.A. Krotkov, and M.A. Gray. 2004. Fire at Iraqi sulfur plant emits SO2clouds detected by Earth Probe TOMS. Geophys. Res. Lett. 31:L19105. doi:10.1029/2004GL020719
- Chan, C.C., K.J. Chuang, W.J. Chen, W.T. Chang, C.T. Lee, and C.M. Peng. 2008. Increasing cardiopulmonary emergency visits by long-range transported Asian dust storms in Taiwan. Environ. Res. 106:393–400. doi:10.1016/j.envres.2007.09.006
- Chan, C.C., and H.C. Ng. 2011. A case-crossover analysis of Asian dust storms and mortality in the downwind areas using 14-year data in Taipei. Sci. Total Environ. 410–411:47–52. doi:10.1016/j.scitotenv.2011.09.031
- Cheng, M.F., S.C. Ho, H.F. Chiu, T.N. Wu, P.S. Chen, and C.Y. Yang. 2008. Consequences of exposure to Asian dust storm events on daily pneumonia hospital admissions in Taipei, Taiwan. J. Toxicol. Environ. Health A 71:1295–99. doi:10.1080/15287390802114808
- Chiu, H.F., M.M. Tiao, S.C. Ho, H.W. Kuo, T.N. Wu, and C.Y. Yang. 2008. Effects of Asian dust storm events on hospital admissions for chronic obstructive pulmonary disease in Taipei, Taiwan. Inhal. Toxicol. 20:777–81. doi:10.1080/08958370802005308
- Chudnovsky, A.A., H.J. Lee, A. Kostinski, T. Kotlov, and P. Koutrakis. 2012. Prediction of daily fine particulate matter concentrations using aerosol optical depth retrievals from the Geostationary Operational Environmental Satellite (GOES). J. Air Waste Manage. Assoc. 62:1022–31. doi:10.1080/08958370802005308
- Chudnovsky, A., A. Kostinski, A. Lyapustin, and P. Koutrakis. 2013a. Spatial scales of pollution from variable resolution satellite imaging. Environ. Pollut. 172:131–38. doi:10.1016/j.envpol.2012.08.016
- Chudnovsky, A., C. Tang, A. Lyapustin, Y. Wang, J. Schwartz, and P. Koutrakis. 2013b. A critical assessment of high-resolution aerosol optical depth retrievals for fine particulate matter predictions. Atmos. Chem. Phys. 13:10907–17. doi:10.5194/acp-13-10907-2013
- Chudnovsky, A., P. Koutrakis, I. Kloog, S. Melly, F. Nordio, A. Lyapustin, Y. Wang, and J. Schwartz. 2014. Fine particulate matter predictions using high resolution aerosol optical depth (AOD) retrievals. Atmos. Environ, 89:189–98. doi:10.1016/j.atmosenv.2014.02.019
- Cohen, A., H. Anderson, B. Ostra, K.D. Pandey, M. Krzyzanowski, and N. Künzli. 2005. The global burden of disease due to outdoor air pollution. J. Toxicol. Environ. Health A 68:1–7. doi:10.1080/15287390590936166
- D’Almeida, G.A., P. Koepke, and E.P. Shettle, 1991. Atmospheric Aerosols, Global Climatology and Radiative Characteristics. Hampton, VA: A. Deepak Publ.
- Dubovik, O., B.N. Holben, T.F. Eck, et al. 2002. Variability of absorptionand optical properties of key aerosol types observed in worldwide locations. J. Atmos. Sci. 59:590–608. doi:10.1175/1520-0469(2002)059<0590:VOAAOP>2.0.CO;2
- Eck, T.F., B.N. Holben, J.S. Reid, O. Dubovik, A. Smirnov, N.T. O’Neill, I. Slutsker, and S. Kinne. 1999. Wavelength dependence of the opticaldepth of biomass burning, urban, and desert dust aerosols. J. Geophys. Res. 104(D24): 31,333–49. doi:10.1029/1999JD900923
- Eck, T.F., Holben, B.N., Dubovik, O., Smirnov, A., Goloub, P., Chen, H.B., Chatenet, B., Gomes, L., Zhang, X.-Y., Tsay, S.-C., Ji, Q., Giles, D., Slutsker, I. 2005. Columnar aerosol optical properties at AERONET sites in central eastern Asia and aerosol transport to the tropical mid-Pacific. J. Geophys. Res. D Atmos. 110(6):1–18. doi:10.1029/2004JD005274
- Friedl, M.A., D. Sulla-Menashe, B. Tan, A. Schneider, N. Ramankutty, A. Sibley, and X. Huang. 2010. MODIS Collection 5 Global Land Cover: Algorithm refinements and characterization of new datasets. Remote Sens. Environ. 114:168–82. doi:10.1016/j.rse.2009.08.016
- Gao, B.-C., P. Yang, W. Han, R. Li, and W. Wiscombe. 2002. An algorithm using visible and 1.375 mm channels to retrieve cirrus cloud reflectances from aircraft and satellite data. IEEE Trans. Geosci. Remote Sens. 40:1659–88.
- Ginoux, P., J.M. Prospero, T.E. Gill, N.C. Hsu, and M. Zhao. 2012. Global-scale attribution of anthropogenic andnatural dust sources and their emission rates based on MODIS Deep Blue aerosol products. Rev. Geophys. 50:RG3005. doi:10.1029/2012RG000388
- Goudie, A.S. 2014. Desert dust and human health disorders. Environ. Int. 63:101–13. doi:10.1016/j.envint.2013.10.011. Epub 2013 November 26.
- Hsu, N.C., S.C. Tsay, M.D. King, and J.R. Herman. 2004. Aerosol properties overbright reflecting source regions. IEEE Trans. Geosci. Remote Sens. 42:557–69. doi:10.1109/TGRS.2004.824067
- Hsu, N.C., S.C. Tsay, and M.D. King. 2006. Deep Blue retrievals ofAsian aerosol properties during ACE-Asia. IEEE Trans. Geosci. Remote Sens. 44:3180–95. doi:10.1109/TGRS.2006.879540
- Hsu, N.C., R. Gautam, A.M. Sayer, C. Bettenhausen, C. Li, M.J. Jeong, S.C. Tsay, and B.N. Holben. 2012. Global and regional trends of aerosol optical depth over land and ocean using SeaWiFS measurements from 1997 to 2010. Atmos. Chem. Phys. 12:8037–53. doi:10.5194/acp-12-8037-2012
- Hsu, N.C., M.-J. Jeong, C. Bettenhausen, A.M. Sayer, R. Hansell, C.S. Seftor, J. Huang, and S.-C. Tsay. 2013. Enhanced Deep Blue aerosol retrieval algorithm: The second generation. J. Geophys. Res. Atmos. 118:9296–315. doi:10.1002/jgrd.50712
- Hussain, A.I. 2012. The nature, source and composition of the dust storms in Tikrit, Iraq. Iraqi J. Desert Stud. 4:23–24.
- Kaufman, Y.J., D. Tanré, L.A. Remer, E.F. Vermote, A. Chu, and B.N. Holben. 1997. Operational remote sensing of tropospheric aerosol over land from EOS MODerate resolution imaging spectroradiometer. J. Geophys Res. 102(D14):17,051–67. doi:10.1029/96JD03988
- Kokhanovsky, A.A., and G. de Leeuw, eds. 2009. Satellite Aerosol Remote Sensing Over Land. Berlin, Germany: Springer-Praxis.
- Krotkov, N. 2012. OMI/Aura NO2 Total and Tropospheric Column Daily L2 Global 0.25 deg Lat/Lon Grid, version 003. NASA Goddard Space Flight Center. doi:10.5067/Aura/OMI/DATA2018
- Kutiel, H., and H. Furman. 2003. Dust storms in the Middle East: Sources of origin and their temporal characteristics. Indoor Built Environ. 12:419–26. doi:10.1177/1420326X03037110
- Lamsal, L.N., N.A. Krotkov, E.A. Celarier, W.H. Swartz, K.E. Pickering, E.J. Bucsela, J.F. Gleason, R.V. Martin, S. Philip, H. Irie, A. Cede, J. Herman, A. Weinheimer, J.J. Szykman, and T.N. Knepp. 2014. Evaluation of OMI operational standard NO2 column retrievals using in situ and surface-based NO2 observations. Atmos. Chem. Phys. 14:11587–609. doi:10.5194/acp-14-11587-2014
- Lee, H.J., B.A. Coull, M.L. Bell, and P. Koutrakis. 2012. Use of satellite-based aerosol optical depth and spatial clustering to predict ambient PM2.5 concentrations. Environ. Res. 118:8–15. doi:10.1016/j.envres.2012.06.011
- Lee, H.J., Y. Liu, B.A. Coull, J. Schwartz, and P. Koutrakis. 2011. A novel calibration approach of MODIS AOD data to predict PM2.5 concentrations. Atmos. Chem. Phys. 11:7991–8002. doi:10.5194/acp-11-7991-2011
- Lelieveld, J., P. Hoor, P. Jöckel, A. Pozzer, P. Hadjinicolaou, J.-P. Cammas, and S. Beirle. 2009. Severe ozone air pollution in the Persian Gulf region. Atmos. Chem. Phys. 9:1393–406. doi:10.5194/acp-9-1393-2009
- Levelt, P.F., G.H.J. van den Oord, M.R. Dobber, A. Malkki, H. Visser, J. de Vries, P. Stammes, J.O.V. Lundell, and H. Saari. 2006. The ozone monitoring instrument. IEEE Trans.Geosci. Remote Sens. 44:1093–101. doi:10.1109/TGRS.2006.872333
- Levy, R.C., L. Remer, S. Mattoo, E. Vermote, and Y.J. Kaufman. 2007. Second-generation algorithm for retrieving aerosol properties over land from MODIS spectral reflectance. J. Geophys. Res. 112:D13211. doi: 10.1029/2006JD007811
- Levy, R.C., L.A. Remer, R.G. Kleidman, S. Mattoo, C. Ichoku, R. Kahn, and T.F. Eck. 2010. Global evaluation of the Collection 5 MODIS dark-target aerosol products over land. Atmos. Chem. Phys. 10:10399–420, doi:10.5194/acp-10-10399-2010
- Longtin, D., E. Shettle, J. Hummel, and J. Pryce. 1988. A desert aerosol model for radiative transfer studies. In Aerosols and Climate, ed. P.V. Hobbs and M.P. McCormick, 261–69. Hampton, VA: A. Deepak.
- Lyapustin, A., J. Martonchik, Y. Wang, I. Laszlo, and S. Korkin. 2011. Multi-Angle Implementation of Atmospheric Correction (MAIAC): Part 1. Radiative transfer basis and look-up tables. J. Geophys. Res. 116:D03210, doi:10.1029/2010JD014985
- Malinowski, J. 2003. Iraq: Geographic Perspectives. New York: McGraw-Hill/Dushkin.
- Martins, J.V., D. Tanre, L.A. Remer, Y.J. Kaufman, S. Mattoo, and R. Levy. 2002. MODIS cloud screening for remote sensing of aerosol over oceans using spatial variability. Geophys. Res. Lett. 29:1619. doi:10.1029/2001GL01352
- Merrifield, A., S. Schindeler, B. Jalaludin, and W. Smith. 2013. Health effects of the September 2009 dust storm in Sydney, Australia: Did emergency department visits and hospital admissions increase? Environ. Health 12:32. doi:10.1186/1476-069X-12-32
- Middleton, N. 1986. Dust storms in the Middle East. J. Arid Environ. 10:83–96.
- Middleton, N., P. Yiallouros, S. Kleanthous, O. Kolokotroni, J. Schwartz, D.W. Dockery, et al. 2008. A 10-year time-series analysis of respiratory and cardiovascular morbidity in Nicosia, Cyprus: The effect of short-term changes in air pollution and dust storms. Environ. Health 7:39. doi:10.1186/1476-069X-7-39
- National Research Council. 2010. Review of the Department of Defense Enhanced ParticulateMatter Surveillance Program Report. Washington, DC: National Academies Press.
- Neophytou, A.M., P. Yiallouros, B.A. Coull, S. Kleanthous, P. Pavlou, S. Pashiardis, et al. 2013. Particulate matter concentrations during desert dust outbreaks and daily mortality in Nicosia, Cyprus. J. Expos. Sci. Environ. Epidemiol. 23:275–80. doi:10.1038/jes.2013.10
- Perez, L., A. Tobias, X. Querol, N. Kunzli, J. Pey, A. Alastuey, et al. 2008. Coarse particles from Saharan dust and daily mortality. Epidemiology 19:800–7. doi:10.1097/EDE.0b013e31818131cf
- Perez, L., A. Tobias, X. Querol, J. Pey, A. Alastuey, J. Diaz, et al. 2012. Saharan dust, particulate matter and cause-specific mortality: a case-crossover study in Barcelona (Spain). Environ. Int. 48:150–55. doi:10.1016/j.envint.2012.07.001
- Pozzer, A., A. de Meij, J. Yoon, H. Tost, A.K. Georgoulias, and M. Astitha. 2015. AOD trends during 2001–2010 from observations and model simulations. Atmos. Chem. Phys. 15:5521–35. doi:10.5194/acp-15-5521-2015
- Prospero, J.M., P. Ginoux, O. Torres, S.E. Nicholson, and T.E. Gill. 2002. Environmental characterization of global sources of atmospheric soil dustidentified with the NIMBUS 7 Total Ozone Mapping Spectrometer (TOMS) absorbing aerosol product. Rev. Geophys. 40(1):1002. doi:10.1029/2000RG000095
- Reid, J. S., T. F. Eck, S. A. Christopher, P. V. Hobbs, and B. N. Holben(1999), Use of the Ångström exponent to estimate the variability ofoptical and physical properties of aging smoke particles in Brazil. J. Geophys. Res. 104(D22): 27,473–89. doi:10.1029/1999JD900833
- Remer, L.A., Y.J. Kaufman, D. Tanre, S. Mattoo, D.A. Chu, J.V. Martins, R.R. Li, C. Ichoku, R.C. Levy, R.G. Kleidman, T.F. Eck, E. Vermote, and B.N. Holben. 2005. The MODIS aerosol algorithm, products, and validation. J. Atmos. Sci. 62:947–73. doi:10.1175/JAS3385.1
- Roop, S.A., A.S. Niven, B.E. Calvin, J. Bader, and L.L. Zacher. 2007. The prevalence and impact of respiratory symptoms in asthmatics and nonasthmatics during deployment. Mil. Med. 172:1264–69. doi:10.7205/MILMED.172.12.1264
- Sanders, J.W., S.D. Putnam, C. Frankart, R.W. Frenck, M.R. Monteville, M.S. Riddle, et al. 2005. Impact of illness and non-combat injury during Operations Iraqi Freedom and Enduring Freedom (Afghanistan). Am. J. Trop. Med. Hyg. 73:713–19.
- Sayer, A.M., N.C. Hsu, C. Bettenhausen, M.J. Jeong, B.N. Holben, and J. Zhang. 2012. Globaland regional evaluation of over-land spectral aerosol optical depth retrievals from SeaWiFS. Atmos. Meas. Tech. Discuss. 5:2169–220. doi:10.5194/amtd-5-2169-2012
- Sissakian, V., N. Al-Ansari, and S. Knutsson. 2013. Sand and dust storm events in Iraq. Nat. Sci. 5(10):1084–94. doi:10.4236/ns.2013.510133
- Smith, B., C.A.Wong, T.C. Smith, E.J. Boyko, and G.D. Gackstetter. 2009. Newly reported respiratory symptoms and conditions among military personnel deployed to Iraq and Afghanistan: A prospective population-based study. Am. J. Epidemiol. 170:1433–42. doi:10.1093/aje/kwp287
- Smith, T.C., C.A. Leardmann, B. Smith, I.G. Jacobson, and M.A. Ryan. 2009. Postdeployment hospitalizations among service members deployed in support of the operations in Iraq and Afghanistan. Ann. Epidemiol. 19:603–12. doi:10.1016/j.annepidem.2009.05.002
- Szema, A.M., M.C. Peters, K.M. Weissinger, C.A. Gagliano, and J.J. Chen. 2010. New-onset asthma among soldiers serving in Iraq and Afghanistan. Allergy Asthma Proc. 31:67–71.
- Tam, W.W., T.W. Wong, and A.H. Wong. 2012a. Effect of dust storm events on daily emergency admissions for cardiovascular diseases. Circ. J. 76:655–60. doi:10.1253/circj.CJ-11-0894
- Tam, W.W., T.W. Wong, A.H. Wong, and D.S. Hui. 2012b. Effect of dust storm events on daily emergency admissions for respiratory diseases. Respirology 17:143–48. doi:10.1111/j.1440-1843.2011.02056.x
- van Donkelaar, A., R.V. Martin, M. Brauer, R. Kahn, R. Levy, C. Verduzco, and P.J. Villeneuve. 2010. Global estimates of ambient fine particulate matter concentrations from satellite-based aerosol optical depth: Development and application. Environ. Health Perspect. 118(6):847–55. doi:10.1289/ehp.0901623
- Van Donkelaar, A., R.V. Martin, M. Brauer, and B.L. Boys. 2015. Use of satellite observations for long-term exposure assessment of global concentrations of fine particulate matter. Environ. Health Perspect. 123(2):135–43. doi:10.1289/ehp.1408646
- Wang, Z., Y. Liu, M. Hu, X. Pan, J. Shi, F. Chen, K. He, P. Koutrakis, and D.C. Christiani. 2013. Acute health impacts of airborne particles estimated from satellite remote sensing. Environ. Int. 51:150–59. doi:10.1016/j.envint.2012.10.011
- Washington, R., M. Todd, N.J. Middleton, and A.S. Goudie. 2003. Duststorm source areas determined by the total ozone monitoring spectrometer and surface observations. Ann. Assoc. Am. Geogr. 93:297–313. doi:10.1111/1467-8306.9302003