
ABSTRACT
The Motor Vehicle Emission Simulator (MOVES) quantifies emissions as a function of vehicle modal activities. Hence, the vehicle operating mode distribution is the most vital input for running MOVES at the project level. The preparation of operating mode distributions requires significant efforts with respect to data collection and processing. This study is to develop operating mode distributions for both freeway and arterial facilities under different traffic conditions. For this purpose, in this study, we (1) collected/processed geographic information system (GIS) data, (2) developed a model of CO2 emissions and congestion from observations, (3) implemented the model to evaluate potential emission changes from a hypothetical roadway accident scenario. This study presents a framework by which practitioners can assess emission levels in the development of different strategies for traffic management and congestion mitigation.
Implications: This paper prepared the primary input, that is, the operating mode ID distribution, required for running MOVES and developed models for estimating emissions for different types of roadways under different congestion levels. The results of this study will provide transportation planners or environmental analysts with the methods for qualitatively assessing the air quality impacts of different transportation operation and demand management strategies.
Introduction
Transportation-related air pollution problems have gained increasing attention in recent years. Federal and state governments have mandated that new transportation projects conform to Environmental Protection Agency (EPA) regulations. Conformance with transportation regulations is required under the Clean Air Act section (CAA) to ensure that federally supported highway and transit project activities are consistent with the purposes of state implementation plans (SIP) (EPA, Citation2010a). Thus, every transportation project must undergo environmental impact assessment and approval processes before construction can commence. The EPA’s current official model for estimating vehicle emissions from on-road mobile sources is called the Motor Vehicle Emission Simulator (MOVES).
The MOVES model quantifies emissions as a function of the vehicle operating mode. Although a user-input operating mode is not always required to run MOVES, it provides the most accurate way to designate vehicle operation links and it is required for conducting project-level analysis (EPA, Citation2010c). Thus, preparing operating mode distributions for different traffic and roadway conditions is a critical task for accurate vehicle emission assessments at the project level. In fact, it also represents one of the biggest challenges in using MOVES because it requires the most effort with respect to data collection and processing. To address this problem, in this study we developed operating mode distributions for different traffic congestion levels for both freeway and arterial facilities. For this purpose, we collected 50 hours of global positioning system (GPS)-based speed profile data from various freeway and arterial road sections in Houston, TX, over a 3-month period to prepare the operating mode distributions for different traffic conditions. These operating mode distributions can be readily used by both practitioners and researchers to assess emissions using MOVES. To demonstrate the application of the developed operating mode distributions, we carried out a case study on a two-route hypothetical corridor to evaluate the impacts of Advanced Traveler Information Systems (ATIS) on vehicle emissions under an accident condition. The study results and developed emission estimation framework will aid practitioners to carry out emission impact assessments using MOVES to complete any project-level analysis, including hot-spot analyses for transportation conformity determinations, modeling project-level emissions for state implementation plan (SIP) development, and completing analyses pursuant to the National Environmental Policy.
Literature review
Understanding the relationship between different traffic operating conditions and the resultant emission levels is important for evaluating traffic management strategies. Several studies have investigated how traffic congestion levels affect emissions. These studies have focused on quantifying emissions as a function of average speed, and were carried out using either field or simulated data and one of various emission models, such as EPA’s current MOVES, EPA’s earlier MOBILE, the Emission Factors (EMFAC) model, and the Comprehensive Modal Emissions Model (CMEM). Findings from four representative studies are summarized in the following.
Barth and Boriboonsomsin (Citation2008) analyzed traffic congestion and its impacts on CO2 emissions. To estimate the impacts of congestion on emissions, the authors examined the velocity patterns of vehicles operating under different congestion levels and fed into the CMEM a data set of real-world freeway vehicle activity, which was collected using probe vehicles. The velocity trajectories in the database were then grouped into snippets according to different levels of service (LOS). The estimated CO2 emissions were plotted as a function of average running speed. Several emission reduction strategies were examined with respect to traffic operation improvements and emission benefits.
Bigazzi and Figliozzi (Citation2011) explored the effects of traffic speeds, freeway capacity, travel demand, and alternative efficiency strategies on freeway emissions. Marginal emission rates were modeled as functions of average travel speed, using the Bureau of Public Roads (BPR) model to estimate the average speed at different congestion levels. Vehicle emissions rates were estimated using MOVES 2010.
Papson et al. (Citation2012) examined vehicle emissions at congested and uncongested signalized intersections, and then analyzed emissions under three traffic intersection scenarios. The authors estimated emissions using a time-in-mode (TIM) methodology that combined emissions factors for each activity mode (acceleration, deceleration, cruise, and idle) based on the percentage of vehicle travel time in that mode. The results demonstrated the contribution of each mode to the total emissions, with the greatest sources of emissions being cruising and acceleration.
The Federal Highway Administration (FHWA) (Citation2010) used the volume-to-capacity (V/C) ratio to measure freeway congestion levels and a microsimulation-based process to prepare operating mode distributions for different V/C ratio ranges. First, microsimulation software was used to model the traffic conditions, and then the outputs of the running simulation—a set of vehicle trajectory files—were used to calculate vehicle-specific power (VSP). Based on the vehicle speed and the calculated VSP, a MOVES operating mode identification (ID) was assigned to each second. Then the amount of time the vehicle was operating in each operating mode was calculated in order to prepare the final operating mode distributions.
These studies developed emission estimation frameworks under different traffic operation conditions for a number of specific roadway types using different emission estimation tools and approaches, including MOVES, CMEM, and TIM—each of which has strengths and limitations. In the first study (Barth and Boriboonsomsin, Citation2008), CMEM is limited to estimating the emission impacts on a specific selection of vehicles characterized specifically for the model. In the second the study (Bigazzi and Figliozzi, Citation2011), using average speeds alone in MOVES meant that the results were dependent on the representativeness of the default MOVES driving schedules with respect to the scenarios evaluated. In the third study (Papson et al., Citation2012), the TIM approach was limited to the availability of appropriate modal emission rates for each vehicle type included in the analysis. The FHWA publication (Citation2010) estimated only freeway emissions and the accuracy of the microsimulation model result must be further validated. To overcome these drawbacks, this study uses MOVES project-level analysis with different operating mode distributions to estimate emission rates at different congestion levels, which allows for the analysis to specify the vehicle model years and types to be simulated and applies an appropriate set of average model emission rates to each vehicle/model year combination.
Data collection and processing
Data collection
Data for this study were collected form the Houston, TX, road network using a probe vehicle (2005 Nissan Altima Sedan, 2.5-L, 4-cyl., 4-speed automatic) equipped with a GPS unit. The probe-vehicle driver collected all GPS data during morning peak hours between 8:00 a.m. and 9:00 a.m. for every weekday from January 2 to April 23, 2013. The driving route included both freeway and arterial sections, with speed limits of 65 mph and 35 mph, respectively. All the raw data were input into MATLAB software to carry out the preliminary processing. Incomplete and unrealistic data were eliminated from further analysis. In total, 50 hr of second-by-second data was collected for this study.
Data processing
In this step, using ArcGIS spatial function tools, all 50 hr of data were first separated into freeway and arterial sections based on the road classifications. For arterial sections, due to high variability in the speed profiles of vehicles traveling through mid-block sections and signalized intersection zones (zones in which vehicles decelerate, stop, and accelerate), a separate set of operating mode distributions was prepared for each section. As such, the arterial data were further broken down into mid-block sections and intersections, respectively. Mid-block sections began 200 ft from intersection stop lines, and the remaining section was classified as an intersection zone. For intersection zones, the vehicle speed profiles that stopped at the intersections were archived for analyzing the amount of emissions generated at signalized intersections per stop. The following paragraphs introduce the data processing procedure for processing the GPS speed profile data.
Freeway
Freeway speed profiles were broken into short speed-profile segments called speed snippets using a “change-point detection method” based on a standard normal deviation. A snippet is a short speed profile segment used to define a short-term and relative stable driving pattern during a long driving cycle. Some previous studies have also called it a “micro-cycle” (Yu et al., Citation2008). When a significant jump in the speed profile is detected, the speed profile is broken off at that point and saved in the array of speed snippets. A break point was detected if the difference between the mean of the first five speed data points and the sixth speed data point was greater than the standard deviation of the first five points. The resulting speed snippets were binned into different speed categories, where each category had a 10-mph range. In total, there were eight categories, ranging from 0–10 mph to 70–80 mph. Different speed ranges represent different congestion levels, since the freeway flow speed is 65 mph. Note that, consistent with Barth and Boriboonsomsin (Citation2008), snippets shorter than 10 sec were discarded from the data set in order to exclude short-term vehicle speed disturbances due to unexpected events (such as a hard break caused by vehicles cutting in front of the probe vehicle) rather than traffic congestion. This step was carried out in order to build separate operating mode distributions for different speed bins or congestion levels.
Arterial mid-block
Mid-block sections were assumed to be unaffected by the characteristic stop-and-go traffic at intersections. Similar to the procedure for processing freeway data, speed snippets were generated based on the data collected from mid-block sections, which were then binned into speed categories ranging from 20–30 mph to 40–50 mph. There were only a limited sample of speed snippets in other speed-range categories and, hence, these were not considered in this study.
Arterial intersection zone
The intersection zone (200 ft upstream and downstream from the intersection) was assumed to capture the vehicle deceleration, stop, and acceleration activities required by the signal. Speed snippets were derived based only on the speed profile of the trips by the probe vehicle during which stops were made at the intersection. A total of 88 intersection-stop speed profiles were extracted for this study period, which included right turns, left turns, and through movements. In this study, the intersection emission estimation is based primarily on the probability that vehicles must make stops at intersections, and assumes no effect from traffic congestion for “need-to-stop” cases. For cases in which vehicles can pass through intersections without stopping, same operating mode distributions as for the mid-block sections were used.
Development of operating mode distribution for MOVES 2010
MOVES 2010 is a mobile source inventory model developed by the U.S. EPA. MOVES uses VSP, in which the instantaneous power demand of a vehicle is divided by its mass as the primary variable in modeling emissions. Here, we used the equation provided by Jiménez-Palacios (1998) to determine a vehicle’s instantaneous VSP values:
where v is the vehicle speed (m/sec), α is the acceleration (m/sec2), g (%) is the grade of road section, which is assumed to be 0 in this study since all the field data were collected from a relatively flat terrain, and vw is the headwind into the vehicle, which is assumed to be 0 according to Song and Yu (Citation2011).
To estimate the operating mode distribution for each road type (freeway, arterial mid-block, and intersection), we calculated the VSP values corresponding to each GPS data point (speed and acceleration data) using eq 1. The operating mode ID for each data point was determined based on the definitions listed in . Based on the sets of speed profile snippets that were prepared for different road types and average speed ranges, lists the operating mode distributions for freeways under different traffic conditions (0–10 mph, …, 70–80 mph), arterial mid-blocks under different traffic conditions (20–30 mph, 30–40 mph, 40–50mph), and intersection zones (for vehicles with stops). The distribution data from this table can be used as input for MOVES for estimating vehicle emissions for different types of roads at different traffic congestion levels. Note that average speed in is used as a congestion indicator because it relates to roadways with given speed limits, and the difference between the speed limit and average speed is the speed reduction caused by traffic congestion.
Table 1. Definition of MOVES operating mode ID for running-exhaust operation.
Table 2. Vehicle operating mode distributions for freeway and arterials under different speed ranges and SRCIs in flat terrain.
Smit (Citation2008) recommended Speed Reduction Congestion Index (SRCI) as a good indicator of traffic congestion for vehicle emission estimation. The SRCI is given by
where sl is the speed limit of the respective roadway facility, and v is the mean speed of vehicles in the roadway facility under consideration.
The results produced in this study can be generalized and applied to any freeway or artery if the SRCI value is known. For example, to estimate the impacts of traffic operating conditions on CO2 emission levels for different road types, the SRCI values can be used to obtain the corresponding operating mode distributions found in . These distributions can be used as inputs for running MOVES to estimate the respective emission levels. To run MOVES, we set the modeling scenario to be a typical weekday in March 2013 for Harris County, Texas, where speed profiles had also been collected. The pollutant of interest in the study was CO2. We considered only running exhaust emissions since our objective was to concentrate on evaluating emission levels at the link or corridor level. The second batch of inputs prepared were project-level input files, listed as follows:
Link characteristics: using the scenario-specific values listed earlier.
Link sources: using national-level source distribution values.
Meteorology: using county-level values specific to the study.
Age distribution of vehicles: using national-level age distribution values.
Fuel supply and formulation: using default values from MOVES (EPA, Citation2010b).
The results from this exercise comprise the estimated CO2 factors (g/mi) for different SRCI values, as plotted in . We can see that as the SRCI values increased, emission rates also increased for both the freeway and arterial road types. However, the arterial emission rates increased more rapidly than the freeway emission rates.
Figure 1. Actual and regressed CO2 emission factors plotted against SRCI for freeway and for arterial mid-block section.
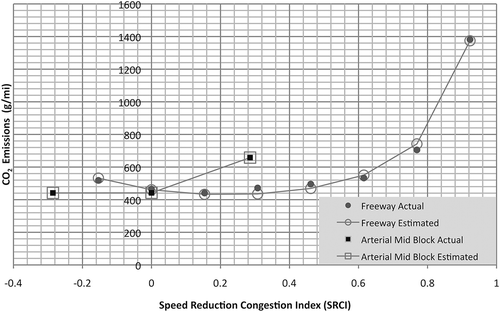
Subsequently, higher order polynomial forms were used to fit the data points with the CO2 emission factor (g/mi) as the dependent variable and SRCI as the independent variable. We developed the following models for the freeway and arterial mid-block facilities:
For a freeway facility, the regression equation relating the CO2 factor (g/mi) to the SRCI is
(3)
where y is the CO2 factor (g/mi), and x is the SRCI value.
For an arterial mid-block facility, the regression equation relating the CO2 factor (g/mi) to the SRCI value is
where is the CO2 factor (g/mi), and
is the SRCI value.
Note that in both these models, the R2 value was 0.99. also illustrates the CO2 factor (g/mi) estimates for different congestion levels, using the regression results from eqs 3 and 4.
The operating mode distribution for vehicles that make stops at signalized intersections is also provided in , and was used to estimate the amount of emissions generated by each vehicle’s stop-and-go activity. The average CO2 emission amount for one vehicle making one stop at a signalized intersection was estimated to be 12.3 g/vehicle.
Case study for evaluating emission levels under an incident scenario by implementing developed model
Assumptions and design
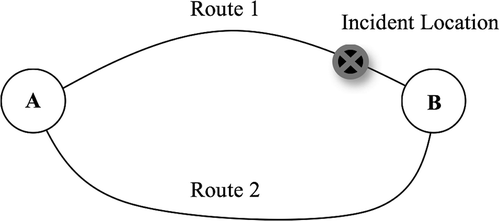
In this section, we present a hypothetical incident management scenario that was designed and analyzed to illustrate the use of the operating mode distribution table developed in this study. The design and assumptions for the case study were inspired from the work of Hu et al. (Citation2009), Al-deek et al. (Citation1995), and Levinson (Citation2007). As shown in , in this case study, we used a base network with a two-route corridor with two routes to travel from point A to point B. Route 1 is a freeway with a free flow travel time T1 and a capacity C1. Route 2 is an artery with a free flow travel time T2, a capacity C2, and an average of two intersections per unit mile. It is assumed that T1 < T2 and C1 > C2. In this case study, an incident is simulated on Route 1 that reduces its capacity by 70%. Summaries of the traffic and geometric characteristics of Routes 1 and 2 are listed in . We numerically evaluated scenarios with different vehicle rates diverging from Route 1 to Route 2.
Table 3. Traffic and geometric characteristics for Route 1 and Route 2.
Figure 2. Sketch of corridor for case study.
In scenario I, the vehicle diversion rates vary (0% to 70%) from the route on which the incident occurred to an alternate route. We used Scenario I to test the impacts of different vehicle diversion rates from Route 1 to Route 2 following the incident. The parameters evaluated include the total system travel time and CO2 emissions. Once the incident occurred and the capacity of Route 1 reduced by 70%, the mean speed on this route is necessarily reduced. As vehicles entering Route 1 are diverted to Route 2, the mean speed on Route 1 improves, while the mean speed on Route 2 declines. The speed reduction on both routes can be calculated using the BPR model for macroscopic volume-speed relations (Dowling, Kittelson, and Zeeger, Citation1997), as given by eq 5:
where v is the mean speed, vo is the free flow speed, V is the volume of link per unit time, C is the practical capacity of the link per unit time, is 10, and
is .20 for unrestricted facilities (e.g., the freeway) and .05 for restricted facilities (e.g., the artery).
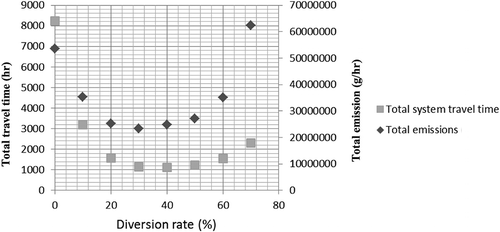
The free flow speeds and practical capacities for both facilities were determined using guidelines from Dowling and Kittelson (1997) and the Highway Capacity Manual (Transportation Research Board, Citation2010). The mean speeds for Routes 1 and 2 for each diversion rate case were determined using eq 5. The mean speeds were then converted to their respective congestion indicator values, SRCI, using eq 2. Subsequently, we used the models developed for estimating CO2 factors (given by eqs 3 and 4) to determine the emission levels for each case. We assumed that Route 2 has an average of two intersections per unit mile and that the probability of a vehicle having to stop at signalized intersection is 0.33. The CO2 emissions per intersection stop for each vehicle was estimated to be 12.3 g. All these factors were taken into consideration to estimate the total amount of emissions produced along Route 2. shows the total system CO2 emission (g/hr) and total system travel time (hr) for each diversion rate. Note that if other types of pollutant must be determined, the operating mode distributions listed in can be used as input to run MOVES and thereby obtain the respective emission factors.
Figure 3. Total system travel time and CO2 emission for different diversion rates.
In Scenario II, the diversion rate is used to attain the user equilibrium condition. Scenario II assumes that all travelers in the study network are equipped with an ATIS, which can guide users to achieve an optimal user state, i.e., a user equilibrium state (Wardrop, Citation1952). To determine the diversion rate for the user equilibrium state, the travel times for both Routes 1 and 2 were determined using the BPR travel time function (Dowling and Kittelson, 1997):
where t is the mean travel time, t0 is the free flow travel time, V is the volume of the link per unit time, C is the practical capacity of the link per unit time, is 10, and
is .20 for unrestricted facilities (e.g., the freeway) and .05 for restricted facilities (e.g., the artery).
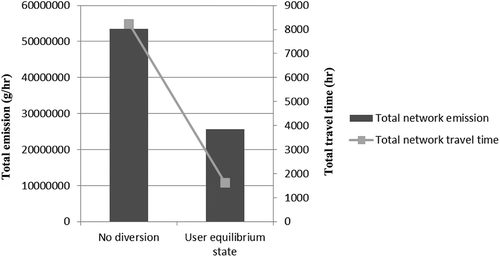
The solution determined for the diversion rate at the user equilibrium state was 19.4%. Subsequently, V/C ratios were used to calculate the mean speeds on Routes 1 and 2 using eq 5. Thereafter, the mean speeds were converted into their respective SRCI values using eq 2, and the CO2 emission factors were estimated using eqs 3 and 4. Then, we derived the total system CO2 emission levels for the user equilibrium state and the no-diversion cases, as shown in . We can see that the total network CO2 emission was reduced from 53547669 (g/h) to 25695658 (g/h) with the implementation of an ATIS. shows a comparison of the total system travel time for the user equilibrium state and the no-diversion state. These case study results show that an ATIS results in improved air quality by reducing emission levels. A drastic reduction in total system travel time was also observed, as shown in .
Figure 4. Emissions at no diversion and user equilibrium state.
Conclusions
This study prepared the primary input, that is, operating mode distribution, required for running MOVES and developed a method for estimating vehicle emissions for different types of roadways under different congestion conditions. To demonstrate the application of the study results, we carried out a hypothetical case study to evaluate the impacts on vehicle emissions of using an ATIS following a traffic incident. The case study illustrates the usefulness of the framework recommended in this study. Practitioners can use the operating mode distributions developed in this study to carry out similar evaluation studies. Note that because of some simplifications made during the modeling process, such as discarding the short snippets and reducing the operation at intersections to a single emission rate per stop, some bias will likely be introduced in the estimated emission rates. Thus, the developed method is mainly recommended for conducting emission comparison studies, such as the case study presented in this paper, and is not recommended for directly developing actual expected emission inventories. Furthermore, although the case study focuses only on estimating CO2 levels, the developed operating mode distributions can be used as input to run MOVES and obtain emission factors for any specified pollutants. The results of this study will facilitate the evaluation of transportation operation and demand management strategies with respect to their impacts on air quality.
Funding
This research is supported in part by the National Science Foundation (NSF) under grant 1137732, the U.S. Department of Transportation (USDOT) under grant DTRT12GUTC17, and the U.S. Department of Homeland Security (DHS) under grant 2014-ST-062-000057-02. The contents of this paper reflect our views, and we are responsible for the facts and the accuracy of the data presented.
Additional information
Funding
Notes on contributors
Yi Qi
Yi Qi is an Associate Professor in the Department of Transportation Studies at Texas Southern University, USA.
Ameena Padiath
Ameena Padiath is a Graduate Research Assistant in the Department of Transportation Studies at Texas Southern University, USA.
Qun Zhao
Qun Zhao is an Research Associate in the Department of Transportation Studies at Texas Southern University, USA.
Lei Yu
Lei Yu is a Professor in the Department of Transportation Studies at Texas Southern University, USA.
References
- Al-Deek, H., R. Wayson, and A.E. Radwan. 1995. Methodology for evaluating ATIS impacts on air quality. J. Transport. Eng. 121(4):376–84. doi:10.1061/(ASCE)0733-947X.
- Barth, M., and K. Boriboonsomsin. 2008. Real-world carbon dioxide impacts of traffic congestion. Transport. Res. Rec. 2058(November):163–71. doi:10.3141/2058-20.
- Bigazzi, A.Y., and M. Figliozzi. 2011. An analysis of the relative efficiency of freeway congestion mitigation as an emission reduction strategy. http://trid.trb.org/view.aspx?id=1092840.
- Dowling, R., W. Kittelson, J. Zegeer, and A. Skabardonis. 1997. Planning techniques to estimate speeds and service volumes for planning applications. NCHRP Report, no. 387. http://trid.trb.org/view.aspx?id=575498.
- Hu, H., B.M. Williams, N.M. Rouphall, A.J. Khattak, and X. Zhou. 2009. Modeling the role of transportation information in mitigating major capacity reductions in a regional network. Transport. Res. Rec. 2138(2138):75–84. doi:10.3141/2138-11.
- Jiménez-Palacios, J.L. n.d. Understanding and quantifying motor vehicle emissions with vehicle specific power and TILDAS remote sensing. https://dspace.mit.edu/handle/1721.1/44505#files-area
- Levinson, D.M. 2007. The value of advanced traveler information systems for route choice. SSRN Scholarly paper ID 1010245. Rochester, NY: Social Science Research Network. http://papers.ssrn.com/abstract=1010245.
- Papson, Andrew, Seth Hartley, and Kai-Ling Kuo. 2012. Analysis of emissions at congested and uncongested intersections with Motor Vehicle Emission Simulation 2010. Transport. Res. Rec. 2270(1):124–31. doi:10.3141/2270-15.
- Qi, Y., H. Teng, and L. Yu. 2004, Statistical microscale emission models incorporating acceleration and deceleration, ASCE J. Transport. Eng. 130(3):348–60. doi:10.1061/(ASCE)0733-947X(2004)130:3(348)
- Smit, R., A.L. Brown, and Y.C. Chan. 2008. Do air pollution emissions and fuel consumption models for roadways include the effects of congestion in the roadway traffic flow? Environ. Model. Software 23(10–11):1262–70. doi:10.1016/j.envsoft.2008.03.001
- Song, G., and L. Yu. 2011. Characteristics of low-speed vehicle-specific power distributions on urban restricted-access roadways in Beijing. Transport. Res. Rec. 2233:91. doi: 10.3141/2233-11.
- Transportation Research Board. 2010. Highway Capacity Manual 2010, 5th ed. Washington, DC: Transportation Research Board of the National Academies.
- U.S. Department of Transportation Federal Highway Administration. 2010. Advances in project level analyses (Final report). Report no. 10.10.001/9005.000. Washington, DC.
- U.S. Environmental Protection Agency. 2010a. MOVES2010 Highway Vehicle Population and Activity Data. Washington, DC.
- U.S. Environmental Protection Agency. 2010b. Motor Vehicle Emission Simulator (MOVES) User’s Guide. U.S. Environmental Protection Agency. http://www3.epa.gov/otaq/models/moves (accessed October 15, 2015).
- U.S. Environmental Protection Agency. 2010c. Using MOVES in project-levelcarbon monoxide analyses. EPA-420-B-10-041, Washington, DC.
- U.S. Environmental Protection Agency. 2015. Exhaust Emission Rates for Light-Duty On-road Vehicles in MOVES2014. EPA-420-R-15-005, Washington, D.C.
- Wardrop, J.G. 1952. Some theoretical aspects of road traffic research. ICE Proc. Engineering Divisions 1(3):325–62. doi:10.1680/ipeds.1952.11259.
- Yu, L., Z. Wang, F. Qiao, and Y. Qi. 2008. Vehicle emission characteristics-based approach to the development and evaluation of driving cycles for classified roads, Transport. Res. Rec. 2058:58–67. doi:10.3141/2058-08