
ABSTRACT
Recently, air pollution has attracted a substantial amount of attention in China, which can be influenced by a variety of factors, but the association between air pollution and human activity is not quite clear. Based on real-time online data (January 1, 2014, to December 31, 2014) of air pollution and meteorology reported by official sites, and demographic, economic, and environmental reform data in a statistical yearbook, the influences of meteorological factors (temperature, relative humidity, precipitation intensity, and wind force) and human activities on PM2.5 pollution were explored. After correlation analysis, logistic regression analysis, and a nonparametric test, weak negative correlations between temperature and PM2.5 pollution were found. In most cases, festival and morning peak hours were protection and risk factors of PM2.5 pollution, respectively. In addition, government actions, such as an afforestation project and increasing financial expenditure for energy saving and environmental protection, could greatly contribute to alleviating pollution of PM2.5. The findings could help officials formulate effective laws and regulations, and then PM2.5 pollution related to the pattern of human activity would be ameliorated.
Implications: Most of the time, festival and morning peak hours are protection and risk factors for PM2.5 pollution, respectively. Increasing the percentage of afforestation area and financial expenditure for energy saving and environmental protection could significantly reduce PM2.5 pollution. The findings can help officials formulate effective laws and regulations, and then PM2.5 pollution related to the pattern of human activity, especially government action, will be ameliorated.
Introduction
As the most rapidly growing major economy, China has been increasingly threatened by environmental deterioration (Choi et al., Citation2013). Especially in recent years, air pollution characterized by particulate matter has become an increasingly serious issue in the most developed regions of China (van Donkelaar et al., Citation2010). A relevant study showed that particulate matter less than 2.5 μm (PM2.5) was the most common major air pollutant in China from 2013 to 2014 (Wang et al., Citation2014).
The increasingly severe air pollution could result in a series of consequences, especially adverse health effects (Gouveia and Fletcher, Citation2000; Wang and Mauzerall, Citation2006). A previous study revealed that particulate matter could lead to changes in the lung tissue and a decrease in lung function, causing an increase in the incidence of respiratory symptoms and mortality from cardiopulmonary diseases (Pope et al., Citation1995). There were significant associations between the daily concentrations of particulate matter less than 10 μm (PM10), sulfur dioxide (SO2), carbonic oxide, and respiratory mortality in children (Conceicao et al., Citation2001). Additionally, adverse pregnancy outcomes and premature mortality were found to occur more frequently (Bell et al., Citation2007). All of these consequences would lead to an increase in the economic costs of health while influencing the quality of life (Darcin, Citation2014; Vienneau et al., Citation2015).
The foundation for the improvement of air quality was a comprehensive and in-depth study on atmospheric pollutants, and many researchers had reported their findings based on long-term and large-scale studies. Some researchers analyzed the distribution features (Hu et al., Citation2014; Su et al., Citation2015; Wang et al., Citation2014), the association of pollutants with meteorology (Tran and Molders, Citation2011; Su et al., Citation2015), or the composition of pollutants (Cheng et al., Citation2015), but only a few discussed the influence of human activity, especially activity that could be easily affected by policy. Therefore, despite its decision-making ability, it is difficult for the government to play an effective role in the control of air pollution.
Based on the national real-time air quality monitoring system, this study was carried out in Ningbo, Zhejiang, China (120°55’–122°16’ east longitude and 28°51’–30°33’ north latitude), which suffered from relatively serious PM2.5 pollution. The associations of PM2.5 with the activity patterns of local residents were analyzed after adjusting four meteorological factors, and the correlations between PM2.5 and governmental actions were explored in this study. The findings could contribute to strengthening the management of the environment. Furthermore, based on the findings of this study, the local governments of other developed cities in China, such as Beijing, Shanghai, and Guangzhou, could take some effective measures for reducing air pollution.
Methods
Data collection
Ningbo is a subprovincial city, with a total population of 5.8378 million in 2014 (Ningbo Municipal Statistics Bureau [NMSB], Citation2015). Ningbo is a commercial city. In addition, chemical industry, the textile and garment industry, and the machinery industry are the three pillars of industry in Ningbo. The total land area of Ningbo is more than 9000 km2, which includes six districts, two counties, and three county-level cities (Liu and Borthwick, Citation2011). Ningbo has a typical subtropical monsoon climate. The annual mean precipitation is approximately 1480 mm, and the annual mean temperature (T) is approximately 16.4°C (Zhao et al., Citation2013). In general, Ningbo is a typical, prosperous coastal city in eastern China. The air quality in this economically developed city could be easily influenced by industry and traffic (Fang et al., Citation2015).
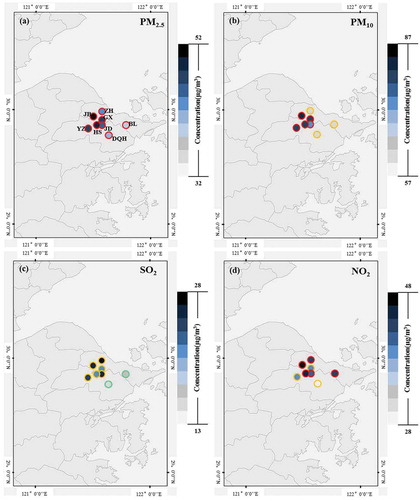
There are eight national air quality monitoring stations in Ningbo. These stations are located in six districts, namely, Beilun (BL), Yinzhou (YZ), Zhenhai (ZH), Jiangbei (JB), Jiangdong (JD), and Haishu (HS), and a scenic spot named Dongqianhu (DQH) and a technology development zone called Gaoxin (GX) (). Each station measures the concentrations of several ambient air pollutants in real time, such as PM2.5, PM10, SO2, and nitrogen dioxide (NO2), followed by publishing the hourly updates on the concentrations of pollutants on their website (China National Environmental Monitoring Centre [CNEMC], Citation2014). In addition, the meteorological data of BL, YZ, and ZH are also regularly published online by the China Meteorological Administration every hour, and include T, relative humidity (RH), precipitation intensity (PI), and wind force (WF) (China Meteorological Administration [CMA], Citation2014). The demographic, economic, and environmental reform data can be retrieved from the Ningbo Statistical Yearbook (NMSB, Citation2015).
Figure 1. Distributions of PM2.5, PM10, SO2 and NO2 annual average concentrations in eight national air quality monitoring stations located in Ningbo. (a) Abbreviations of eight sites: Beilun (BL); Yinzhou (YZ); Zhenhai (ZH); Jiangbei (JB); Gaoxin (GX); Dongqianhu (DQH); Jiangdong (JD); Haishu (HS). The filler color indicates pollutant concentration. The border color indicates severity of pollution; to be specific, green means that annual average concentrations is under or equal to grade I standard (PM2.5: 15 μg/m3, PM10: 40 μg/m3, SO2: 20 μg/m3, NO2: 40 μg/m3), yellow means that annual average concentrations is above grade I standard but under or equal to grade II standard (PM2.5: 35 μg/m3, PM10: 70 μg/m3, SO2: 60 μg/m3, NO2: 40 μg/m3), and red means that annual average concentrations is above grade II standard.
Data collection began on January 1, 2014, and lasted for 1 year. Neither the hourly pollutant concentrations nor the hourly meteorological data for a particular time point could be retrieved from the website if they had been replaced by data for the next time point. Therefore, a special script was written for capturing the screen at regular intervals and automatically saving the records in a local file. Two of the authors separately collected the data and compared them with each other every week to ensure the accuracy and stability of screen capturing. However, sometimes the computers or the Internet did not work properly, so some screens could not be captured in time. The percentages of the recorded valid (hourly data recorded by collectors were the same) hourly average concentrations were 95.86% (PM2.5), 93.57% (PM10), 93.60% (SO2), and 95.06% (NO2), and close to 99.93% (T: 26261 hours; RH: 26262 hours; PI: 26262 hours; WF: 26261 hours) of the hourly meteorological data in a year were used.
Calculation of concentration
The daily concentration of each pollutant from each monitoring station was the arithmetic mean of the 24 hourly (0:00 a.m. to 11:00 p.m.) concentrations. The requirement for data validation was that the daily concentration in a monitoring station would be calculated when 20 or more hourly data had been collected in one day; otherwise, the daily data were specified as missing. The daily concentration of each air pollutant in the city was the arithmetic mean of the daily concentrations at different monitoring stations (Ministry of Environmental Protection [MEP], Citation2012a; MEP, Citation2013). For good representativeness, we calculated the daily concentration for Ningbo only when six or more daily concentrations from the eight sites were valid. Therefore, on a regular day, if three or more monitoring stations did not have valid daily concentration data, then we specified the concentration in Ningbo for that day as missing.
To calculate the annual and monthly concentrations of each air pollutant normatively, this study also used the latest national standard for environmental protection (MEP, Citation2013), which is to use the arithmetic mean of the daily concentration.
Statistical analysis
Using correlation analysis, in this study we explored the associations of the concentration of PM2.5 with four meteorological factors and several demographic, economic, and environmental factors. When the p values of the normality tests were higher than 0.05, the Pearson correlation analysis was carried out, while the Spearman correlation analysis was used when the condition of bivariate normality was not met.
When the sample was not suitable for analysis of variance (Levene test: p < 0.01 or abnormal distribution), the Kruskal–Wallis H test would be used to analyze the difference in distributions. Otherwise, one-way analysis of variance would be carried out. Dunnett’s t-test and least significant difference (LSD) t-test were chosen for multiple contrast tests.
Using ordinal logistic regression analysis, the odds ratios under different meteorological conditions and human activity situations could be calculated. The dependent variables consisted of five levels (PM2.5: ≤35.0 μg/m3, 35.1–75.0 μg/m3, 75.1–115.0 μg/m3, 115.1–150.0 μg/m3, >150.0 μg/m3) (MEP, Citation2012b). The independent variables, which included the four meteorological factors, also consisted of five levels, as follows: T: ≤5.0°C, 5.1–14.0°C, 14.1–20.0°C, 20.1–25.0°C, >25.0°C; RH: ≤20.0%, 20.1–40.0%, 40.1–60.0%, 60.1–80.0%, >80%; PI: 0.0 mm/hr, 0.1–2.5 mm/hr, 2.6–8.0 mm/hr, 8.1–16.0 mm/hr, >16.0 mm/hr; WF: 0 grade (0.0–0.2 m/sec), 1 grade (0.3–1.5 m/sec), 2 grade (1.6–3.3 m/sec), 3 grade (3.4–5.4 m/sec), >3 grade (>5.4 m/sec). The variables named workday and commute times consisted of three levels each (workday: weekday = 1, weekend = 2, and festival = 3; commute times: morning peak = 1, evening peak = 2, and off-peak = 3). In general, weekend included the regular two days off, and festival included holidays due to traditional festivals, that is, New Year’s Day (January 1, 2014), Spring Festival (from January 31, 2014, to February 6, 2014), Tomb-Sweeping Day (April 5–7, 2014), May Day (May 1–3, 2014), the Dragon Boat Festival (from May 31, 2014, to June 2, 2014), the Mid-Autumn Festival (September 6–8, 2014), and National Day (October 1–7, 2014). Considering the policy in China, according to which people should work during some two days off before or after festivals, we classified those into the weekday group rather than the weekend group. The morning peak hour was from 6:00 a.m. to 9:00 a.m., and the evening peak hour was from 5:00 p.m. to 8:00 p.m. Based on the astronomical classification method, the year was classified into four categories, that is, spring (from March 21, 2014, to June 20, 2014), summer (from June 21, 2014, to September 22, 2014), autumn (from September 23, 2014, to December 21, 2014), and winter (from January 1, 2014, to March 20, 2014, and from December 22, 2014, to Dec 31, 2014).
Results
Spatial and temporal variations of four air pollutants
The percentage of valid daily concentrations in Ningbo and the eight national monitoring stations are shown in . With the exception of PM10 in YZ, the percentages of the valid daily concentrations in Ningbo and the eight national monitoring stations were more than 90%. The annual pollutant concentration from each air quality monitoring station was calculated, and the spatial distribution of each pollutant is presented in ( indicates the locations of the eight monitoring stations; all of the stations were named after the sites in which they were located). By contrast, the degree of SO2 pollution was minimal, with all eight regions being within the grade II standard (60 μg/m3) mentioned in the national standards. However, each area was severely polluted with PM2.5. The annual average concentration to maintain a grade II standard was 35 μg/m3, but none was lower than that (MEP, Citation2012a).
Table 1. Percentages of valid daily concentrations of four pollutants in Ningbo and the eight national monitoring stations.
Based on the data from the eight national air quality monitoring stations, the monthly average concentrations of four pollutants in Ningbo are shown in . It is clear that the concentrations of all pollutants were the highest in December, while they sharply decreased in February. In addition, the average concentration of each pollutant in summer (from June to August) was far less than that in winter (from December to February). Moreover, the degree of PM2.5 pollution was within the grade II standard (MEP, Citation2012a) only for four months (from June to September), which was the worst in four air pollutants.
Figure 2. Distributions of PM2.5, PM10, SO2 and NO2 monthly average concentrations in Ningbo (based on data in eight national air quality monitoring stations). The national standard of annual average concentrations is as follows: (1) Grade I, PM2.5: 15 μg/m3, PM10: 40 μg/m3, SO2: 20 μg/m3, NO2: 40 μg/m3; (2) Grade II, PM2.5: 35 μg/m3, PM10: 70 μg/m3, SO2: 60 μg/m3, NO2: 40 μg/m3.
The relationships between the concentration of PM2.5 and meteorological factors
The characteristics of the meteorological data in BL, YZ, and ZH are shown in . The mean temperature was comfortable (mean ± SD: 17.04 ± 8.37°C), while the humidity was high (mean ± SD: 76.17 ± 16.76%). In addition, the distribution of hourly PM2.5 concentrations in those three districts was positive-skewed and non-normal. Based on data from BL, YZ, and ZH, the correlation analysis shows moderate correlations between RH and PI, WF, while it shows a slightly negative correlation between T and the concentration of PM2.5 ().
Table 2. Characteristics of meteorological data and hourly PM2.5 concentration in Beilun, Yinzhou and Zhenhai districts.
Table 3. Spearman correlation coefficients between the meteorological data, PM2.5 concentrations, and the meteorological data in Beilun, Yinzhou, and Zhenhai districts.
Based on the data from BL, YZ, and ZH, the variations of hourly meteorological data under different grades of hourly PM2.5 concentration are shown in . The correlation analyses under different grades of PM2.5 pollution demonstrated very weak negative correlations between PM2.5 hourly concentration and the four meteorological factors under some conditions, which was basically consistent with the conclusion from .
Figure 3. Variations of temperature, relative humidity, precipitation intensity, wind force (box plot), and Spearman correlation coefficient between hourly PM2.5 concentration and meteorological data (line chart) under different grades of PM2.5 pollution (based on hourly data in Beilun, Yinzhou and Zhenhai district). The grades of hourly PM2.5 concentration and wind force are as follows, respectively: (1) PM2.5: Grade I ≤35.0 μg/m3, Grade II: 35.1–75.0 μg/m3, Grade III: 75.1–115.0 μg/m3, Grade IV: 115.1–150.0 μg/m3, Grade V: >150.0 μg/m3; (2) Wind force: 0 grade ≤0.2 m/sec, 1 grade: 0.3–1.5 m/sec, 2 grade: 1.6–3.3 m/sec, 3 grade: 3.4–5.4 m/sec, >3 grade: >5.4 m/sec. The triangle on the solid line means p value in correlation analysis is less than 0.01. The heavy line in the middle of box means the 50th percentile. The whiskers represent minimum and maximum, respectively. The box shows the 25th and 75th percentile.
The results of the ordinal logistic regression analysis, to evaluate the influence of meteorological factors, are shown in (n = 25,178). The hourly concentrations of PM2.5 and the hourly meteorological data from BL, YZ, and ZH were included. As shown in , high temperature, strong wind, and moderate precipitation (PI ≤ 8.0 mm/hr) were protective factors with regard to PM2.5 pollution. The influence of T on the concentration of PM2.5 was significant even after adjusting RH, PI, and WF, and the positive effect of strong wind could also be found after adjusting the other three meteorological factors. However, RH seemed to have no significant influence on PM2.5 pollution in this study.
Table 4. Relationships between the level of PM2.5 concentration and the different meteorological conditions in Beilun, Yinzhou, and Zhenhai districts (the other three factors were adjusted).
The relationships between PM2.5 concentrations and the pattern of human activities
shows that the concentrations of PM2.5 were significantly lower during festivals, when data from the eight monitoring stations were included. Two peaks could be detected in the distribution of the hourly PM2.5 concentrations in , , and , and occurred during the morning peak hour and during or after the evening peak hour, respectively. During the morning peak hour, the concentrations of PM2.5 on weekdays were significantly higher than that on weekends (Dunnett’s t-test: p < 0.05). On the contrary, they seemed to be higher on weekends than on weekdays during the evening peak hour (Dunnett’s t-test: p > 0.05).
Figure 4. Distributions of hourly PM2.5 concentrations (P25, Pa50, and P75) in Ningbo (the data in eight monitoring stations were included). (a) Distribution for year-round;. (b) Distribution for weekday. (c) Distribution for weekend. (d) Distribution for festival. The solid line means yearly average concentration and the dash line means the national standard of annual average concentrations (35 μg/m3). The heavy middle line means the 50th percentile. The whiskers represent the 25th and 75th percentile, respectively.
The ordinal logistic regression analysis showed the effect of workday on the PM2.5 pollution in BL, YZ, and ZH more clearly (). Throughout the year, the average (hourly PM2.5 concentrations) during festivals (arithmetic mean = 36.09) was lower than that during weekdays (arithmetic mean = 44.32) and weekends (arithmetic mean = 43.76), and festival was a significant protective factor with regard to PM2.5 pollution in BL, YZ, and ZH, after adjusting the four meteorological factors. The stratification analysis showed that the results for the different categories were not the same, as festival in summer and weekend in winter became risk factors.
Table 5. Workday effect of PM2.5 pollution in Beilun, Yinzhou, and Zhenhai districts after adjusting the four meteorological factors.
demonstrates that in BL, YZ, and ZH, the PM2.5 pollution during morning peak hour was more severe than that during the rest of the day, except in summer, after adjusting the four meteorological factors and the workday factor. This year, the average value of hourly PM2.5 concentrations for off-peak period (arithmetic mean = 42.96) was significantly higher than that of the evening peak period (arithmetic mean = 40.90, LSD t-test: p < 0.05).
Table 6. Commute-time effect of PM2.5 pollution in Beilun, Yinzhou, and Zhenhai districts after adjusting the four meteorological factors and workday factor.
Finally, based on data from BL, YZ, ZH, JB, JD, and HS, the correlations between demographic, economic, and environmental reform factors (density of population; financial expenditure for energy saving and environmental protection per unit area; percentage change of afforested area) and PM2.5 pollution were explored (). The results of the correlation analysis demonstrated that increasing the percentage of forested area was likely to significantly reduce the PM2.5 pollution. Moreover, the correlation between the financial expenditure for energy saving and environmental protection (the amount of funds raised and allocated by the department of finance for energy saving and environmental protection) per unit area in 2014 and the annual PM2.5 concentration of the same year was not statistically significant. However, we found that the financial expenditure for energy saving and environmental protection per unit area in 2013 quite possibly had a positive effect on reducing the PM2.5 pollution in 2014 (Pearson correlation analysis: r = –0.90, p = 0.01).
Table 7. Demographic, economic, and environmental reform characteristics of six districts in 2014 and their correlations with yearly average concentration of PM2.5.
Discussion
The characteristics of the meteorological data () were consistent with the previous study (Zhao et al., Citation2013). A weak negative correlation between PM2.5 pollution and T was found in this study ( and and ), which had also been mentioned in another reported study (Tran and Molders, Citation2011). One of the potential reasons for the relationship between T and the concentration of PM2.5 was the effect of T on gas-to-particle conversion (Strader et al., Citation1999; Sheehan and Bowman, Citation2001). Moreover, the lower the surface T was, the lower the convective boundary layer depth was likely to be (Pal et al., Citation2012). Low mixed layer depths could result in high concentrations of atmospheric aerosol (Tiwari et al., Citation2015). In a previous study, strong positive correlations were observed between the frequency of haze days and the frequency of windless days (days with an average wind speed of less than 3 m/sec) and rainless days (days with a precipitation of less than 0.1 mm) (Su et al., Citation2015), which was similar to our findings. It had also been reported that wind direction could lead to the advection of PM2.5 from upwind sources (Chu et al., Citation2009). In China, the PM2.5 pollution in the North China Plain (NCP) is heavier than that in the Yangtze River Delta (YRD) (Hu et al., Citation2014), which could cause the wind blowing from Siberia in autumn and winter to transport pollutants from the cities in the NCP region (such as Langfang, Tianjin, and Tangshan) to those in the YRD region (such as Shanghai, Ningbo, and Nanjing). Therefore, in our further study, it is necessary to combine wind direction with the other four meteorological factors (T, RH, PI, and WF) while forecasting the possibility of a haze day.
The effect of workday has been implied in this study. In the analysis of temporal variations, we found that the highest points of all pollutants were in December, but they declined sharply in February (). In a previous study, another developed city in eastern China was taken as the sample site. It was reported that during winter, the average concentration of polycyclic aromatic hydrocarbons (PAHs) in PM2.5 was the highest in the pre-Spring-Festival period, while it was lowest during the Spring Festival. The main sources of PM2.5-associated PAHs during the non-Spring-Festival period were coal combustion, traffic emission, industrial processes, and petroleum (Kong et al., Citation2015). The highest average concentration of PAHs was observed during the pre-Spring-Festival, suggesting that industrial activities might be the most intense during this period in the winter in Ningbo. Before the end of the year, factories increase production rapidly to reach the annual production target, causing the emissions to increase rapidly too. With the arrival of the Spring Festival, factories were shut down one by one, causing the emissions to decrease gradually. Another study indicated that fireworks could result in an increase in the PM2.5 concentration during the Spring Festival (Jiang et al., Citation2015). In China, people were accustomed to display fireworks during festivals, such as the Spring Festival. To reduce the air pollution and maintain order in society, the time and place for firework displays were limited in some cities, but Ningbo was not one of them. People were allowed to display fireworks at anytime and anywhere, making it difficult to evaluate the influence of fireworks on the air quality in this study. Based on the temporal distribution of PM2.5 pollution in this study, we speculated that in winter the influence of fireworks is smaller than industrial activities with regard to PM2.5 pollution in Ningbo. Generally, festival was a protective factor for PM2.5 pollution in Ningbo, but the stratification analysis showed a different pattern (). Festival was a risk factor in summer. One possible explanation for this could be that in summer, only 3 days (September 6–8, 2014) fall in the festival category, which was far less than in the other seasons (spring: 9 days, autumn: 7 days, winter: 8 days), giving rise to some extrema that might have resulted in a Type I error. We considered those extrema to be a result of the cultural traditions in China, where many families gather together for the Mid-Autumn Festival, leading to heavy traffic and automobile exhaust emissions. In addition, this study showed that weekend in winter was also a risk factor. This was probably because in winter, the enterprise leaders let workers work overtime during the weekends to reach the annual targets. Moreover, the Chinese make special purchases before the Spring Festival and going out by private car might be a better choice than by bus or subway on a cold weekend, increasing the frequency of car usage on weekends. Both of these factors could lead to an increase in the PM2.5 concentration on the weekends in winter. However, in this study, the festival changed to a protective factor again in winter, probably due to the temporary closure of almost all of the factories in the Spring Festival. Further research should be conducted on the temporal variations of traffic flow and industrial air emissions to test the hypotheses just mentioned. The degree of PM2.5 pollution on weekdays was much more severe than that during the festivals, which means we were causing harm to ourselves in creating wealth (Lim et al., Citation2012). The negative correlation between the financial expenditure for energy saving and environmental protection per unit area in 2013 and PM2.5 pollution in 2014 () suggested that this type of government action might have a long-term impact rather than short-term effects, as the administrators of factories need time to purchase and install equipment to promote efficiency, energy saving, and environmental protection. Therefore, there might be an urgent need to initiate a new industrial revolution for equilibrating the relationship between PM2.5 pollution and economics, similar to the low-carbon revolution for reducing the greenhouse effect (Sugden et al., Citation2012). Improving the energy and the industrial setup should be given more attention in the future (Yuan et al., Citation2015) in order to ensure the sustainable growth of economics (Death, Citation2014).
The effect of commute time has also been evaluated in this study. The apparent peaking of the hourly PM2.5 concentrations during the morning peak hour on weekdays () suggested that the PM2.5 concentration in Ningbo could be closely associated with the work hours of local residents. Higher values of hourly PM2.5 concentration during the morning peak hour might be due to the relatively fixed time when people go to work. Upon comparing the average of the off-peak group and the evening peak group for a whole year in , we found that the former was higher, probably due to the vibrant nightlife of local residents, the relatively low temperature at midnight, or other unknown factors. shows that increasing the forested area might quite possibly be beneficial for reducing the PM2.5 pollution, mainly because the trees, especially a combination of conifer and broadleaf species (Yang et al., Citation2015), could remove the PM2.5 in the air by dry deposition (Nowak et al., Citation2013). Moreover, woods could act as a protective screen that could trap the PM2.5 from distant places. These findings demonstrated that everyone could contribute to improving the air quality by initiatives such as reducing the use of private cars and participating in tree planting. The government can formulate policies and measures to execute staggered shifts for the traffic system to reduce the commute time for each person (Zong et al., Citation2013), as well as the PM2.5 from vehicle emissions (Cheng et al., Citation2015). In addition, it had been proved that in afforested areas, the annual average PM2.5 concentration decreased by 0.57 μg/m3. Therefore, a series of official afforestation projects could be considered for reducing PM2.5 pollution (Chen et al., Citation2014). In addition, this study did not find a statistically significant relationship between the density of population and the PM2.5 pollution, which might be due to the small sample size (inadequate statistical power).
With economic development, air pollution has become a critical issue in the majority of cities in China. This study used Ningbo as a sample site to analyze the relationship between PM2.5 pollution and meteorological factors, as well as the pattern of human activity. The findings were beneficial for implementing effective prevention and control measures to reduce PM2.5 pollution. However, there are certain limitations. First, the locations of the major PM2.5 sources could not be shown, due to a lack of budget and free public data. Some potential variables such as traffic emissions and industrial emissions were not analyzed, although they might be confounding factors in the statistical analysis. Statistical correlations between PM2.5 pollution and afforestation change and financial expenditures were found in this study, but they might be false correlations because the measured concentrations of PM2.5 were easily influenced by PM2.5 emissions and afforestation nearby. Second, the shortage of public data resulted in the effect of wind direction not being analyzed and some sites not being included while analyzing the influences of demographic, economic, and environmental reform factors (the missing data were as follows: density of population and financial expenditure for energy saving and environmental protection per unit area in DQH and GX; the percentage change of afforested area in JD, HS, DQH, and GX). Third, the observations in the logistic regressions were not completely independent, which means the statistical results were not precise and accurate enough. Finally, the observation was limited in space and time. There might be a lack of socioeconomic gradient in the eight closely located sites and a short period of study. Furthermore, based on data over 1 year, we could not control the influence of PM2.5 sources mentioned in the first limitation when we analyzed the relationship between socioeconomic factors and PM2.5 pollution. Therefore, we should collect data over a longer time and a larger area to obtain more precise results.
Conflicts of interest
The authors declare no conflicts of interest.
Ethical statements
There are no ethical issues in this study.
Funding
We thank the Research Center for Air Pollution and Health, Zhejiang University, for its financial support to the research project. We are also grateful to the editor and anonymous reviewers for their helpful comments and suggestions.
Additional information
Funding
Notes on contributors
Chengzhen Bao
Chengzhen Bao is a graduate student who implemented the research.Pengfei Chai is a researcher in the cooperating organization of Zhejiang University.Hongbo Lin is a researcher in the cooperating organization of Zhejiang University.Zhenyu Zhang is a graduate student who implemented the research.Zhenhua Ye is a graduate student who implemented the research.Mengjia Gu is a graduate student who implemented the research.Huaichu Lu is a researcher in the cooperating organization of Zhejiang University.Peng Shen is a researcher in the cooperating organization of Zhejiang University.Mingjuan Jin is a professor who developed and revised the research plan.Jianbing Wang is a professor who developed and revised the research plan.Kun Chen is a professor who developed and revised the research plan.
References
- Bell, M.L., K. Ebisu, and K. Belanger. 2007. Ambient air pollution and low birth weight in Connecticut and Massachusetts. Environ. Health Perspect. 115(7):1118–24. doi:10.1289/ehp.9759
- Chen, L., C.L. Liu, T. Pan, C.C. Chen, Z. Li, H.H. Wang, X. Pei, and L. Sun. 2014. Assessment of the effect of PM2.5 reduction by plain afforestation project in Beijing based on dry deposition model. Chin. J. Ecol. 33(11): 2897–904.
- Cheng, Y., S.C. Lee, Z.L. Gu, K.F. Ho, Y.W. Zhang, Y. Huang, J.C. Chow, J.G. Watson, J.J. Cao, and R.J. Zhang. 2015. PM2.5 and PM10-2.5 chemical composition and source apportionment near a Hong Kong roadway. Particuology 18:96–104. doi:10.1016/j.partic.2013.10.003
- Choi, Y., N. Zhang, S.C. Chen, and C.C. Luo. 2013. Quantitative ecological risk analysis by evaluating China’s eco-efficiency and its determinants. Hum. Ecol. Risk Assess. 19(5): 1324–37. doi:10.1080/10807039.2013.791205
- Chu, N.J., J.B. Kadane, and C.I. Davidson. 2009. Identifying likely PM2.5 sources on days of elevated concentration: A simple statistical approach. Environ. Sci. Technol. 43(7): 2407–11. doi:10.1021/es801548z
- China Meteorological Administration, Beijing, 2014. Weather China. http://en.weather.com.cn ( accessed December 1, 2014).
- China National Environmental Monitoring Centre, Beijing, 2014. The National Urban Air Quality Real-time Publishing Platform. http://113.108.142.147:20035/emcpublish ( accessed December 1, 2014).
- Conceicao, G.M.S., S.G.E.K. Miraglia, H.S. Kishi, P.H.N. Saldiva, and J.M. Singer. 2001. Air pollution and child mortality: A time-series study in Sao Paulo, Brazil. Environ. Health Perspect. 109:347–50. doi:10.2307/3434781
- Darcin, M. 2014. Association between air quality and quality of life. Environ. Sci. Pollut. Res. 21(3): 1954–59. doi:10.1007/s11356-013-2101-3
- Death, C. 2014. The green economy in South Africa: Global discourses and local politics. Politikon 41(1): 1–22. doi:10.1080/02589346.2014.885668
- Fang, C.L., H.M. Liu, G.D. Li, D.Q. Sun, and Z. Miao. 2015. Estimating the impact of urbanization on air quality in China using spatial regression models. Sustainability 7(11): 15570–92. doi:10.3390/su71115570
- Gouveia, N., and T. Fletcher. 2000. Time series analysis of air pollution and mortality: Effects by cause, age and socioeconomic status. J. Epidemiol. Commun. Health 54(10): 750–55. doi:10.1136/jech.54.10.750
- Hu, J.L., Y.G. Wang, Q. Ying, and H.L. Zhang. 2014. Spatial and temporal variability of PM2.5 and PM10 over the North China Plain and the Yangtze River Delta, China. Atmos. Environ. 95:598–609. doi:10.1016/j.atmosenv.2014.07.019
- Jiang, Q., Y.L. Sun, Z. Wang, and Y. Yin. 2015. Aerosol composition and sources during the Chinese Spring Festival: Fireworks, secondary aerosol, and holiday effects. Atmos. Chem. Phys. 15(11): 6023–34. doi:10.5194/acp-15-6023-2015
- Kong, S.F., X.X. Li, L. Li, Y. Yin, K. Chen, L. Yuan, Y.J. Zhang, Y.P. Shan, and Y.O. Ji. 2015. Variation of polycyclic aromatic hydrocarbons in atmospheric PM2.5 during winter haze period around 2014 Chinese Spring Festival at Nanjing: Insights of source changes, air mass direction and firework particle injection. Sci. Total Environ. 520:59–72. doi:10.1016/j.scitotenv.2015.03.001
- Lim, S.S., T. Vos, A.D. Flaxman, G. Danaei, K. Shibuya, H. Adair-Rohani, M. Amann, H.R. Anderson, K.G. Andrews, M. Aryee, et al. 2012. A comparative risk assessment of burden of disease and injury attributable to 67 risk factors and risk factor clusters in 21 regions, 1990–2010: A systematic analysis for the Global Burden of Disease Study 2010. Lancet 380(9859): 2224–60. doi:10.1016/S0140-6736(12)61766-8
- Liu, R.Z., and A.G.L. Borthwick. 2011. Measurement and assessment of carrying capacity of the environment in Ningbo, China. J. Environ. Manage. 92(8): 2047–53. doi:10.1016/j.jenvman.2011.03.033
- Ministry of Environmental Protection, Beijing, 2012a. Ambient air quality standards. http://www.cnemc.cn/news/downLoad.jsp?filePath=/resource/crm/newsUploadFile/106/1331072093716_3837.pdf&describe=%BB%B7%BE%B3%BF%D5%C6%F8%D6%CA%C1%BF%B1%EA%D7%BCGB3095_2012 ( accessed December 1, 2014).
- Ministry of Environmental Protection, Beijing, 2012b. Technical regulation on ambient air quality index (on trial). http://www.cnemc.cn/news/downLoad.jsp?filePath=/resource/crm/newsUploadFile/106/1331073639984_9455.pdf&describe=%BB%B7%BE%B3%BF%D5%C6%F8%D6%CA%C1%BF%D6%B8%CA%FD%A3%A8AQI%A3%A9%BC%BC%CA%F5%B9%E6%B6%A8%A3%A8%CA%D4%D0%D0%A3%A9%A3%A8HJ633_2012%A3%A9 ( accessed December 1, 2014).
- Ministry of Environmental Protection, Beijing, 2013. Technical regulation for ambient air quality assessment (on trial). http://kjs.mep.gov.cn/hjbhbz/bzwb/dqhjbh/jcgfffbz/201309/W020131105548549111863.pdf.
- Ningbo Municipal Statistics Bureau, Zhejiang, 2015. Ningbo Statistical Yearbook 2015. http://www.nbstats.gov.cn/tjnj/2004njbg.htm ( accessed December 1, 2015).
- Nowak, D.J., S. Hirabayashi, A. Bodine, and R. Hoehn. 2013. Modeled PM2.5 removal by trees in ten US cities and associated health effects. Environ. Pollut. 178:395–402. doi:10.1016/j.envpol.2013.03.050
- Pal, S., I. Xueref-Remy, L. Ammoura, P. Chazette, F. Gibert, P. Royer, E. Dieudonne, J.C. Dupont, M. Haeffelin, C. Lac, M. Lopez, Y. Morille, and F. Ravetta. 2012. Spatio-temporal variability of the atmospheric boundary layer depth over the Paris agglomeration: An assessment of the impact of the urban heat island intensity. Atmos. Res. 63:261–75. doi:10.1016/j.atmosenv.2012.09.046
- Pope, C.A., D.V. Bates, and M.E. Raizenne. 1995. Health effects of particulate air pollution: Time for reassessment. Environ. Health Perspect. 103(5): 472–80. doi:10.2307/3432586
- Sheehan, P.E., and F.M. Bowman. 2001. Estimated effects of temperature on secondary organic aerosol concentrations. Environ. Sci. Technol. 35(11): 2129–35. doi:10.1021/es001547g
- Strader, R., F. Lurmann, and S.N. Pandis. 1999. Evaluation of secondary organic aerosol formation in winter. Atmos. Environ. 33(29): 4849–63. doi:10.1016/S1352-2310(99)00310-6
- Sugden, D., J. Webb, and A. Kerr. 2012. Climate change, sustainability and the need for a new industrial revolution in Scotland. Earth Environ. Sci. Trans. R. Soc. Edinburgh 103(2): 125–32. doi:10.1017/S1755691013000029
- Su, B.D., M.J. Zhan, J.Q. Zhai, Y.J. Wang, and T. Fischer. 2015. Spatio-temporal variation of haze days and atmospheric circulation pattern in China (1961–2013). Quat. Int. 380:14–21. doi:10.1016/j.quaint.2014.11.044
- Tiwari, S., G. Pandithurai, S.D. Attri, A.K. Srivastava, V.K. Soni, D.S. Bisht, V.A. Kumar, and M.K. Srivastava. 2015. Aerosol optical properties and their relationship with meteorological parameters during wintertime in Delhi, India. Atmos. Res. 153:465–79. doi:10.1016/j.atmosres.2014.10.003
- Tran, H.N.Q., and N. Molders. 2011. Investigations on meteorological conditions for elevated PM2.5 in Fairbanks, Alaska. Atmos. Res. 99(1): 39–49. doi:10.1016/j.atmosres.2010.08.028
- van Donkelaar, A., R.V. Martin, M. Brauer, R. Kahn, R. Levy, C. Verduzco, and P.J. Villeneuve. 2010. Global estimates of ambient fine particulate matter concentrations from satellite-based aerosol optical depth: Development and application. Environ. Health Perspect. 118(6): 847–55. doi:10.1289/ehp.0901623
- Vienneau, D., L. Perez, C. Schindler, C. Lieb, H. Sommer, N. Probst-Hensch, N. Kunzli, and M. Roosli. 2015. Years of life lost and morbidity cases attributable to transportation noise and air pollution: A comparative health risk assessment for Switzerland in 2010. Int. J. Hyg. Environ. Health 218(6): 514–21. doi:10.1016/j.ijheh.2015.05.003
- Wang, X.P., and D.L. Mauzerall. 2006. Evaluating impacts of air pollution in China on public health: Implications for future air pollution and energy policies. Atmos. Environ. 40(9): 1706–21. doi:10.1016/j.atmosenv.2005.10.066
- Wang, Y.G., Q. Ying, J.L. Hu, and H.L. Zhang. 2014. Spatial and temporal variations of six criteria air pollutants in 31 provincial capital cities in China during 2013–2014. Environ. Int. 73:413–22. doi:10.1016/j.envint.2014.08.016
- Yang, J., Y.M. Chang, and P.B. Yan. 2015. Ranking the suitability of common urban tree species for controlling PM2.5 pollution. Atmos. Pollut. Res. 6(2): 267–77. doi:10.5094/APR.2015.031
- Yuan, X.L., R.M. Mu, J. Zuo, and Q.S. Wang. 2015. Economic development, energy consumption, and air pollution: A critical assessment in China. Hum. Ecol. Risk Assess. 21(3): 781–98. doi:10.1080/10807039.2014.932204
- Zhao, W.C., J.P. Cheng, Z.Y. Yu, Q.L. Tang, F. Cheng, Y.W. Yin, and W.H. Wang. 2013. Levels, seasonal variations, and health risks assessment of ambient air pollutants in the residential areas. Int. J. Environ. Sci. Technol. 10(3): 487–94. doi:10.1007/s13762-013-0178-3
- Zong, F., Z.C. Juan, and H.F. Jia. 2013. Examination of staggered shifts impacts on travel behavior: A case study of Beijing, China. Transport 28(2): 175–85. doi:10.3846/16484142.2013.803263