
ABSTRACT
Periods of abnormally high concentrations of atmospheric pollutants, defined as air pollution episodes, can cause adverse health effects. Southern European countries experience high particulate matter (PM) levels originating from local and distant sources. In this study, we investigated the occurrence and nature of extreme PM10 (PM with an aerodynamic diameter ≤10 μm) pollution episodes in Greece. We examined PM10 concentration data from 18 monitoring stations located at five sites across the country: (1) an industrial area in northwestern Greece (Western Macedonia Lignite Area, WMLA), which includes sources such as lignite mining operations and lignite power plants that generate a high percentage of the energy in Greece; (2) the greater Athens area, the most populated area of the country; and (3) Thessaloniki, (4) Patra, and (5) Volos, three large cities in Greece. We defined extreme PM10 pollution episodes (EEs) as days during which PM10 concentrations at all five sites exceeded the European Union (EU) 24-hr PM10 standards. For each EE, we identified the corresponding prevailing synoptic and local meteorological conditions, including wind surface data, for the period from January 2009 through December 2011. We also analyzed data from remote sensing and model simulations. We recorded 14 EEs that occurred over 49 days and could be grouped into two categories: (1) Local Source Impact (LSI; 26 days, 53%) and (2) African Dust Impact (ADI; 23 days, 47%). Our analysis suggested that the contribution of local sources to ADI EEs was relatively small. LSI EEs were observed only in the cold season, whereas ADI EEs occurred throughout the year, with a higher frequency during the cold season. The EEs with the highest intensity were recorded during African dust intrusions. ADI episodes were found to contribute more than local sources in Greece, with ADI and LSI fraction contribution ranging from 1.1 to 3.10. The EE contribution during ADI fluctuated from 41 to 83 μg/m3, whereas during LSI it varied from 14 to 67 μg/m3.
Implications: This paper examines the occurrence and nature of extreme PM10 pollution episodes (EEs) in Greece during a 3-yr period (2009–2011). Fourteen EEs were found of 49 days total duration, classified into two main categories: Local Source Impact (53%) and African Dust Impact (47%). All the above extreme PM10 air pollution episodes were the result of specific synoptic prevailing conditions. Specific information on the linkages between the synoptic weather patterns and PM10 concentrations could be used in the development of weather/health-warning system to alert the public that a synoptic episode is imminent.
Introduction
Air quality is an important factor with significant implications for human health. International air quality standards have been adopted with the aim of reducing environmental pollution, reducing exposure, and improving health outcomes. These standards are specific to each type of pollutant and are stated in terms of hourly, daily, and annual limits for primary pollutants (e.g., sulfur dioxide [SO2], nitrogen oxides [NOx], particulate matter [PMx]) or in hourly, 8-hr average, and daily limits for secondary pollutants (e.g., ozone [O3]) (World Health Organization [WHO], Citation2000; European Commission [EC], Citation2008, Directive 2008/50/EC). However, these legislated limits are often breached, especially in urban industrial areas, as well as in areas that are affected by desert dust storms originating mostly from North Africa (Dayan et al., Citation1991; Gerasopoulos et al., Citation2006; Kleanthous et al., Citation2009; Querol et al., Citation2009; Achilleos et al., Citation2014). Specific meteorological processes, from the local to the global scale, might increase the concentration of specific pollutants for several consecutive days (Kallos et al., Citation1993; Dayan and Levy, Citation2005; Flocal et al., Citation2009). Periods of time in which pollutant concentrations exceed a specified threshold value are defined as air pollution episodes.
Air pollution episodes can be broadly categorized into two classes according to the main source of the pollutants: those caused by local and/or regional emissions, and those caused by long-range transport of polluted air masses (Kukkonen et al., Citation2005). These two general categories can be further classified by influencing factors. Regional air pollution episodes are usually caused by stationary and/or mobile sources or random incidents such as random wildfires in landfills, where toxic substances may be released in the atmosphere. Furthermore, regional episodes can be affected by synoptic-mesoscale meteorological conditions, such as stagnant anticyclonic systems, which are often associated with the highest concentration levels and/or poor air dispersion conditions in an area (Kallos et al., Citation1993; Triantafyllou, Citation2001; Watson and Chow, Citation2002; Flocas et al., Citation2009; Kassomenos et al., Citation2014). The most significant air pollution episodes are caused by synoptic-mesoscale meteorological effects involving recirculation of air masses and/or the long-range transport of polluted air masses. The long-range transport of African and Arabian Peninsula dust in particular is considered to have a major impact on the severity of air pollution episodes (e.g., Querol et al., Citation2004; Kallos et al., Citation2007).
Air pollution episodes attributed to adverse synoptic-mesoscale meteorological conditions usually lead to poor ventilation and weaker dispersion in an area. Additionally, when these episodes are prolonged, there is an absence of vertical motion and the atmosphere’s stratification is normally stable. Moreover, wind patterns near the surface are weak or dominated by calms, which favor the development of strong temperature inversions. Under these conditions, the emitted pollutant concentrations become trapped and travel within the planetary boundary layer. Urban mega cities and industrial areas particularly suffer from the severe air quality problems caused by these episodic meteorological patterns, mostly due to emissions from increased traffic and industrial activities.
Long-range transport of desert dust poses a significant threat to air quality and environmental health. Dust aerosols also significantly alter the energy balance of the Earth system due to changes in absorption and scattering of radiation in the atmosphere and optical properties of clouds. The importance of these latter effects was highlighted in the Intergovernmental Panel on Climate Change (IPCC) assessment report (IPCC, Citation2007). Gaps in our understanding of the processes governing dust generation and transport are still under investigation, as reported in a recent review by Shao et al. (Citation2011). The Sahara Desert is considered to be the biggest dust source on Earth as reported by previous studies (e.g., Luo et al., Citation2003; Ginoux et al., Citation2004), with estimated emissions of approximately 1000 Mt yr−1. Saharan dust episodes occur frequently across the Mediterranean region both in the southwest (e.g., Rodrigues et al., Citation2004) and in the southeast (e.g., Gerasopoulos et al., Citation2006), and Saharan dust transport has also been reported to cross the Atlantic to Central America (Prospero, Citation1996). The frequency of exposure to desert dust has increased in the eastern Mediterranean at an average rate of 1.7 days per year (Achilleos et al., Citation2014). The areas affected by the long-range transport of desert dust have far higher PM10 (PM with an aerodynamic diameter ≤10 μm) concentrations, which can exceed the legislative limits and cause significant air pollution that is associated with adverse health effects.
In this study, we examined PM10 concentration data from 18 monitoring stations located across Greece over a 3-yr period (2009–2011). These monitoring stations record the air quality in five locations in Greece. The first is a heavy industrial area in northwestern Greece (Western Macedonia Lignite Area, WMLA), which contains lignite mines and lignite power stations and produces the greatest amount of electricity in Greece. The second location is the “Greater Athens Area,” which includes the capital of Greece and is the most populated part of the country. The three additional areas are Thessaloniki, the second most populated city; Patra, the third most populated urban area; and Volos, a medium-sized city in Greece (“Greater Thessaloniki Area,” “Patras Area,” and “Volos Area”). Based on monitoring station data, we identified days during which the mean PM10 concentration exceeded the European Union (EU) 24-hr PM10 standard concurrently in all five monitoring areas; these days were characterized as extreme episode (EE) days and were further analyzed based on the prevailing synoptic- and local-scale meteorological conditions.
The goal of this study was to characterize EEs and their contribution to PM10 concentrations using modeling techniques, synoptic surface/upper maps, remote sensing observations, and field measurements. Our findings will expand our understanding of the meteorological conditions resulting in extreme air pollution episodes and will enable more accurate forecasting that will make it possible to alert the public in a timely manner to reduce exposure and their risk of adverse health effects of air pollution.
Material and methods
Description of study areas
Western Macedonia Lignite Area (WMLA)
Western Macedonia is a mountainous area with complex terrain located in the northwestern part of Greece. The area is characterized as broad, relatively flat bottom basin surrounded by tall mountains. There is also one artificial lake in the southern section and four natural lakes in the northern and northwestern sections of the area (). The climate is continental Mediterranean, with low temperatures in the winter and high ones in the summer, with strong temperature inversions during the year (Triantafyllou et al., Citation1995). The prevailing winds in the center of the basin are weak to moderate and are mostly from the northwest/southeast direction due to channeling of the synoptic wind, since the northwest/southeast axis coincides with the major geographical axis of the basin (Triantafyllou, Citation2000, Citation2001). More than 150,000 people live and work in the WMLA basin. In this area, four lignite power plant stations are operated by the Greek Public Power Corporation (GPPC) and they generate the greatest proportion of electrical energy produced in Greece. The lignite used by these power plant stations is mined in nearby open-pit mines and is transported to the stations by rail trucks and conveyor belts. The emissions arising from lignite mining and burning are mostly particles (fly ash and fugitive dust). Suspended particles appear to be the most serious source of air pollution in the area (Triantafyllou et al., Citation2000, Citation2006, Citation2013; Karagiannidis et al., Citation2013).
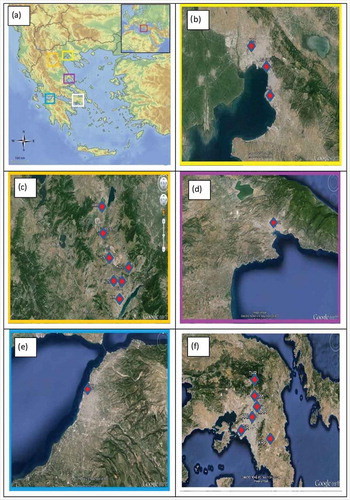
Figure 1. Study areas. (a) Map of Greece and the (b) Greater Thessaloniki Area, (c) Western Macedonia Lignite Area, (d) Volos Area, (e) Patras Area, and (f) Greater Athens Area. The locations of the monitoring sites in each area are shown as red diamonds.
Greater Athens Area
The Greater Athens Area is situated on the southeastern edge of the Greek mainland (). It is the largest and most populated plain of Greece and the seventh most populous city in the European Union, with more than 4 million inhabitants. The central part, Attica Basin, covers an area of 450 km2 and has a population density of 7500 inhabitants per square kilometer. The basin is bounded by high mountains on three sides connected by small gaps (). These gaps play an important role in air mass exchange in and out of the basin (Asimakopoulos et al., Citation1992; Helmis et al., Citation1997a). The Greater Athens Area enjoys a typical Mediterranean climate, with hot, dry summers and cold, mild winters. The winds mostly along the north-northeast/south-southwest axis, with prevailing wind direction being north-northeast in summer, fall, and winter and south-southwest in spring and early summer. Traffic and industrial activities are the main air pollution sources in Athens and its surrounding area. The complex topography of the Greater Athens Area makes it difficult to evaluate the dispersion of air masses over the city, especially during low-wind periods that favor high particulate matter concentrations (Kallos et al., Citation1993; Kalabokas et al., Citation1999; Mavrakis et al., Citation2008).
Greater Thessaloniki Area
The city of Thessaloniki, located in central Macedonia in northern Greece, is the second largest urban and industrial center of the country. The Greater Thessaloniki Area covers an area of approximately 200 km2 that is bounded on the east and northeast by Hortiatis Mountain (elevation 1200 m) and on the south by the Thermaikos Gulf, with nearly flat terrain in the west (). It is inhabited by more than 1 million people. The climate of the area can be described as Mediterranean, with generally hot and dry summers and mild and wet winters. The dominant winds are from northwest directions and have an average speed of 5.6 m/sec. The primary pollution sources are vehicular traffic, industrial facilities, and residential heating during winter (Voutsa et al., Citation2002; Moussiopoulos et al., Citation2009; Vlachokostas et al., Citation2013). The development of systems such as of sea/land breeze affects the air pollution levels and frequently contributes to air pollution in the area (Helmis et al., Citation1997b; Kassomenos et al., Citation2011).
Patras Area
Patras is a medium-sized port city surrounded by rural areas that are agricultural and mountainous and located mostly to the west and southwest of the city (). Patras lies across the southern part of Patraikos Gulf and is the third largest city in Greece, with a population of 168,000 inhabitants. The city is 25 km2, of which the built environment is approximately 18 km2 (Stathopoulou et al., Citation2004; Yannopoulos, Citation2007). The climate of the city is Mediterranean, with wet winters and hot, dry summers. Pollution from PM presents an air quality issue for the urban atmosphere of Patras. The major air pollution in the city originates from road and harbor traffic, house central heating, sporadic emissions due to industrial and service enterprises, and background air pollution (Yannopoulos, Citation2008).
Volos Area
Volos is a medium-sized, coastal port city in central Greece, located on the north coast of the Pagasitikos Gulf () The greater urban agglomeration covers approximately 50 km2 and is inhabited by about 120,000 people. Volos has a Mediterranean climate, rarely experiencing extremely high or low temperatures throughout the year. It is the third largest port in Greece and has been developed into an important industrial center, with two industrial areas to the west and a large cement industry to the east of the city. Traffic is occasionally fairly intense due to the city activities, tourism, and the operation of the commercial and passenger port. Volos faces air pollution problems, in some cases similar to those observed in the highly populated urban areas of Athens and Thessaloniki (Karandinos et al., Citation2006; Papanastasiou and Melas, Citation2010).
Data and models
During the 3-yr study period (2009–2011), PM10 concentration measurements were collected from 18 monitoring stations located within the five study areas described above (). Seven of the monitoring stations were located in WMLA, covering an area of approximately 1500 km2. Six monitoring stations were located in the Greater Athens Area, covering an area of approximately 410 km2. Three monitoring stations were located in the Greater Thessaloniki Area, covering an area of approximately 120 km2. The remaining two monitoring stations were located in Patras and Volos, respectively. summarizes the basic characteristics of the monitoring stations used in this study, according to EC directive 2008/50/EC.
Table 1. Characteristics of the monitoring stations used in the study.
Six out of seven monitoring sites in WMLA are operated by the GPPC, and one belongs to the Laboratory of Atmospheric Pollution in the Technological Educational Institute of Western Macedonia. The monitoring sites in all other areas are part of the National Network for Monitoring Air Pollution operated by regional authorities in each area under the guidance and sponsorship of Ministry of Environment and Energy.
For the 3-yr study period, we recorded all extreme PM10 pollution episodes (EEs), defined as days during which the mean PM10 concentration in all five areas exceeded the EU 24-hr PM10 standard of 50 μg/m3. The average value of the daily concentrations of each EE divided by the EU daily legislation limit of 50 μg/m3 was calculated as the episode intensity. For identification and classification of the EEs, a combination of approaches and tools were used, as follows:
Synoptic surface pressure maps by MetOffice
National Centers for Environmental Prediction (NCEP) synoptic pressure meteorological maps at 850 and 500 hPa and surface daily precipitation (mm/day), as well as omega forcing at 700 hPa, retrieved by the Earth System Research Laboratory (ESRL) from the National Oceanic and Atmospheric Administration (NOAA; http://www.esrl.noaa.gov/psd/) (Kalney et al., Citation1996)
Satellite imagery, provided by the National Aeronautics and Space Administration (NASA) SeaWIFS project (http://seawifs.gsfc.nasa.gov/SEAWIFS.html) and by the Moderate Resolution Imaging Spectroradiometer (MODIS)
Hybrid Single-Particle Lagrangian Integrated Trajectory Model (HYSPLIT4; Draxler and Rolph, Citation2003), for long-range transport confirmation. Back trajectories were simulated at different levels, identifying the regions in which air masses interacted. Three-dimensional (3D) back trajectories of air parcels arriving at each area at different altitudes every 3 hr were calculated simultaneously at (1) 500 m above ground level (AGL), well within the boundary layer; (2) 1500 m AGL, at the limits of the nominal boundary layer; and (3) 3000 m AGL, representing the middle and upper troposphere.
The Air Pollution Model (TAPM; Hurley et al., Citation2005; Matthaios et al., Citation2013), for local meteorological and dispersion conditions prevailing during the EE. TAPM is a 3D terrain-following sigma-coordinate, nestable, prognostic meteorological and air pollution model. The model solves fundamental fluid dynamics and scalar transport equations to predict meteorology and pollutant concentration for a range of pollutants important for air pollution applications. TAPM consists of coupled prognostic meteorological and air pollution concentration components. In the present study, TAPM was configured and ran for all five study areas for each EE (with 2 days’ spin-up time), with four nested grid domains at 30, 10, 3, and 1 km, with 25 × 25 horizontal grid points and 25 vertical points, in order to investigate the surface wind field, the dispersion conditions, and the vertical structure of the atmosphere.
Results and discussion
EE classification
During the 3-yr study period, 14 extreme PM10 pollution episodes (EEs) were detected over a total of 49 days. Classification of the EEs based on the contribution of local sources versus long-range transport of pollutants resulted in two categories given below.
Local Source Impact (LSI). Two of the EEs, one spanning 10 days and the other 16 days, were categorized as LSI. EEs in the LSI category occurred during the same time of the year, the first on November 18–27, 2009, and the second from November 19 to December 4, 2011.
African Dust Impact (ADI). Dust events over the Mediterranean are mainly driven by the eastward movement of intense cyclones that are generated by the thermal contrast between cold Atlantic air and warm continental air that crosses North Africa. In addition, seasonal depressions generated in desert regions cause dust erosion and favor uplift at the upper atmospheric levels and transport over long distances (Astitha et al., Citation2008; Meloni et al., Citation2008). Twelve EEs were identified in the ADI category, spanning 23 days, each lasting from 1 to 6 days. These EEs were recorded during all seasons.
The classification of the EEs and some of their characteristics are summarized in . The LSI EEs comprised a larger proportion of EE days (53% of the total EE days), but the mean episode intensity was higher for ADI EEs (2.0) compared with LSI EEs (1.3). Notably, the same monitoring stations detected a higher maximum episode intensity for ADI EEs compared with LSI EEs. In WMLA, the maximum episode intensity was detected by a monitoring station (Pontokomi) in an industrial-residential site (3.1 for LSI EEs and 5.3 for ADI EEs), whereas the minimum episode intensity was detected by a monitoring station in an agricultural site (Koilada monitoring station). Maximum episode intensities in the Greater Athens Area, Greater Thessaloniki Area, Patras Area, and Volos Area were detected by monitoring stations located in the cities’ centers, near urban-traffic sources. In the Greater Athens Area, maximum episode intensities were 2.5 for LSI EEs and 8.4 for ADI EEs (detected by the ARI monitoring station). Similarly, in the Greater Thessaloniki Area, the maximum intensities were 3 for LSI EEs and 5.1 for ADI EEs (detected by the AG. SOF monitoring station).
Table 2. Classification of extreme PM10 pollution episodes in Greece, 2009–2011.
Data analysis and simulations
Local Source Impact category
PM10 concentrations and meteorological patterns
We investigated the meteorological conditions that occurred during the LSI EEs. Adverse meteorological conditions were observed in the same month for each LSI EE (November) in 2009 and 2011. In particular, during November of 2009 in the WMLA, a 10-day EE was observed, which was primarily the result of the synoptic setting of the middle and lower troposphere (Karagiannidis et al., Citation2013). Between November 19 and December 4 of 2011, a second 15-day EE was observed. During these EEs, an omega block followed by a high-over-low pattern in southern Europe formed a boundary layer that favored trapping of pollutants and led to high PM10 concentrations.
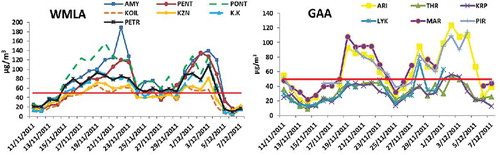
shows the mean PM10 concentration levels reported by all the monitoring stations in each of the five study areas during the two LSI EEs in November 2009 and November 2011. The highest mean PM10 concentrations that occurred during the 2009 LSI EE were recorded in the Greater Thessaloniki Area, followed by the Volos Area and the WMLA. During the 2011 EE, the Greater Thessaloniki Area again reported the highest mean PM10 concentrations, followed by WMLA, whereas the Patras Area and Volos Area monitoring sites had no data recordings for that period. shows the daily variations in the PM10 concentrations during the second LSI EE in two of the five areas, and specifically the WMLA and Greater Athens Area. In both areas, a gradual increase in PM10 concentration levels occurred from November 19 to 24, 2011. From November 24 to 28, 2011, the PM10 concentrations in both areas were at moderate levels, whereas from November 28 to December 4, 2011, a new gradual increase occurred.
Figure 2. Mean PM10 concentrations in the Western Macedonia Lignite Area (WMLA), Greater Athens Area (GAA), Greater Thessaloniki Area (GTA), Patras Area (PA), and Volos Area (VA) during the two LSI EEs from November 18 to 25, 2009, and from November 19 to December 4, 2011. The lines in the bars indicate standard deviations.
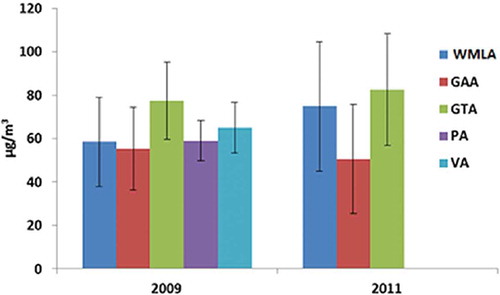
Figure 3. Average daily PM10 concentrations measured in the Western Macedonia Lignite Area (WMLA) and Greater Athens Area (GAA) from November 11 to December 7, 2011. The red horizontal line indicates the daily PM10 concentration limit (50 μg/m3).
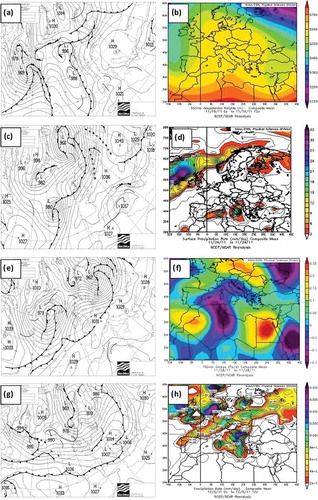
At the beginning of the 2011 LSI EE (November 16, 2011), an anticyclonic system located in central Europe moved southeast and was established over the broader Balkan Peninsula area and consequently over Greece the next day. The anticyclonic circulation became more intense over the next few days as the high-pressure system converted to a stationary system (November 19, 2011) that practically covered the entirety of northern Greece (). In the middle troposphere (500 hPa), the omega block dominated all of Europe by producing a jet stream, which prevented general upper wind circulation (). This meteorological situation lasted 5 days, from November 19 to 23, 2011, and the measured PM10 concentrations during that period were significantly elevated (). On November 24, 2011, an occluded front over the Adriatic () caused precipitation (), while the weak pressure gradient reinforced the surface winds by producing a northerly flow. This kept PM10 concentrations at moderate levels between November 24 and 28, 2011. On November 28, 2011, Greece was covered once again by a strong stagnant anticyclonic system (), which in turn created calms and stability in the atmosphere and favored the development of strong temperature inversions. Subsequently, this led to the accumulation and the gradual increase of pollutants in the lower atmospheric layers until December 4, 2011. Simultaneously, in the middle troposphere from November 28 to December 4, 2011, significant synoptic forcing was absent based on the synoptic chart of the omega vertical velocity (Pa/sec), with values approaching zero in the pressure level of 700 hPa () (note that positive omega velocity means descending motion and vice versa, whereas negative omega velocity means ascending motion). One day later, on December 5, 2011, a deep surface low approached Greece from central Europe (). The strong pressure gradients ahead of this depression strengthened the surface wind field and developed significant upward motions in the middle and lower troposphere, which caused heavy rain in the area (). This low-pressure system resulted in well-ventilated areas, good dispersion and deposition of pollutants, and reduction of the overall PM10 concentration levels.
Figure 4. Synoptic meteorological conditions during the second recorded LSI EE, which occurred between November 19 and December 4, 2011. Synoptic surface pressure maps from (a) November 19, (c) November 24, (e) November 28, and (g) December 5, 2011. (b) Synoptic pressure at 500 mb on November 19, 2011. Precipitation rate (mm/day) on (d) November 24 and (h) December 5, 2011. (f) Omega vertical velocity (Pa/sec) on November 28, 2011.
Simulation results
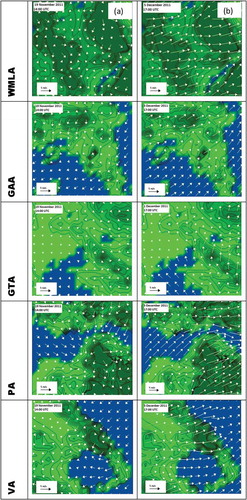
In areas with complex terrain, it is necessary to conduct an in depth investigation of the surface wind field, local circulation systems, and vertical structure of the atmosphere and then apply appropriate modeling techniques to understand the mechanisms that favor pollution episodes (e.g., Kallos et al., Citation1993; Kukkonen et al., Citation2005; Matthaios et al., Citation2014). TAPM was used to simulate the meteorology and dispersion of PM10 in the dominant conditions observed during the LSI EEs. The model results are shown in and . shows the average vertical profile of potential temperatures during the LSI EE from November 19 to December 4, 2011, at specific hours of the day, in all areas of interest. shows the surface wind field, also in all areas, at the beginning () and the end () of the same LSI EE.
Figure 5. Average vertical profile of potential temperature, θ (K), during specific hours, from November 19 to December 4, 2011, in all study areas.
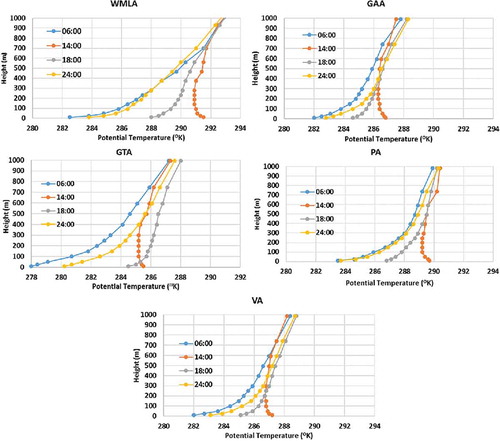
Figure 6. Surface wind field calculated by TAPM in the Western Macedonia Lignite Area (WMLA), Greater Athens Area (GAA), Greater Thessaloniki Area (GTA), Patras Area (PA), and Volos Area (VA) at the (a) beginning and (b) end of the LSI EE in November–December 2011.
As it can be seen in , the potential temperature changed more quickly at lower altitudes as well as during sunrise and sunset periods. In the early morning (06:00), a stable layer was created at an altitude depending on the area, which was much higher in the case of the WMLA. Within this stable layer, a more intense surface-based inversion layer was present, with strength of 3–4 K in the first 200 m. During midday and in particular at 2:00 p.m., the air temperature near the ground was significantly increased and a shallow surface-based convective layer was formed, with a neutral layer up to 300–400 m, depending on the area, and a weak elevated inversion at higher levels. The surface wind was weak, while the development of local circulations was favored (). After the local sunset at 6:00 p.m. and the land cooling, a strong temperature inversion was created up to 100–300 m, depending on the area, as well as a less stable higher layer. At 12:00 a.m., the ground-based inversion reached 300 m, much higher in the case of WMLA, while a less stable layer existed higher up. It is worthwhile to note that temperature fluctuations between early morning and late night and noon hours in the northern regions (WMLA, Greater Thessaloniki Area) ranged from 8 to 10 K, whereas in the southern regions (Greater Athens Area, Patras Area, and Volos Area) the temperature ranged from 4 to 6 K. During most EE days, strong temperature inversions were observed from late afternoon until the early morning hours, and sometimes did not break even during the noon hours; occasionally during the noon hours, a shallow convective layer was formed. The above analysis of the atmospheric boundary layer evolution is consistent with that reported by Helmis et al. (Citation1990) for Athens, and by Triantafyllou et al. (Citation1995) for WMLA. The absence of significant convection in the middle and lower troposphere, combined with a calm or weak horizontal wind field near the surface and a reduced mixing height, resulted in pollutant trapping and accumulation of PM10 near the ground.
The change in the synoptic circulation starting on December 5 resulted in the prevalence of moderate to strong surface winds in all study areas, from the south to western direction, depending on the specific topographic characteristics of each area (), resulting in good ventilation and dispersion conditions and the end of the 2011 LSI EE.
African Dust Impact category
PM10 concentrations and meteorological patterns
The ADI EEs occurred in all seasons of the study period. There were a total of 12 ADI EEs, which occurred for a total of 23 days. Seven ADI EEs (12 days’ total duration) were observed during the cold period (November, December, January, February), two (7 days’ total duration) were observed during the warm period (May, June, July, August), and three (4 days’ total duration) were observed during transition periods (March, April and September, October).
In the cold period, the synoptic conditions indicated a surface low-pressure or a surface-deep low-pressure system, the front of which extended from North Africa to Greece or the Adriatic Sea, established in the central Mediterranean, and moved eastward. A trough was often associated with these low systems, which was located in central Europe and sometimes extended above the North African coasts.
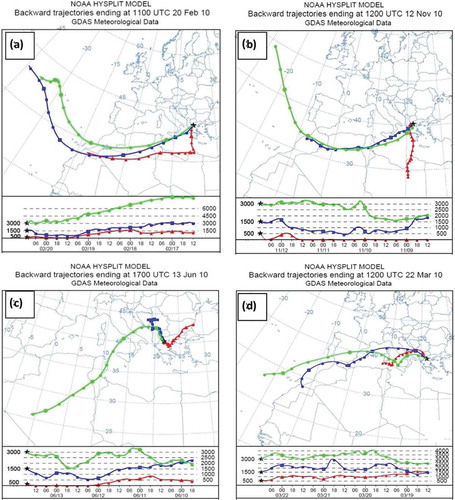
One ADI EE occurred on February 20, 2010 (), when a surface low extended from North Africa to Greece, and ahead of this depression’s front, there were strong pressure gradients, both at the surface and at 850 hPa (, ), extending across the eastern Mediterranean. A trough was linked with this surface barometric low system, which was located in central Europe and extended above the North African coast. This trough at 700 hPa () resulted in violent storm winds (30–35 m/sec) in the central and eastern Mediterranean at 500 hPa (). Such synoptic conditions resulted in southern–southwestern winds from Libya, Tunis, and Algeria towards Italy and Greece, which enabled the transport of African dust in all atmospheric layers from near surface to near the tropopause. According to Nastos (Citation2012), these dust storms were more intense than those originating from northwestern Africa (mainly Algeria, Mauritania, and Mali), although the latter appeared more frequently, as indicated in a study by Barkan et al. (Citation2005) and in a time-series analysis during 1979–2011 reported by Varga et al. (Citation2013).
In the warm period, the synoptic conditions showed African dust transport when surface low-pressure systems generated above the North African coasts due to differential heating between the cold Mediterranean Sea and the hot Sahara Desert or when the weak pressure gradients of an anticyclone extended from North Africa to the eastern Mediterranean or southeastern Europe. In the higher atmospheric layers, a trough above central or western Europe and a ridge above North Africa extended to the central and central-eastern Mediterranean was seen during the warm period.
Another ADI EE occurred on June 13–18, 2010. The surface anticyclone located over the coasts of northwestern Africa transported desert particles over the central and eastern Mediterranean (). During this EE, in the lower tropospheric layers at 850 hPa and at 700 hPa, the Iberian Peninsula was covered by a trough, combined by a ridge in the central and eastern Mediterranean, which favored warm advection throughout the atmospheric column (, , ). In the middle troposphere (), strong gale winds (18–22 m/sec) developed above Algeria, Tunis, and the central Mediterranean that reached Greece as a fresh to strong breeze (8–12 m/sec). The stable summer weather was associated with sunny and cloudless conditions, as well as the near absence of precipitation over the Mediterranean, which increased the dust aerosol residence time. Therefore, summer dust events affecting Greece from southwestern directions had a rather large duration (six consecutive days in this case) and were mainly detected at an elevated layer in the atmosphere. During similar synoptic conditions, Meloni et al. (Citation2008) reported two extreme air pollution episodes in the central Mediterranean in August 1999 and in July 2002, with 13 consecutive days’ duration.
During the transition period, synoptic conditions that favored dust transport were short time depressions, which quickly attenuated. Cases representative of each period are detailed below. shows the satellite images and the corresponding meteorological surface and upper atmosphere maps for each of these cases.
Figure 7. Images and maps of African dust transport in Greece during a representative (a) cold period (February 20, 2010), (b) warm period (June 13–18, 2010), and (c) transition period (March 22–23, 2010). (I) Satellite image, (II) surface pressure map, (III) geopotential height 850 hPa, (IV) anomaly at 700 hPa, (V) vector winds at 500 hPa.
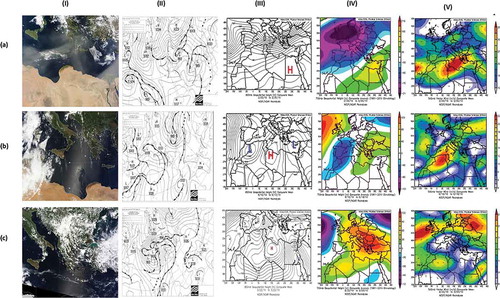
Regarding the transition period ADI EEs, a representative case occurred on March 22–23, 2010 (). On that day, a surface depression was generated in the Gulf of Gabes in Tunis and moved quickly in a northeastern direction. A strong ridge was depicted at 850 hPa above northern Africa, extending above Italy and Greece (III). A characteristic feature was a positive anomaly (120) at 700 hPa, which indicated a strong convection in eastern and central Europe. In the middle troposphere at 500 hPa, gale winds (18–21 m/sec) developed in the northwestern African region, weakening to gentle breeze winds (8–12 m/sec) as they moved northeasterly across the Mediterranean (V). Early spring is a period that favors depressions above the Mediterranean. These depressions are generated by temperature differences that exist between the warm North African soil and cold Mediterranean waters or between cold Atlantic air and warm continental air due to the location of the Intertropical Convergence Zone, both of which cross North Africa during the spring (Rodriguez et al., Citation2001; Kallos et al., Citation2007). The uplift of air masses and dust from the Sahara Desert due to surface heating and their transport through convection towards southern Europe and Greece during our observed ADI EE was also described in a previous study by Kaskaoutis et al. (Citation2008). The duration of these dust events is 1–2 days, since the depressions favoring them move and are quickly attenuated. They are associated with extensive cloud cover over the eastern Mediterranean and Greece, which is generated by the presence of the depression and the uplift of water vapor from the sea. Seasonality of African dust transport across the Mediterranean was also observed by Goudie and Middleton (Citation2001) and Barkan et al. (Citation2005).
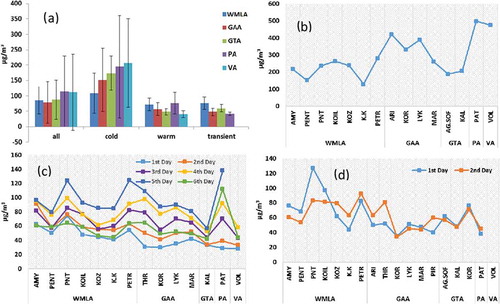
PM10 concentration measurements during the ADI EEs are depicted in . In particular, illustrates the mean concentrations in all areas during all periods and during the representative cold, warm, and transition periods described above, whereas –d depict average daily concentrations, recorded in episodes during these periods. The highest mean PM10 concentrations during ADI EEs were recorded in the Patras Area and Volos Area, followed by the WMLA and Greater Thessaloniki Area, and lastly the Greater Athens Area, with values higher than 80 μg/m3. During cold period (February 20, 2010), the daily PM10 concentration varied from 130 μg/m3 (WMLA) to 500 μg/m3 (Patras Area). Southern areas such as the Patras Area and Greater Athens Area were more affected, whereas more northern areas such as the WMLA and Greater Thessaloniki Area were affected to lesser extent. In the warm period (June 13–18, 2010), the daily PM10 concentrations were higher in the western areas, the Patras Area and WMLA; during the warm period, the transported dust has a southwestern origin, mainly from Tunis or Algeria. The highest daily average PM10 concentration during this warm period ADI EE were recorded in the Patras Area and WMLA, equal to 138 and 124 μg/m3, respectively, both on the fifth day of the EE. Finally, in the transition period (March 22–23, 2010), the highest daily PM10 concentration, equal to 127 μg/m3, was recorded in WMLA.
Figure 8. Mean PM10 concentrations during ADI EEs in Greece for (a) each area (lines in the bars indicate the standard deviations), and daily mean PM10 concentrations during the representative (b) cold period (February 20, 2010), (c) warm period (June 13–18, 2010), and (d) transition period (March 22–23, 2010).
Simulation results
To verify the transport of dust, back-trajectory simulations were performed for each ADI EE day using the HYSPLIT model at different altitudes. Representative trajectories for each period (cold, warm, transition) are presented. The three calculated back trajectories were at 500 m AGL (within the boundary layer), at 1500 m AGL (at the limits of the nominal boundary layer), and at 3000 m AGL (representing the middle and free troposphere). In the HYSPLIT simulations, 4-day backward trajectories were used because this number of days is considered representative for the investigation of long-range transport (Stohl, Citation1998; Kassomenos et al., Citation2010). This technique is suitable for identifying the sources of long-range transported pollution, as reported in several works (e.g., Borge et al., Citation2007; Grivas et al., Citation2008).
In the cold period, the simulation showed two “case paths” at the 500 m AGL. In the first case path, observed on February 20, 2010 (), dusty air masses at 500, 1500, and 3000 m AGL were spotted in the middle or northern Atlantic. Air masses in this category moved from middle/northern Atlantic, passed the northwestern part of Africa, and, after crossing the Gulf of Gabes and the Ionian Sea, arrived in Greece from the southwest. High concentrations of fine particles were reported in literature under this case path (Remoundaki et al., Citation2011, Citation2013). In the second case path, observed on November 12, 2010 (), the air masses were spotted well within North Africa (Sahara Desert) and in the middle and middle southern Atlantic (western Sahara Desert). The dusty air masses well within the Sahara Desert were evident at 500 m AGL and were transported directly to Greece, practically within the boundary layer. The air masses at 1500 and 3000 m AGL moved from the middle southern Atlantic, passed through the whole Saharan region, and arrived in Greece via the Gulf of Gabes and the Ionian Sea.
Figure 9. Back trajectories of air masses arriving at the Kozani monitoring station in WMLA at 500, 1500, and 3000 m AGL in representative (a) cold period (February 20, 2010), (b) cold period (November 12, 2010), (c) warm period (June 13, 2010), and (d) transition period (March 22, 2010) showing long-range transport of African desert dust to Greece.
In the warm period (June 13, 2010), the back-trajectory-simulated air masses at 3000 m AGL in the African region that arrived in northwestern Greece via the Gulf of Gabes after passing southern Italy (). Simultaneously, the air masses at 500 and 1500 m AGL moved towards Greece from the Black Sea and occasionally from the Balkans or southern Italy (not shown here). The area surrounding the Black Sea is considered a reservoir of PM, both anthropogenic and naturally oriented, which under certain atmospheric circulations originates from the surrounding industrial areas of Romania, Ukraine, and Russia (Kallos et al., Citation2007; Grivas et al., Citation2008). Industrial activity in these areas is characterized by outdated production techniques and limited resources for protecting the environment, which results in high air pollutant emissions.
Finally, in the transition period on March 22, 2010 (), the air masses in the back trajectories within the boundary layer (at 500 m AGL) originated in Tunis. After passing over southern Italy and the Adriatic Sea, they arrived in Greece through the Balkan Peninsula. The trajectories at 1500 and 3000 m AGL located in western Sahara Desert and central Atlantic arrived at the Balkan Peninsula in Greece after passing the central Mediterranean. It should be mentioned that another potential back-trajectory pattern (not shown here) was observed during the transition period African dust transport, and these back trajectories originated in southern Italy and Sicily. Dusty air masses were transported southward to North Africa and thereafter entered a completely different dispersion environment, especially during the day (when vertical mixing is strong), and then were transported to higher atmospheric layers and back to Greece though the Ionian Sea. Air masses coming from North Africa were reported only at 3000 m AGL; however, at this altitude, potentially “aged” pollutants from southern Europe might also be observed, as described in Kallos et al. (Citation1998).
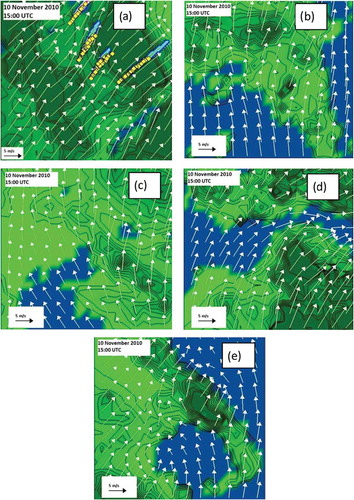
In order to investigate the contribution of local pollution sources during the ADI EEs, wind flow and dispersion patterns of the pollutants from the major local sources from different areas were simulated by TAPM. The model ran for a representative cold period ADI EE (November 10, 2010), as most of the ADI EEs took place during cold periods. The results are shown in . In WMLA, the winds were strong and the dispersion conditions in the area were good, resulting in transportation of pollutants emitted from the power plant stations outside the basin (). Strong southern sector winds were also observed in the Greater Athens Area (), Greater Thessaloniki Area (), Patras Area (), and Volos Area (), which also led to dispersion of pollutants. In the representative warm and transition periods, a similar behavior was found, but with a lower wind speed. The interesting finding here is that during ADI EEs, the local emission sources do not contribute significantly to the observed PM10 concentration levels.
Figure 10. Typical PM10 dispersion conditions in the (a) Western Macedonia Lignite Area (WMLA), (b) Greater Athens Area (GAA), (c) Greater Thessaloniki Area (GTA), (d) Patras Area (VA), and (e) Volos Area (PA) during ADI EEs.
Local sources versus long-range transport
Surface wind—PM10 concentration patterns
We analyzed the correlation between measurements of surface winds and PM10 concentrations during the two EE categories. shows the hourly variation in PM10 concentrations and surface winds during one LSI EE (November 17–19, 2011; ) and one ADI EE (February 20, 2010; ) in WMLA, for which we had the most complete data sets.
Figure 11. Hourly variations in surface wind speed and ground PM10 concentrations measured at three WMLA monitoring stations during a representative (a) LSI EE (17–19 November 2011) and (b) ADI EE (20 February 2010).
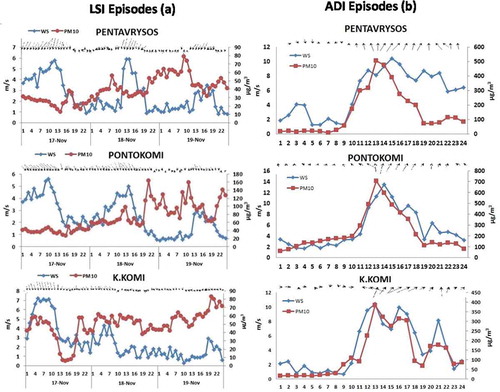
During the LSI EE, a negative correlation between wind speed and PM10 concentration was observed (). The average correlation coefficient between the hourly values of wind speed and PM10 concentration was −0.20, with the decreases and the increases of the PM10 concentration levels following the meteorological framework discussed in section above.
On the contrary, during the ADI EE, a positive correlation between the hourly values of wind speed and PM10 concentration was observed (), with a correlation coefficient of 0.65. Also, high surface winds contributed to high PM10 concentrations because of the dust resuspension when the land was dry (Triantafyllou, Citation2001). The hourly variation in PM10 concentrations follows the respective variations in the wind speed, with a characteristic peak value occurring at the same time for the two variables. During the peak hours, the wind speed at the center of WMLA (monitoring station Pontokomi) reached 15 m/sec in the south sector at the same time the PM10 concentration was equal to 700 μg/m3. Similarly, for the other monitoring sites (Pentavrysos and Kato Komi) the wind speed reached 10 m/sec concurrent with PM10 concentrations of 500 and 400 μg/m3, respectively. Similar patterns as the one presented in were observed between the surface wind speed and the ground-level PM10 concentrations in all ADI EEs.
Contribution of episodes
The contribution of EEs to the PM10 levels in Greece during the LSI EEs and ADI EEs was investigated based on a time-series analysis of PM10 levels applied by Escudero et al. (Citation2007). Using this methodology, the daily regional background levels in a given monitoring station can be obtained by applying a monthly moving 30th percentile to the PM10 time series of the monitoring station after a prior extraction of the days with episodic influence. Then, for a given day under episodic influence, the contribution can be obtained by subtracting the calculated regional background value of the monthly moving 30th percentile from the measured PM10 concentration. This methodology was validated at three regional background sites by comparing the estimated dust load with the experimental crustal load determined in PM10 samples. A strong correlation of 0.65 < R2 < 0.86 was observed in all three cases (Escudero et al., Citation2007). The application of this methodology has been described in several other studies as well (e.g., Querol et al., Citation2009; Pey et al., Citation2013; Alexandropoulou and Lazaridis, Citation2013; Salvador et al., Citation2013). It should be noted that during the month of November, in order for the background to be representative (due to many episodic days), the values used were from a 5-yr period (2007–2011). and depict the PM10 concentrations and the estimated contributions to these PM10 concentrations during LSI EE () and ADI EE () at monitoring sites where the minimum and maximum contributions were recorded in each one of the five study areas.
Figure 12. Contributions of EE LSI to PM10 concentrations (μg/m3) in the Western Macedonia Lignite Area (KOIL MS, PNT MS), Greater Athens Area (THR MS, ARI MS), Greater Thessaloniki Area (AG. SOF MS, KOR MS), Patras Area (PAT MS), and Volos Area (VOL MS).
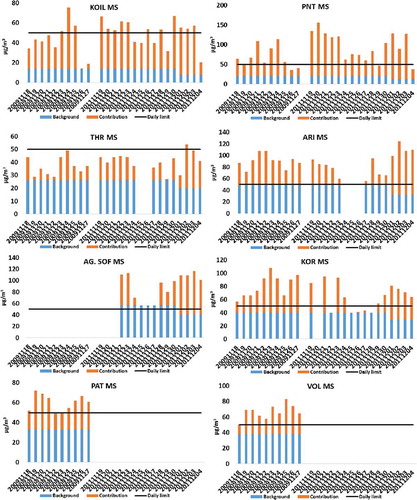
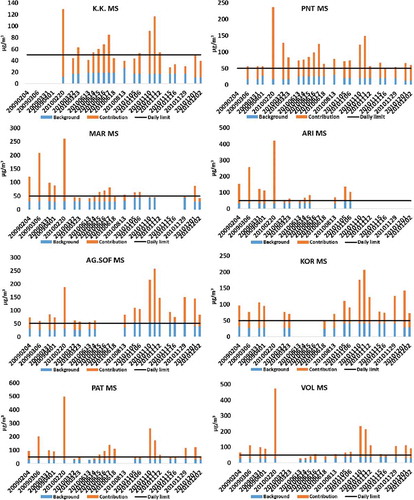
Figure 13. Contributions of ADI EEs to PM10 concentrations (μg/m3) in the Western Macedonia Lignite Area (K.K. MS, PNT MS), Greater Athens Area (MAR MS, ARI MS), Greater Thessaloniki Area (AG.SOF MS, KOR MS), Patras Area (PAT MS), and Volos Area (VOL MS).
During the LSI EEs, the maximum contributions to PM10 were found in WMLA and ranged from 34 μg/m3 (agricultural area, Koilada monitoring station) to 67 μg/m3 (industrial-residential area, Pontokomi monitoring station), with a mean LSI EE contribution of 51 μg/m3, based on data from all seven monitoring stations in WMLA. In the Greater Athens Area, the LSI EE contribution to PM10 ranged from 14 μg/m3 (suburban, Thrakomakedones monitoring station) to 43 μg/m3 (urban-traffic, Aristotelous monitoring station), with a mean contribution of 26 μg/m3 across all six monitoring stations in the area. For local episodes, Paschalidou et al. (Citation2015) followed a different approach to estimate the contribution, which was urban station concentrations minus background station concentrations, and they found that the local increment for air pollution episodes in Greater Athens Area was 58 μg/m3 on average. In the Greater Thessaloniki Area, the LSI EE contribution to PM10 ranged from 17 μg/m3 (urban-traffic, Ag. Sofia monitoring station) to 32 μg/m3 (urban-industrial, Kordelio monitoring station), with a mean contribution of 27 μg/m3 across all three monitoring stations in the area. Regarding the Patras Area and Volos Area, the average LSI EE contribution to PM10 was 27 and 29 μg/m3, respectively. The percentages of the LSI EE contribution to PM10 were 64–74% in WMLA, 34–46% in the Greater Athens Area, 37–40% in the Greater Thessaloniki Area, 44% in the Patras Area, and 42% in the Volos Area ().
During the ADI EEs, the contribution to PM10 in WMLA ranged from 41 μg/m3 (agricultural, Kato Komi monitoring station) to 64 μg/m3 (industrial-residential, Pontokomi monitoring station), with a mean contribution of 55 μg/m3. In the Greater Athens Area, the contribution to PM10 ranged from 43 μg/m3 (suburban, Marousi monitoring station) to 82 μg/m3 (urban-traffic, Aristotelous monitoring station), with a mean contribution of 57 μg/m3. According to the work of Alexandropoulou and Lazaridis (Citation2013), who used the same methodology for the analysis of 9 yr of data (2001–2010) from the Greater Athens Area, most African dust events contributed from 5 to 34 μg/m3 of the daily PM10 concentrations, whereas the average contribution to annual PM10 concentrations was approximately 8.6 ± 1.8 μg/m3. It should be noted that our analysis focuses on EE only and does not include lower intensity ADI episodes. As far as the Greater Thessaloniki Area is concerned, the ADI EE contribution to PM10 ranged from 41 μg/m3 (urban-traffic, Ag. Sofia monitoring station) to 57 μg/m3 (urban-industrial, Kordelio monitoring station), with a 50 μg/m3 mean contribution. For the Patras Area and Volos Area, the contributions to PM10 were 83 and 76 μg/m3, respectively. The percentages of the ADI EE contribution to PM10 were 60–72% in WMLA, 47–63% in the Greater Athens Area, 53–63% in the Greater Thessaloniki Area, 56% in the Patras Area, and 59% in the Volos Area. In a previous study, the respective percentage contributions to PM10 in Spain and Madrid were found to be about the same, ranging from 48% to 66% (Salvador et al., Citation2013).
In summary, during LSI EEs, the highest average EE contribution to PM10 in Greece was observed in the industrialized area of WMLA, with a mean value of 51 μg/m3 (68%). The EE contribution to PM10 in the other examined areas ranged from 26 to 29 μg/m3 (39–44%). During the ADI EEs, the mean contribution to PM10 in all areas was above 50 μg/m3 and ranged from 50 to 83 μg/m3.
A comparison of the contributions of the two categories of EEs to PM10 concentrations in each of the five areas, as well as overall in Greece (mean value of the five areas), is shown in the . The table specifically gives the quotient of mean contribution from ADI EEs and mean contribution from LSI EEs. As it can be seen in the table, the ADI EE contribution is higher than the LSI EE contribution in all study areas and in Greece overall.
Table 3. Percentage contributions of EEs to the PM10 levels in the five study areas.
Table 4. Relative contribution of African Dust Impact (ADI) and Local Source Impact (LSI) extreme episodes to PM10 concentrations in Greece.
Conclusions
The present work investigated extreme PM10 air pollution episodes in five characteristic areas of Greece during the years of 2009, 2010, and 2011, based on PM10 concentration data collected from 18 monitoring stations. Extreme PM10 air pollution episodes defined a period of successive days during which the mean PM10 concentration in all five of the study areas exceeded the EU 24-hr PM10 legislative limits. We identified 14 extreme PM10 air pollution episodes taking place over a total of 49 days. These extreme episodes could be classified into two main categories: (1) Local Source Impact (LSI, 53%) and (2) African Dust Impact (ADI, 47%), with average intensities of 1.3 and 2.0, respectively. LSI extreme PM10 air pollution episodes were observed only during the cold period (November through early December), whereas ADI extreme PM10 air pollution episodes occurred in all seasons, with higher frequency during the cold period.
LSI extreme episodes were generated when an omega blocking pattern gradually transformed to a high-over-low pattern that prevailed over central and southern Europe. Mesoscale simulations showed that absence of significant convection in the middle and lower troposphere, combined with a weak horizontal wind field near the surface and reduced mixing height, resulted in pollutant trapping and increased PM10 concentrations. Measurements indicated that calms or weak surface winds favored the PM10 accumulation, whereas the strong surface winds favored pollutant dispersion. An anticorrelation between wind speed and ground-level PM10 concentrations was found, with a correlation coefficient equal to −0.20. The contribution of the LSI extreme episodes to PM10 concentrations ranged from 14 to 67 μg/m3.
ADI extreme episodes were driven by the eastward movement of intense cyclones, generated by the thermal contrast between cold Atlantic air and warm continental air that crossed North Africa or by seasonal depressions in desert regions that caused dust erosion. Air masses back-trajectory simulations showed three patterns of long-range dust transport, whereas mesoscale simulations showed that local sources do not significantly influence the PM10 concentrations during ADI extreme episodes. Measurement analysis revealed a positive correlation coefficient between wind speed and PM10 concentrations of 0.65, and high PM10 concentrations, in this case due to long-range transport, were linked with strong prevailing surface winds, as result of the synoptic circulation. The contribution of ADI extreme episodes to PM10 concentrations ranged from 41 to 83 μg/m3.
Finally, all the above extreme PM10 air pollution episodes were the result of specific synoptic prevailing conditions, and the contribution to PM10 concentration of the ADI extreme episodes was 1.10–3.10 times higher than the contribution of the LSI extreme episodes.
Acknowledgment
The authors would like to thank the Greek Power Public Corporation for providing data from the Amyntaio, Pentavrysos, Pontokomi, Koilada, Petrana, and Kato Komi monitoring stations. The authors would also like to acknowledge NASA/Goddard Space Flight Center, SeaWIFS NASA Project, the MODIS team, and the NOAA/ESRL Physical Sciences Division, Boulder, Colorado, for their contribution of satellite and synoptic images. The authors gratefully acknowledge the NOAA Air Resources Laboratory (ARL) for the provision of the HYSPLIT transport and dispersion model and READY Web site (http://www.arl.noaa.gov/ready.html) used in this publication.
Additional information
Notes on contributors
Vasileios N. Matthaios
Vasileios N. Matthaios, M.Sc., is a researcher at the Laboratory of Atmospheric Pollution and Environmental Physics, Department of Environmental Engineering and Pollution Control, Technological Educational Institution (TEI) of Western Macedonia, Kozani, Greece.
Athanasios G. Triantafyllou
Athanasios G. Triantafyllou, Ph.D., is a professor, head of the Laboratory of Atmospheric Pollution and Environmental Physics, Department of Environmental Engineering and Pollution Control, Technological Educational Institution (TEI) of Western Macedonia, Kozani, Greece.
Petros Koutrakis
Petros Koutrakis, Ph.D., is a professor of environmental science at the School of Public Health, Harvard University, Boston, MA, USA.
References
- Achilleos, S., J.S. Evans, P.K. Yiallouros, S. Kleanthous, J. Schwartz, and P. Koutrakis. 2014. PM10 concentration levels at an urban and background site in Cyprus: The impact of urban sources and dust storms. J. Air Waste Manage. Assoc. 64:1352–1360. doi:10.1080/10962247.2014.923061
- Aleksandropoulou, V., and M. Lazaridis. 2013. Identification of the influence of African dust on PM10 concentrations at the Athens Air Quality Monitoring Network during the period 2001–2010. Aerosol Air Qual. Res. 13:1492–1503. doi:10.4209/aaqr.2012.12.0363
- Asimakopoulos, D.N., D.G. Deligiorgi, C. Drakopoulos, C. Helmis, K. Kokkori, D.P. Lalas, D. Sikiotis, and C. Varotsos. 1992. An experimental study of nighttime air-pollutant transport over complex terrain in Athens. Atmos. Environ. B 26:59–71. doi:10.1016/0957-1272(92)90037-S
- Astitha, M., G. Kallos, and P. Katsafados. 2008. Air pollution modeling in the Mediterranean region: Analysis and forecasting of episodes. Atmos. Res. 89:358–364. doi:10.1016/j.atmosres.2008.03.006
- Barkan, J., P. Alpert, H. Kutiel, and P. Kishcha. 2005. Synoptics of dust transportation days from Africa toward Italy and central Europe. J. Geophys. Res. 110:D07208. doi:10.1029/2004JD005222
- Borge, R., J. Lumbreras, S. Vardoulakis, P. Kassomenos, and E. Rodríguez. 2007. Analysis of long-range transport influences on urban PM10 using two-stage atmospheric trajectory clusters. Atmos. Environ. 41:4434–4450. doi:10.1016/j.atmosenv.2007.01.053
- Dayan, U., and I. Levy. 2005. The influence of meteorological conditions and atmospheric circulation types on PM10 and visibility in Tel Aviv. J. Appl. Meteorol. 44:606–619. doi:10.1175/JAM2232.1
- Dayan U., J. Miller, and G. Gutman. 1991. Dust intrusion events into the Mediterranean basin. J. Appl. Meteol. 30:1185–1199. doi:10.1175/1520-0450(1991)030<1185:DIEITM>2.0.CO;2
- Draxler, R.R., and G.D. Rolph. 2003. HYSPLIT (HYbrid Single-Particle Lagrangian Integrated Trajectory) model. Access via NOAA ARL READY Web site. NOAA Air Resources Laboratory, Silver Spring, MD. http://www.arl.noaa.gov/ready/hysplit4.html ( accessed May 2014).
- European Commission (EC). 2008. Council Directive 2008/50/EC, on ambient air quality and cleaner air for Europe. Official Journal of the European Union 2008(L152), 1–44.
- Escudero, M., X. Querol, J. Pey, A. Alastuey, N. Perez, F. Ferreira, E. Cuevas, S. Rodrıguez, and S. Alonso. 2007. A methodology for the quantification of the net African dust load in air quality monitoring networks. Atmos. Environ. 41:5516–5524. doi:10.1016/j.atmosenv.2007.04.047
- Flocas, H., Kelessis A., Helmis C., Petrakakis M., Zoumakis M., and Pappas K. 2009. Synoptic and local scale atmospheric circulation associated with air pollution episodes in an urban Mediterranean area. Theor. Appl. Climatol. 95:265–277. doi:10.1007/s00704-008-0005-9
- Gerasopoulos E., G. Kouvarakis, P. Babasakalis, M. Vrekoussis, J.P. Putaud, and N. Mihalopoulos. 2006. Origin and variability of particulate matter (PM10) mass concentrations over the Eastern Mediterranean. Atmos. Environ. 40:4679–4690. doi:10.1016/j.atmosenv.2006.04.020
- Ginoux, P., J.M. Prospero, O. Torres, and M. Chin. 2004. Long-term simulation of dust distribution with the GOCART model: Correlation with the North Atlantic Oscillation. Environ. Model. Softw. 19:113–128. doi:10.1016/S1364-8152(03)00114-2
- Goudie, A.S., and Middleton N.J. 2001. Saharan dust storms: Nature and consequences. Earth Sci. Rev. 56:179–204. doi:10.1016/S0012-8252(01)00067-8
- Grivas G., A. Chaloulakou, and P. Kassomenos. 2008. An overview of the PM10 pollution problem in the metropolitan area of Athens, Greece: Assessment of controlling factors and potential impact of long range transport. Sci. Total Environ. 389:165–177. doi:10.1016/j.scitotenv.2007.08.048
- Helmis, C.G., D.N. Asimakopoulos, D.G. Deligiorgi, and M. Petrakis. 1990. Some observations on the destruction of the morning temperature inversions in a large and broad mountain valley. J. Appl. Meteorol. 29:394–398. doi:10.1175/1520-0450(1990)029<0396:SOOTDO>2.0.CO;2
- Helmis, C.G., D.N. Asimakopoulos, K.H. Papadopoulos, P. Kassomenos, J.A. Kalogiros, P.G. Papageorgas, and S. Blikas. 1997a. Air mass exchange between the Athens Basin and the Messogia Plain of Attika, Greece. Atmos. Environ. 31:3833–3849. doi:10.1016/S1352-2310(97)00169-6
- Helmis, C., G. Tombrou, M. Asimakopoulos, D.N. Soilemes, A. Güsten, H. Moussiopoulos, N. and A. Hatzaridou. 1997b. Thessaloniki 91 field measurement campaign. I. Wind field and atmospheric boundary layer structure over greater Thessaloniki area under light background flow. Atmos. Environ. 31:1101–1114.
- Hurley, P., W. Physick, and A. Luhar. 2005. TAPM—A practical approach to prognostic meteorological and air pollution modeling. Environ. Modell. Softw. 20:737–752. doi:10.1016/j.envsoft.2004.04.006
- Intergovernmental Panel on Climate Change. 2007. Climate change 2007: The physical basis. In Contribution of the Working Group I to the Fourth Assessment Report of the Intergovernmental Panel on Climate Change, ed. S. Solomon, D. Qin, M. Manning, Z. Chen, M. Marquis, K.B. Averyt, M. Tignor, and H.L. Miller, 153–171. Cambridge, UK: Cambridge University Press.
- Kalabokas, P.D., Viras L.G., and Repapis C.C. 1999. Analysis of the 11-year record (1987–1997) of air pollution measurements in Athens, Greece. Part I: Primary pollutants. Global Nest J. 1:157–167.
- Kallos G., M. Astitha, P. Katsafados, and C. Spyrou. 2007. Long-range transport of anthropogenically and naturally produced particulate matter in the Mediterranean and north Atlantic: Current state of knowledge. J. Appl. Meteorol. Climatol. 46:1230–1251. doi:10.1175/JAM2530.1
- Kallos, G., P. Kassomenos, and R.A. Pielke. 1993. Synoptic and mesoscale weather conditions during air pollution episodes in Athens, Greece. Bound. Layer Meteorol. 62:163–184. doi:10.1007/BF00705553
- Kallos, G., V. Kotroni, K. Lagouvardos, and A. Papadopoulos. 1998. On the long-range transport of air pollutants from Europe to Africa. Geophys. Res. Lett. 25:619–622. doi:10.1029/97GL03317
- Kalnay, E., M. Kanamitsu, R. Kistler, W. Collins, D. Deaven, L. Gandin, M. Iredell, S. Saha,G. White, J. Woollen, Y. Zhu, M. Chelliah, W. Ebisuzaki, W. Higgins, J. Janowiak, K.C. Mo, C. Ropelewski, J. Wang, A. Leetmaa, R. Reynolds, R. Jenne, and D. Joseph. 1996. The NCEP/NCAR 40-year reanalysis project. Bull. Am. Meteorol. Soc. 77:437–470. doi:10.1175/1520-0477(1996)077<0437:TNYRP>2.0.CO;2
- Karagiannidis, A.F., A.G. Triantafyllou, and T.S. Karacostas. 2013. Analyzing the basic meteorological aspects of a particulate air pollution episode over the industrial area of Northwestern Greece during the November of 2009. Global Nest J. 15:241–253. doi:10.1175/1520-0477(1996)077<0437:TNYRP>2.0.CO;2
- Karandinos, N.R., Saitanis K., and Arapis G. 2006. Air pollution assessment in Volos coastal town, Greece. In Ecotoxicology, Ecological Risk Assessment and Multiple Stressors, ed. G. Arapis, N. Goncharova, and P. Baveye, 317–324. Springer.
- Kaskaoutis D.G., H.D. Kambezidis, P.T. Nastos, and P.G. Kosmopoulos. 2008. Study on an intense dust storm over Greece. Atmos. Environ. 42:6884–6896. doi:10.1016/j.atmosenv.2008.05.017
- Kassomenos, A.P., A. Kelessis, A.,K. Paschalidou, and M. Petrakakis. 2011. Identification of sources and processes affecting particulate pollution in Thessaloniki, Greece. Atmos. Environ. 45:7293–7300. doi:10.1016/j.atmosenv.2011.08.034
- Kassomenos, P., S. Vardoulakis, R. Borge, J. Lumbreras, C. Papaloukas, and S. Karakitsios. 2010. Comparison of statistical clustering techniques for the classification of modelled atmospheric trajectories. Theor. Appl. Climatol. 102:1–12. doi:10.1007/s00704-009-0233-7
- Kassomenos, P.A., Vardoulakis S., Chaloulakou A., Paschalidou A.K., Grivas G., Borge R., and Lumbreras J. 2014. Study of PM10 and PM2.5 levels in three European cities: Analysis of intra and inter urban variations. Atmos. Environ. 87:153–163. doi:10.1016/j.atmosenv.2014.01.004
- Kleanthous S., M.A. Bari, G. Baumbach, and L. Sarachage-Ruiz. 2009. Influence of particulate matter on the air quality situation in a Mediterranean island. Atmos.Environ. 43:4745–4753. doi:10.1016/j.atmosenv.2008.06.025
- Kukkonen J., M. Pohjola, R.S. Sokhi, L. Luhana, N. Kitwiroon, L. Fragkou, M. Rantamaki, E. Berge, V. Ødegaard, L.H. Slørdal, B. Denby, and S. Finardi. 2005. Analysis and evaluation of selected local scale PM10 air pollution episodes in four European cities: Helsinki, London, Milan and Oslo. Atmos. Environ. 39:2759–2773. doi:10.1016/j.atmosenv.2004.09.090
- Luo C., N.M. Mahowald, and J. del Corral. 2003. Sensitivity study of meteorological parameters on mineral aerosol mobilization, transport, and distribution. J. Geophys. Res. 108:4447. doi:10.1029/2003JD003483
- Matthaios, N.V., G.A. Triantafyllou, and L. Aidaoui. 2014. Dispersion aspects of PM10 from point sources in a complex terrain area with a microscale and a mesoscale model during an episode case. Fresenius Environ. Bull. 23:2946–2955.
- Matthaios, V., A.G. Triantafyllou, and T. Albanis. 2013. Performance and verification of a downscaling approach for meteorology and land use, using a mesoscale model in a complex terrain industrial area in Greece. In Proceedings of the 13th International Conference on Environmental Science and Technology, Athens, Greece, September 5–7 2013, ed. T.D. Lekkas. http://www.gnest.org/proceedings/cest2013/public_html/papers/0513.pdf
- Mavrakis, A., S. Lykoudis, A. Christides, S. Dasaklis, A. Tasopoulos, G. Theoharatos, S. Kyvelou, and E. Verouti. 2008. Air quality levels in a closed industrialized basin (Thriassion Plain, Greece). Fresenius Environ. Bull. 17:443–454.
- Meloni, D., A. di Sarra, F. Monteleone, G. Pace, S. Piacentino, and D.M. Sferlazzo. 2008. Seasonal transport patterns of intense Saharan dust events at the Mediterranean island of Lampedusa. Atmos. Res. 88:134–148. doi:10.1016/j.atmosres.2007.10.007
- Moussiopoulos, Ν., Vlachokostas, Ch., G. Tsilingiridis, I. Douros, E. Hourdakis, C. Naneris, and C. Sidiropoulos. 2009. Air quality status in Greater Thessaloniki Area and the emission reductions needed for attaining the EU air quality legislation. Sci. Total Environ. 407:1268–1285. doi:10.1016/j.scitotenv.2008.10.034
- Nastos, P.T. 2012. Meteorological patterns associated with intense Saharan dust outbreaks over Greece in winter. Adv. Meteorol. 2012:828301. doi:10.1155/2012/828301
- Paschalidou A.K., P.A. Kassomenos, and Karanikola P. 2015. Disaggregating the contribution of local dispersion and long-range transport to the high PM10 values measured in a Mediterranean urban environment. Sci. Total Environ. 527–528:119–125. doi:10.1016/j.scitotenv.2015.04.094
- Papanastasiou, D.K., and D. Melas. 2010. Application of PM10’s statistical distribution to air quality management—A case study in central Greece. Water Air Soil Pollut. 207:115–122. doi:10.1007/s11270-009-0123-8
- Pey J., X. Querol, A. Alastuey, F. Forastiere, and M. Stafoggia. 2013. African dust outbreaks over the Mediterranean Basin during 2001–2011: PM10 concentrations, phenomenology and trends, and its relation with synoptic and mesoscale meteorology. Atmos. Chem. Phys. 13:1395–1410. doi:10.5194/acp-13-1395-2013
- Prospero, J.M. 1996. Saharan dust transport over the North Atlantic Ocean and Mediterranean: An overview. In The Impact of Desert Dust across the Mediterranean, ed. S. Guerzoni and R. Chester, 133–151. Dordrecht, The Netherlands: Kluwer Academic Publishing.
- Querol X., A. Alastuey, S. Rodriguez, M.M. Viana, B. Artinano, P. Salvador, E. Mantilla, S. Garcia do Santos, R. Fernandez Patier, J. de La Rosa, Sanchez de la Campa, A., Menendez, M., and J.J. Gil. 2004. Levels of particulate matter in rural, urban and industrial sites in Spain. Sci. Total Environ. 334:359–376. doi:10.1016/j.scitotenv.2004.04.036
- Querol, X., J. Pey, M. Pandolfi, A. Alastuey, M. Cusack, N. Perez, T. Moreno, M. Viana, N. Mihalopoulos, G. Kallos, and S. Kleanthous. 2009. African dust contributions to mean ambient PM10 mass-levels across the Mediterranean Basin. Atmos. Environ. 43:4266–4277. doi:10.1016/j.atmosenv.2009.06.013
- Remoundaki, E., A. Bourliva, P. Kokkalis, R.E. Mamouri, A. Papayannis, T. Grigoratos, C. Samara, and M. Tsezos. 2011. PM(10) composition during an intense Saharan dust transport event over Athens (Greece). Sci. Total Environ. 409:4361–4372. doi:10.1016/j.scitotenv.2011.06.026
- Remoundaki, E., A. Papayannis, P. Kassomenos, E. Mantas, P. Kokkalis, and Tsezos M. 2013. Influence of Saharan dust transport events on PM2.5 concentrations and composition over Athens. Water Air Soil Pollut. 244:1–14. doi:10.1007/s11270-012-1373-4
- Rodriguez, S., X. Querol, A. Alastuey, G. Kallos, and O. Kakaliagou. 2001. Saharan dust contributions to PM10 and TSP levels in Southern and Eastern Spain. Atmos. Environ. 35:2433–2447. doi:10.1016/S1352-2310(00)00496-9
- Rodriguez, S., X. Querol, A. Alastuey, M.M. Viana, M. Alarcon, E. Mantilla, and C.R. Ruiz. 2004. Comparative PM10–PM2.5 source contribution study at rural, urban and industrial sites during PM episodes in Eastern Spain. Sci. Total Environ. 328:95–113. doi:10.1016/S0048-9697(03)00411-X
- Salvador P., Artíñano B., Molero F., Viana M., Pey J., Alastuey A., and Querol X. 2013. African dust contribution to ambient aerosol levels across central Spain: Characterization of long-range transport episodes of desert dust. Atmos. Res. 127:117–129. doi:10.1016/j.atmosres.2011.12.011
- Shao, Y., K.H. Wyrwoll, A. Chappell, J. Huang, Z. Lin, G.H. McTainsh, M. Mikami, T.Y. Tanaka, X. Wang, and S. Yoon. 2011. Dust cycle: An emerging core theme in Earth system science. Aeolian Res. 2:181–204. doi:10.1016/j.aeolia.2011.02.001
- Stathopoulou, M., C. Cartalis, and I. Keramitsoglou. 2004. Mapping micro-urban heat islands using NOAA/AVHRR images and CORINE Land Cover: An application to coastal cities of Greece. Int. J. Remote Sensing 25:2301–2316. doi:10.1080/01431160310001618725
- Stohl, A. 1998. Computation, accuracy and applications of trajectories—A review and bibliography. Atmos. Environ. 32:947–966. doi:10.1016/S1352-2310(97)00457-3
- A.G. Triantafyllou. 2000. Patterns and concentrations of PM10 in a mountainous basin region. J. Air Waste Manage. Assoc. 50:1017–1022. doi:10.1080/10473289.2000.10464146
- Triantafyllou, A.G. 2001. PM10 pollution episodes as a function of synoptic climatology in a mountainous industrial area. Environ. Pollut. 112:491–500. doi:10.1016/S0269-7491(00)00131-7
- Triantafyllou, A.G., Helmis C.G., Asimakopoulos D.N., and Soilemes A.T. 1995. Boundary layer evolution over large and broad mountain basin. Theor. Appl. Climatol. 52:19–25. doi:10.1007/BF00865504
- Triantafyllou, A.G., Krestou A., and Matthaios V. 2013. Source-receptor relationships by using dispersion model in a lignite burning area in Western Macedonia, Greece. Global Nest J. 15:241–253. doi:10.1007/BF00865504
- Triantafyllou, A.G., F. Vosniakos, G. Charalabidis, and N. Papadakis. 2000. On the pollutant concentrations and dispersion in West Macedonia region, Greece. Fresenious Environ. Bull. 9:23–29.
- Triantafyllou, A.G., S. Zoras, and V. Evagelopoulos. 2006. Particulate matter over the last 7 years in urban and rural areas within, proximal and far from mining and power station operations in Greece. Environ. Monit. Assess. 122:41–60.v.
- Varga, G., J. Kovacs, and G. Ujvari. 2013. Analysis of Saharan dust intrusions into the Carpathian Basin (Central Europe) over the period of 1979–2011. Global Planetary Change 100:333–342. doi:10.1016/j.gloplacha.2012.11.007
- Vlachokostas, C.H., A.V. Michailidou, A. Athanasiadis, and N. Moussiopoulos. 2013. Synergies between environmental pressures in the urban climate: Combined air quality and noise exposure assessment in Thessaloniki, Greece. Global Nest J. 15:209–217.
- Voutsa, D., C. Samara, T.H. Kouimtzis, and K. Ochsenkuhn. 2002. Elemental composition of airborne particulate matter in the multi-impacted urban area of Thessaloniki, Greece. Atmos. Environ. 36:4453–4462. doi:10.1016/S1352-2310(02)00411-9
- Watson, J.G., and J.C. Chow. 2002. A wintertime PM2.5 episode at the Fresno, CA, supersite. Atmos. Environ. 35:465–475. doi:10.1016/S1352-2310(01)00309-0
- WorldHealth Organization. 2000. Air Quality Guidelines for Europe, 2nd ed. WHO Regional Applications European Series No 91. Geneva, Switzerland: World Health Organization.
- Yannopoulos, P.C. 2007. Spatial concentration distributions of sulfur dioxide and nitrogen oxides in Patras, Greece, in a winter period. Environ. Monit. Assess. 135:163–180. doi:10.1007/s10661-007-9641-2
- Yannopoulos P.C. 2008. Long-term assessment of airborne particulate concentrations in Patras, Greece. Fresenius Environ. Bull. 17:608–616.