
ABSTRACT
Twenty-four-hour integrated ambient air samples were collected in canisters at 10 locations within Kuwait’s major power station: Doha West Power Station to assess the spatial distribution of volatile organic compounds (VOCs) within the perimeter of the station. A total of 30 samples, i.e., three samples per location, were collected during February and March. The samples were analyzed using a gas chromatography with flame ionization detection (GC-FID) system and following the U.S. EPA Method TO-14A with modification. The results reflected the emission activities on the site and the meteorological conditions during sampling. Generally speaking, there was a negative correlation between the ambient temperature and the VOC concentrations, which indicates the sources were local. The halogenated compounds formed the highest proportion (i.e. 50–75 %) of the total VOC concentrations at the ten locations. 1,2,4-Trichlorobenzene and Vinyl Chloride concentrations were the highest amongst the other halogenated compounds. The aromatic compounds formed the least proportion (i.e. 1–4%) of the total VOC levels at all locations with Toluene having the highest concentrations amongst the aromatic compounds at seven locations. Propene, which is a major constituent of the fuel used, was the highest amongst the aliphatic compounds. The findings of this study and other relevant work suggests the measured VOC levels were the highest over the year, nevertheless, further work is required to assess the precisely temporal variation of VOC due to change in meteorological conditions and the emission rates.
Implications: Assessment of VOC concentrations around a power plant in Kuwait during the peak season showed halogenated compounds to be the dominant group. The calculated indoor concentrations were lower than those reported in a residential area about 12 km away.
Introduction
With the climate of the globe rapidly changing and the severity of the weather conditions increasing, the human race is moving towards a life style with ever-increasing energy consumption rates as a result of human beings resorting to air conditioning (i.e., cooling and heating) appliances more frequently. For Kuwait, the harsh weather conditions represented mainly by the hot weather experienced over nearly 9 months in the year coupled with the lack of precipitation and the scarcity of water resources dictate the need for high energy production and desalination capacities. According to the United Nations Environment Programme (Citation2007), 60% of the world desalination capacity is in the Arab countries, particularly in the Gulf Cooperation Council (GCC) countries. In the GCC countries, about 58% of energy consumption is attributed to air conditioning and water desalination (U.S. Department of Energy Energy Information Administration [EIA], Citation2008). The aforementioned conditions cannot help but lead to comparatively high rates of electricity consumption. This explains the reason behind the sharp rise in energy consumption in Kuwait, with the peak power demand increasing at an annual rate of 6–8% since 2000 (Ramadan et al., Citation2005). In 2013, the energy consumption per capita in Kuwait was 14,911 kWhr compared with 3104 kWhr worldwide (World Bank, Citation2016). The energy sector in Kuwait, dominated by huge thermal electric power plants with complete reliance on fossil fuels, is a primary driver of both economic development and environmental degradation. The balance between these two somehow conflicting factors has yet to be achieved in Kuwait and more importantly globally. Although fossil fuels are available in abundant quantities in Kuwait, it is the emissions that result from burning them that are causing concerns.
Kuwait has many emission sources: (1) six electrical power generation/desalination plants that rely solely on fossil fuels; (2) three refineries coupled with petrochemical plants; (3) miscellaneous industries concentrated in the West Shuaiba Industrial Area; (4) flaring resulting from the gas/crude oil production activities; and (5) transport sector. The flaring activities alone are responsible for 90,000 tons of nonmethane volatile organic compounds (VOCs) per year (Al-Hamad and Khan, Citation2008). This, according to the same authors, is the highest VOC emission rate among all developing nations. VOCs in the urban areas have become a subject of great concern due to the effect they have on human health and the atmosphere (Riga-Karandinos et al., Citation2006). These compounds pose significant health risks and can play an important role in the atmospheric chemistry as precursors to secondary pollutants (i.e., ozone; Atkinson, Citation2000). According to the World Health Organization (WHO; Citation2016), ambient air pollutants were the reason behind 3.7 million premature deaths in cities and rural areas around the world in 2012. Such compounds eventually find their way into the indoor environment, which along with the existing indoor sources can bring the concentrations to alarming levels. Despite the higher than average levels of emissions, only a limited number of studies have assessed the VOC levels in Kuwait (Al-Salem and Bouhamrah, Citation2006; Ramadan, Citation2010; Alenezi and Ashfaque, Citation2011; Alenezi et al., Citation2012; Alhumoud et al., Citation2012; Al-Dabbous et al., Citation2013; Al-Mudhaf et al., Citation2013; Al-Khulaifi et al., Citation2014). The work of Al-Khulaifi et al. (Citation2014), which was concerned with indoor and outdoor VOC concentrations at Al-Jahra City, which is about 12 km to the west of the site of the concerned study, showed that the impact due to industrial and vehicle emissions was insignificant compared with that from the oil exploration and production activities in the northern part of Kuwait.
This paper focuses on the air quality, specifically concentrations of VOCs, of a comprehensive environmental baseline assessment that was conducted for the Ministry of Electricity and Water (MEW) of Kuwait to examine the effect of installing and operating open-cycle gas turbine units (OCGTUs) at a main power station, i.e., Doha West Power Station (DWPS). At the time of sampling, DWPS was the largest desalination and power plant in Kuwait, with a water production capacity of 110.4 million imperial gallons per day (MIGD) and total electricity production capacity of 10,855 million kWhr per year coming from eight 300-MW steam turbines and five 28.2-MW gas turbines (Al-Falah and Al-Shuaib, Citation2001; Al-Mudhaf et al., Citation2010). The daily-averaged concentrations of 72 VOCs were assessed using canisters at 10 locations within the perimeter of DWPS. In addition to canister sampling, air quality monitoring was carried out using diffusive passive samplers, high-volume samplers, and a mobile air pollution laboratory. The main aim of the sampling campaign was to examine the ambient pollutant concentrations and to compare them, where possible, with the Kuwait Environment Public Authority (KEPA) National Ambient Air Quality Standards (NAAQS). As this paper reports only on the ambient VOC concentrations, which do not have ambient limits, comparisons will be made with measurements taken at other locations.
Materials and methodology
Sampling locations
The city of Doha is on the Arabian Gulf Coast of Kuwait, and it is about 18 km to the west of Kuwait. The nearest residential area (i.e., Jaber Al-Ahmad City) is just about 3 km to the southwest of Doha. The next residential area is Sulaibikhat, and it is about 5 km to the southeast of Doha. Doha has two neighboring power/water desalination stations; Doha East Power Station (DEPS) was built in 1977, and by 2007 it had seven steam turbine units and six gas turbine units, with a total capacity of 1158 MW. Doha West Power Station (DWPS) was built in 1983 with an initial capacity of 2400 MW coming from eight thermal units. For DWPS, the offices are located about 33 m to the northwest of the two main stacks.
Ten monitoring sites were carefully selected to provide representative approximate contributions towards the different classes of VOCs. A short description of the monitoring locations is given in . The 10 sampling locations were chosen following the criteria presented in 40 CFR Part 58, Appendix E (U.S. Environmental Protection Agency [EPA], 2015) and took into account the following, sometimes conflicting, constraints:
Monitoring sites should be representative of the area selected.
Monitoring sites should not be near pollution sources, as proximity to the source would render the measurements entirely dependent on the particular source.
Security of the monitoring personnel and equipment.
Certain physical requirements, e.g., accessibility and availability of power supply.
Table 1. Locations of air sampling at DWPS.
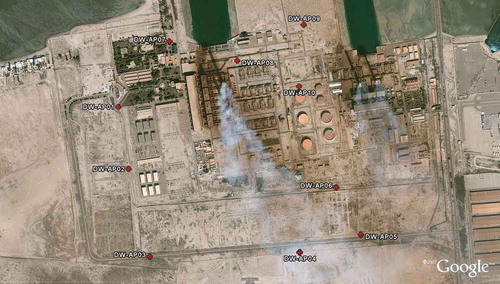
The ultimate choice for each monitoring site was a compromise between the above considerations. The measurements were accompanied by simultaneous pertinent meteorological measurements, taking into account the recommendations of American Society for Testing and Materials (ASTM; Citation2006): “instantaneous sampling results must be paired with instantaneous meteorological measurements.” A Visala portable weather station capable of measuring wind speed, wind direction, atmospheric temperature and pressure, solar radiation, and rainfall was deployed at the DWPS site for the duration of the sampling. Care was taken to ensure that no high buildings or trees were present at the sampling points in any direction to avoid the effects of building downwash and the consequent accumulation of pollutants. The location was also selected to minimize other human activities (e.g., traffic) that could affect the measurement results and interfere with the data interpretation with regard to the real impact of the power stations on the background concentrations. The sampling locations are shown in .
Figure 1. Satellite image showing the ambient air quality monitoring locations at the DWPS.
Meteorological conditions
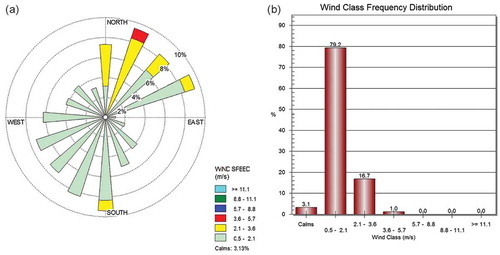
The main meteorological factors during sampling are listed in . Using Lakes Environmental WRPLOT software, the frequencies of occurrence of winds in each wind direction and wind speed class for the given locations and time periods were plotted. For the wind rose plots, the 15-min average wind speed and direction values were treated as hourly ones, which produced 96 values (24 hr × 4) per day. shows the wind rose plot and wind class frequency distribution of the sampling point DWPS-AP05, as an example.
Table 2. Meteorological data at each sampling point around DWPS.
Figure 2. (a) The wind rose plot of the sampling point DWPS-AP05. (b) The wind class frequency distribution of the sampling point DWPS-AP05.
Sampling and analysis
At every monitoring location, three 24-hr integrated samples were simultaneously collected in 6-L evacuated Silonite-coated polished stainless steel canisters. Triplicate sampling was adopted to ensure quality of the results. Where variation between results obtained by the three canisters exceeded 20% of the average of the three, sampling was repeated. A field blank was also used at every sampling point. Prior to sampling, the passivated canisters were cleaned, in accordance with the EPA-approved method Compendium Method TO-14A (EPA, 1999), to ensure that the concentration of all compounds inside the canister was below 0.2 ppbv. Briefly, the canisters were cleaned using a combination of nitrogen purging followed by evacuation coupled with 100 °C heating, which facilitated the removal of the internal surface-bound contaminants. Canisters were subjected to several (i.e., at least five cycles) of purge/evacuation coupled with heating cycles.
Canisters were evacuated to at least 29 in Hg (relative to vacuum) and tested to ensure that no leaks exist. This negative pressure allowed the ambient air to flow into the canisters naturally once they were opened at the site; hence, sampling was done without a pump. The sampling flow rate was precisely controlled using a high-purity flow regulator, which had a National Institute of Standards and Technology (NIST) traceable flow calibration. This ensured that the flow measurements are as accurate, consistent, and reliable as possible. A quick quality control (QC) flow check was performed before the start of each sampling. At the end of the sampling period (i.e., 24 hr), the solenoid valve automatically stopped the flow of ambient air into the canisters. Upon filling, the canisters were immediately retrieved and transported to the gas chromatography with flame ionization detector (GC/FID) laboratory at the Kuwait Institute for Scientific Research to be analyzed within the following 24 hr. The GC/FID system utilizes advanced three-stage preconcentrator with microscale purge-and-trap water management for analysis of polar and nonpolar VOCs.
Analytical procedure
The sampling and interpretation of the data for the air quality monitoring of VOCs followed the guidelines of the EPA-approved method. A total of 72 compounds, which included hydrocarbons (HC), aromatics (AR) including BTEX (benzene, toluene, ethylbenzene, and xylenes), and halogenated (HG) and oxygenated (OX) compounds, fall under this particular measurement field campaign. Air samples collected in prevacuumed stainless steel canisters (Entech Instruments, Inc., CA, USA) were analyzed using the EPA Compendium Method TO-14A (EPA, 1999) with modification. In brief, the method involved removing a known volume of the sample from the canister and passing it through a solid multisorbent concentrator. After the concentration and drying steps were completed, the VOCs were thermally desorbed, entrained in a carrier gas stream, and then focused in a small volume by trapping on a reduced temperature trap. The sample was then released by thermal desorption and carried onto a high-resolution GC column for separation.
For this work, the analysis utilized a combined cryogenic concentrator (Entech 7100A) with a GC/FID analyzer. In the cryogenic concentrator, a sample of 800 cm3 volume was preconcentrated in a liquid nitrogen–cooled sample loop (200 mm long, 2 mm diameter) filled with inert glass beads (0.25 mm diameter). The flow of sampled air was kept at 80 cm3 min−1, resulting in 10-min sampling intervals. The cryogenically trapped samples were desorbed from −150 to 180 °C and then focused at −150 °C in the focusing trap for GC/FID analysis. After injection, the column was kept isothermal at −60 °C for 5 min and then heated up to 200 °C with a ramp of 5 °C min−1. Subsequently, the column temperature was kept at 200 °C for 15 min. A quantitative standard mixture containing 72 VOCs was run to ensure the chromatographic separation of these compounds. After cooling down the GC oven, the whole setup was ready to analyze a new sample injection. The complete analysis took about 90 min. This was done using an Agilent-7890A GC/FID utilizing a DB-624 fused silica capillary column.
Data quality
The compounds were qualitatively identified by Agilent ChemStation software and quantitatively assessed periodically by calibrating the system with the 50-ppbv external standard calibration mixture (Apel-Riemer Environmental Inc.) and calculating the calibration factor for each target compound individually. A multipoint calibration encompassing four different concentration levels from 5 to 50 ppbv was utilized for calibrating the instrument. Linear fit for all compounds was found to be good (R2 > 0.99). The data obtained from the instrument were used for further analysis and variations in the calibration factors (i.e., response factor and retention time). Over the entire sampling period, the calibration factors were within the limits as recommended by TO-14A test method. Before analyzing the samples, a daily midway calibration was performed to quantify the VOC samples as quality assurance (QA) procedure.
Characterization of VOCs
The quantified VOCs were grouped under different chemical families according to their chemical structure. The 72 measured VOCs fall under four groups, including 9 hydrocarbons (HC), 8 aromatics (AR), and 29 halogenated (HG) and 26 oxygenated (OX) VOCs. The HC consist of n-alkanes, cycloalkanes, branched alkanes, and alkenes. The compound acetonitrile, which does not fit in any group structure-wise, was also included under the HC.
Results and discussion
Up to 72 VOC species in ambient air were quantified at the 10 locations. The total concentration (TC) of each of the four VOC classes was obtained by summing up the concentrations of individual VOCs. The contribution of each class was calculated at each location (see ). The most abundant species in the analyzed samples at each location as well as the ratios of the class total concentrations to the total VOC concentrations are also listed in and presented graphically in .
Table 3. Total VOC concentrations and the most abundant compounds at selected locations around DWPS.
Figure 3. The most abundant compounds around DWPS.
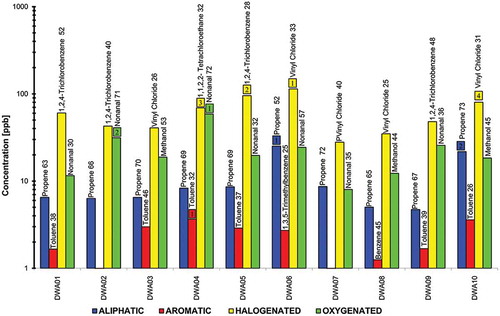
The total HC concentrations in the ambient air ranged from 4.71 to 25.12 ppbv, forming between 5.88 and 19.19% of the total VOCs. At 7 out of the 10 locations, contribution of HC to the total VOC concentrations was third, after HG and OX. Propene was the most abundant compound among the nine HC analyzed, and it accounted for 52–73% of the total HC concentration. This is similar to what was reported by Al-Khulaifi et al. (Citation2014). Propene is known as a petrol combustion-derived hydrocarbon (Field et al., Citation1994) and is the characteristic product of internal combustion engines and is reported as a good indicator of vehicle exhaust (Geng et al., Citation2010).
For AR, the total concentrations in the analyzed samples varied between 0.39 and 3.66 ppbv, making 0.88–4.33% of the total VOCs. AR class had the lowest contribution to the total VOCs at all locations. Toluene was the dominant AR compound at 7 out of 10 sampling locations. Al-Khulaifi et al. (Citation2014) also reported toluene having the highest contribution amongst the AR compounds, despite the area of their study being a residential one. Toluene concentrations contributed to 26–57% of the total AR concentrations. Toluene is known to be emitted from vehicles due to the fact that it is an essential fuel additive, is used in painting and industrial processes, and is related to leakage from liquefied petroleum gas or natural gas (Barletta et al., Citation2005). It comes as no surprise that toluene has also been identified as a dominant VOC in urban settings as well (Moschonas and Glavas, Citation1996; Monod et al., Citation2001; Ho et al., Citation2004; Elbir et al., Citation2007; Duan et al., Citation2008; Yuval and Broday, Citation2008; Buczynska et al., Citation2009; Sosa et al., Citation2009; Tassi et al., Citation2013). At the other three locations, the most abundant species were benzene at DWPS-AP07 (52% of 0.39 ppbv) and at DWPS-AP08 (45% of 1.25 ppbv), and 1,3,5-trimethylbenzene at DWPS-AP06 (25% of 2.72 ppbv). Benzene and toluene are in the Urban Air Toxics list of the Clean Air Act of the United States, as amended in 1990 (Barletta et al., Citation2002). In general, AR can be emitted from vehicular exhaust, gasoline evaporation, and solvent emissions (Liu et al., Citation2000; Guo et al., Citation2004).
HG concentrations varied between 27.96 and 114.06 ppbv, with their contribution to the total VOCs being between 49.41 and 75.39% (i.e., the highest contribution to total VOCs at all locations). From the total 29 HG species analyzed, vinyl chloride was the most abundant compound at five locations and contributed to 25–40% of HG concentrations, whereas 1,2,4-trichlorobenzene was dominant at four locations and accounted for 28–52% of the HG concentrations at these locations. At DWPS-AP04, 1,1,2,2-tetrachloroethane was the most abundant compound with concentration of 69.14 ppbv, which represents 32% of the total HG concentration. Vinyl chloride is used in the production of polyvinylchloride in petrochemical industries. It is largely associated with petrochemical industries, and it usually ranks high only at the industrial sites. Hence, vinyl chloride is a characteristic compound in industrial ambient air (Na et al., Citation2001). In contrast, 1,2,4-trichlorobenzene is used as a solvent, dielectric fluid, dye carrier, chemical intermediate, synthetic transformer oil, lubricant, and as a heat transfer medium (Hazardous Substances Data Bank [HSDB], Citation2016; Agency for Toxic Substances and Disease Registry [ATSDR], Citation2016). It can be formed during the combustion of chlorine-containing polymers and is also a product of hexachlorobenzene dechlorination by anaerobic sewage sludge (HSDB, Citation2016).
For OX, which are generally attributed to photo-oxidation of HC, TC varied from 8.03 to 58.85 ppbv, with their contribution to the total VOCs being between 14.42 and 42.05%. At 7 out of the 10 locations, OX’s contribution to the total VOC concentrations was second after HG. Nonanal and methanol were the most abundant species among the 26 OX compounds. Nonanal was the dominating compound at seven sampling locations and accounted for 30–72% of the OX concentrations. At DWPS-AP03, DWPS-AP08, and DWSP-AP10, methanol was the dominant compound and contributed to 53, 44, and 45% of the total OX species, respectively. In ambient air, incomplete combustion of gasoline is known to be a significant source of methanol (Bravo et al., Citation2006). In general, OX compounds are major components of emissions resulting from solvent use (Niedojadlo et al., Citation2007).
For this study, the average contribution of HC, AR, HG, and OX to the total VOCs was 11, 2, 63, and 24%, respectively. The percentage contribution of HG is identical to that reported by Al-Dabbous et al. (Citation2013) in outdoor air samples collected not far from the refinery area in southern Kuwait. The minimum contribution of the AR compounds to the total VOCs strengthens the belief that vehicular emissions had so little to do with the VOC levels at the site concerned.
Spatial variation of VOCs
DWPS-AP01 and DWPS-AP02 are on the western side of DWPS and DEPS. DWPS-AP01 is close to the station’s main gate, whereas DWPS-AP02 is not far from the western perimeter road. The prevailing wind direction was northwest (NW) during the sampling activity at the two locations. This means that the effect of DWPS and DEPS was negligible at these points, which resulted in the low AR concentration at both locations (i.e., 1.66 and 0.95 ppbv). The slight increase in concentration at DWPS-AP01 for the HG and OX classes (60.36 and 11.54 ppbv) might be due to the proximity of this point to the main gate, suggesting vehicular emissions to be a contributing factor.
DWPS-AP03 is in the southwestern corner of DWPS, whereas DWPS-AP10 is nearly midway between the DWPS and DEPS stacks, slightly north of the fuel storage tanks. During sampling, 58% of the wind signal count was in the range 0.5–2.1 m/sec, whereas 12% was considered calm winds (i.e., wind speed <0.5 m/sec). Hence, the measurements at these points were so much affected by the local settings (i.e., fuel storage tanks), with very little effect from the emissions of DWPS and DEPS. With this in mind, one can correlate the high (second highest) AR and aliphatic concentrations at DWPS-AP10 with the fuel storage tanks containing evaporative fuels. It was found that propene (an aliphatic compound and a major constituent of fuels stored in the tank) had the highest concentration at this point. The toluene/benzene (T/B) ratios for these two points were higher than 2, indicating that vehicular emissions have negligible effect on the VOC levels at these two points (Elbir et al., Citation2007; Yurdakul et al., Citation2013). This is confirmed by the local settings of the site.
DWPS-AP04 is on the main road leading to DWPS, outside the station’s perimeter but within the fenced area. It is 1000 m downwind the DWPS stacks. DWPS-AP07 is 500 m northwest of DWPS, directly upwind. The prevailing winds were northern to northwestern during sampling at these locations. The concentrations of AR and OX compounds were highest at DWPS-AP04. Considering its location and wind direction, a direct influence of DWPS emissions is suspected to be behind the high levels of OX compounds, whereas the highest concentration of the AR is directly linked to fuel combustion and evaporation. The combined effect of the location and the wind direction resulted in the lowest AR, OX, and HG concentrations at DWPS-AP07. As far as the level of the aliphatic compounds, it does not seem to correlate with wind direction, i.e., the aliphatic concentrations for both upwind and downwind locations are nearly the same. The T/B ratio for DWPS-AP07 was lowest (i.e., 0.90) on the site and clearly less than 2, indicating the vehicular emissions to be the dominant source at this point (Elbir et al., Citation2007; Yurdakul et al. Citation2013).
DWPS-AP05 is 880 m directly south the DEPS stacks and southeast the DWPS stacks. During sampling at this point, which happened to be during public holiday, the wind speed was low and the wind direction was rather hard to define. The second highest level of HG compounds and a relatively high level of OX compounds can be correlated to their high volatilities. The prevailing wind conditions for DWPS-AP08 were similar to those for DWPS-AP05; however, DWPS-AP08 is closer (i.e., distance = 250 m) and on the opposite site of the DWPS stacks. Due to this proximity, we expect high-density compounds produced by fuel combustion and evaporation to have lower concentration at this location. In fact that is true, as both AR and aliphatic groups have low concentrations. A quick general comparison between the concentrations at DWPS-AP05 and DWPS-AP08 shows higher concentrations for the four groups at the former location. This is due to the combined impact of emissions from DWPS and DEPS on DWPS-AP05, whereas DWPS-AP08 is only affected by emissions from DWPS. The (T/B) ratio for DWPS-AP05 was the highest on the site and clearly greater than 2, indicating the nonvehicular emissions to be the dominant source at this point (Elbir et al., Citation2007; Yurdakul et al. Citation2013).
DWPS-AP06 is 270 m south of the fuel storage tanks and about 850 and 640 m from the DWPS and DEPS stacks, respectively. During sampling, the wind had two dominant directions: NE enhancing the impact of the DEPS stacks and a stronger NW enhancing the impact of the DWPS stacks. This has resulted in the highest HG and aliphatic concentrations being measured at this point.
DWPS-AP09 is located north of DWPS and DEPS. During sampling, the wind direction had obvious N and NE wind components representing winds coming across the Arabian Gulf. It is natural, hence, for the AR and aliphatic groups (fingerprint of the sources at hand) to have very low concentration at this point.
Conclusion
Twenty-four-hour time-weighted average (TWA) concentrations of 72 VOCs were measured at 10 locations in Kuwait’s largest power generation plant using triplicate canister sampling. The daily concentrations correlated well with the activities on-site and the meteorological conditions. Generally speaking, VOCs (i.e., propene, toluene, benzene, vinyl chloride, and nonanal), which characterize industrial sites, were abundant at this site. HG formed 50–75% of the total VOC concentrations, with vinyl chloride being the most abundant compound in general. Nonanal formed more than 30% of the OX compounds, whereas propene formed more than 50% of the HC. AR compounds had the least contribution to the total VOCs, which together with the T/B ratio confirmed that the vehicular emissions had little effect on the VOC levels at the site, except for DWPS-AP07. Toluene formed more than 25% of the HC at all locations, which is similar to what was found at a nearby residential area. If we were to assume the validity of the conclusions made by Lee et al. (Citation2002), Saito et al. (Citation2009), Civan et al. (Citation2011), and Tong et al. (Citation2013) on the seasonal variations of VOC levels, then the levels measured in this study represent the highest levels across the year. This can be readily understood when one considers the high photochemical reactivity of VOCs, which results in an increased rate of ozone formation during the summer season, which provides the ideal conditions for this reaction in the existence of nitrogen dioxide (NO2). Nevertheless, another long-term study covering the whole year and measuring both indoor and outdoor VOC levels seems appropriate, as it would help capture the diurnal/seasonal variation.
Acknowledgment
The author is grateful to Ms. Anju Muraleedharan Pillai for the sample preparation/analysis. Special thanks are also due to Mr. Joby Jose for collecting the samples.
Funding
The author is indebted to MEW for the generous sponsorship of this project (EC064C).
Additional information
Funding
Notes on contributors
Ashraf Ramadan
Ashraf Ramadan, Ph.D., is a research scientist specializing in air pollution modeling and monitoring at the Kuwait Institute for Scientific Research.
Related Research Data
References
- Agency for Toxic Substances and Disease Registry. 2016. Trichlorobenzenes. http://www.atsdr.cdc.gov/substances/toxsubstance.asp?toxid=255 ( accessed May 15, 2016).
- Al-Dabbous, A.N., A.R. Khan, M.S. Al-Rashidi, and L. Awadi. 2013. Carbon dioxide and volatile organic compounds levels in mosque in hot arid climate. Indoor Built Environ. 22:456–64. doi: 10.1177/1420326X12441807.
- Alenezi, R., B. Al-Anzi, A. Abusam, and A. Ashfaque. 2012. Seasonal influence on the ambient air quality in Al Jahra City for year 2010. J. Environ. Prot. 3:1711–18. doi: 10.4236/jep.2012.312186.
- Alenezi, R., and A. Ashfaque. 2011. Assessment of ambient air quality in Al Jahra governorate, for 2008. Int. J. Energy Environ. 5:582–91.
- Al-Falah, E., and A. Al-Shuaib. 2001. Impact of on-site training on performance of MSF plants: A case study. Desalination 141:129–43. doi: 10.1016/S0011-9164(01)00398-8.
- Al-Hamad, K., and A.R. Khan. 2008. Total emissions from flaring in Kuwait oilfields. Am. J. Environ. Sci. 4:31–8. doi.10.3844/ajessp.2008.31.38.
- Alhumoud, J.M., F.M. Al-Ruwaih, S.H. Ali, and M.H. Redhaee. 2012. Traffic contribution of volatile organic compounds to the air-shed of Kuwait. Manage. Environ. Qual. 23:204–21. doi: 10.1108/14777831211204949.
- Al-Khulaifi, N., H. Al-Mudhaf, R. Alenezi, A. Abu-Shady, and M. Selim. 2014. Seasonal and temporal variations in volatile organic compounds in indoor and outdoor air in Al-Jahra City, Kuwait. J. Environ. Prot. 5:310–26. doi: 10.4236/jep.2014.54034.
- Al-Mudhaf, H.F., A.I. Abu-Shady, N.M. Al-Khulaifi, and M.I. Selim.2013. Indoor and outdoor volatile organic compounds at office buildings in Kuwait. Air Soil Water Res. 6:53–72. doi: 10.4137/ASWR.S12153.
- Al-Mudhaf, H.F., A.M. Astel, M.I. Selim, and A.I. Abu-Shady. 2010. Self-organizing map approach in assessment spatiotemporal variations of trihalomethanes in desalinated drinking water in Kuwait. Desalination 252:97–105. doi: 10.1016/j.desal.2009.10.017.
- Al-Salem, S.M., and W.S. Bouhamrah. 2006. Ambient concentrations of benzene and other VOCs at typical industrial sites in Kuwait and their cancer risk assessment. Res. J. Chem. Environ. 10:42–6.
- American Society for Testing and Materials (ASTM). 2006. ASTM D5111-99. Standard Guide For Choosing Locations and Sampling Methods to Monitor Atmospheric Deposition at Nonurban Locations. Conshohocken, PA: American Society for Testing and Materials.
- Atkinson, R. 2000. Atmospheric chemistry of VOCs and NOx. Atmos. Environ. 34:2063–101. doi: 10.1016/S1352-2310(99)00460-4.
- Barletta, B., S. Meinardi, F.S. Rowland, C.Y. Chan, X. Wang, S. Zou, L.Y. Chan, and D.R. Blake. 2005. Volatile organic compounds in 43 Chinese cities. Atmos. Environ. 39:5979–90. doi: 10.1016/j.atmosenv.2005.06.029.
- Barletta, B., S. Meinardi, I.J. Simpson, H.A. Khwaja, D.R. Blake, and F.S. Rowland. 2002. Mixing ratios of volatile organic compounds (VOCs) in the atmosphere of Karachi, Pakistan. Atmos. Environ. 36:3429–43. doi: 10.1016/S1352-2310(02)00302-3.
- Bravo, A., J. Sanchez, E. Sosa, T. Keener, and M. Lu. 2006. The potential impact of gasoline additives on air quality in developing countries. Clean Technol. Environ. Policy 8:174–81. doi: 10.1007/s10098-005-0016-5.
- Buczynska, A.J., A. Krata, M. Stranger, A.F.L. Godoi, V. Kontozova-Deutsch, L. Bencs, I. Naveau, E. Roekens, and R.V. Grieken. 2009. Atmospheric BTEX concentrations in an area with intensive street traffic. Atmos. Environ. 43:311–8. doi: 10.1016/j.atmosenv.2008.09.071.
- Civan, M.Y., O.O. Kuntasal, and G. Tuncel. 2011 Source apportionment of ambient volatile organic compounds in Bursa, a heavily industrialized city in Turkey. Environ. Forensics 12:357–70. doi: 10.1080/15275922.2011.622345.
- Duan, J., J. Tan, L. Yang, S. Wu, and J. Hao. 2008. Concentration, sources and ozone formation potential of volatile organic compounds (VOCs) during ozone episode in Beijing. Atmos. Res. 88:25–35. doi: 10.1016/j.atmosres.2007.09.004.
- Elbir, T., B. Cetin, E. Çetin, A. Bayram, and M. Odabasi. 2007. Characterization of volatile organic compounds (VOCs) and their sources in the air of İzmir, Turkey. Environ. Monit. Assess. 133:149–60. doi: 10.1007/s10661-006-9568-z.
- Energy Information Administration. 2008. International total primary energy consumption and energy intensity. http://www.eia.doe.gov/emeu/international/energyconsumption.html (accessed May 25, 2008).
- Field, R.A., M.E. Goldstone, J.N. Lester, and R. Perry. 1994. The variation of volatile organic compound concentrations in Central London during the period of July 1991 to September 1992. Environ. Technol. 15:931–44. doi: 10.1080/09593339409385501.
- Geng, F.H., C. Cai, X. Tie, Q. Yu, J. An, L. Peng, G. Zhou, and J. Xu. 2010. Analysis of VOC emissions using PCA/APCS receptor model at city of Shanghai, China. J. Atmos. Chem. 62:229–47. doi: 10.1007/s10874-010-9150-5.
- Guo, H., T. Wang, I.J. Simpson, D.R. Blake, X.M. Yu, Y.H. Kwok, and Y.S. Li. 2004. Source contributions to ambient VOCs and CO at a rural site in eastern China. Atmos. Environ. 38:4551–60. doi: 10.1016/j.atmosenv.2004.05.004.
- Hazardous Substances Data Bank. 2016. 1,2,4-Trichlorobenzene. https://toxnet.nlm.nih.gov/cgi-bin/sis/search2/f?./temp/~YCxkqY:3 (accessed May 15, 2016).
- Ho, K.F., S.C. Lee, H. Guo, and W.Y. Tsai. 2004. Seasonal and diurnal variations of volatile organic compounds (VOCs) in the atmosphere of Hong Kong. Sci. Total Environ. 322:155–66. doi: 10.1016/j.scitotenv.2003.10.004.
- Lee, S. C., M.Y. Chiu, K.F. Ho, S.C. Zou, and X. Wang. 2002. Volatile organic compounds (VOCs) in urban atmosphere of Hong Kong. Chemosphere 48:375–82. doi: 10.1016/S0045-6535(02)00040-1.
- Liu, C., Z. Xu, Y. Du, and H. Guo. 2000. Analyses of volatile organic compounds concentrations and variation trends in the air of Changchun, the northeast of China. Atmos. Environ. 34:4459–66.doi: 10.1016/S1352-2310(00)00102-3.
- Monod, A., B.C. Sive, P. Avino, T. Chen, D.R. Blake, and F.S. Rowland. 2001. Monoaromatic compounds in ambient air of various cities: A focus on correlations between the xylenes and ethylbenzene. Atmos. Environ. 35:135–49. doi: 10.1016/S1352-2310(00)00274-0.
- Moschonas, N., and S. Glavas. 1996. C3–C10 hydrocarbons in the atmosphere of Athens, Greece. Atmos. Environ. 30:2769–72. doi: 10.1016/1352-2310(95)00488-2.
- Na, K., Y.P. Kim, K. Moon, I. Moon, and K. Fung. 2001. Concentrations of volatile organic compounds in an industrial area of Korea. Atmos. Environ. 35:2747–56. doi: 10.1016/S1352-2310(00)00313-7.
- Niedojadlo, A., K.H. Becker, R. Kurtenbach, and P. Wiesen. 2007. The contribution of traffic and solvent use to the total NMVOC emission in a German city derived from measurements and CMB modelling. Atmos. Environ. 41:7108–26. doi: 10.1016/j.atmosenv.2007.04.056.
- Ramadan, A. 2010. Air quality assessment in southern Kuwait using diffusive passive samplers. J. Environ. Monit. Assess. 160:413–23. doi: 10.1007/s10661-008-0705-8.
- Ramadan, A., S. Alhajraf, and A.R. Khan. 2005. Technical Assessment of the Air Quality Impact of SO2 Emission from the Power Plants in Kuwait until 2030. Final Report No. KISR7825. Safat, Kuwait: Kuwait Institute for Scientific Research.
- Riga-Karandinos, A.N., C.J. Saitanis, and G. Arapis. 2006. Study of the weekday-weekend variation of air pollutants in a typical Mediterranean coastal town. Int. J. Environ. Pollut. 27:300–12. doi: 10.1504/IJEP.2006.010574.
- Saito, S., I. Nagao, and H. Kanzawa. 2009. Characteristics of ambient C2–C11 non-methane hydrocarbons in metropolitan Nagoya, Japan. Atmos. Environ. 43:4384–95. doi: 10.1016/j.atmosenv.2009.04.031.
- Sosa, E.R., A.H. Bravo, A.V. Mugica, A.P. Sanchez, L.E. Bueno, and S. Krupa. 2009. Levels and source apportionment of volatile organic compounds in southwestern area of Mexico City. Environ. Pollut. 157:1038–44. doi: 10.1016/j.envpol.2008.09.051.
- Tassi, F., F. Capecchiacci, L. Giannini, G.E. Vougioukalakis, and O. Vaselli. 2013. Volatile organic compounds (VOCs) in air from Nisyros Island (Dodecanese Archipelago, Greece): Natural versus anthropogenic sources. Environ. Pollut. 180:111–21. doi: 10.1016/j.envpol.2013.05.023.
- Tong, L., X. Liao, J. Chen, H. Xiao, L. Xu, F. Zhang, Z. Niu, and J. Yu. 2013. Pollution characteristics of ambient volatile organic compounds (VOCs) in the southeast coastal cities of China. Environ. Sci. Pollut. Res. 20:2603–15. doi: 10.1007/s11356-012-1187-3.
- United Nations Environment Programme. 2007. Environmental Impacts of the Arab Oil and Gas Sector. Manama, Bahrain: United Nations Environment Programme, Regional Office for West Asia.
- U.S. Environmental Protection Agency. 1999. TO-14A: Compendium of Methods for the Determination of Toxic Organic Compounds in Ambient Air, 2nd ed. Cincinnati, OH: U.S. Environmental Protection Agency.
- U.S. Environmental Protection Agency. 2015. Protection of environment. http://www.ecfr.gov/cgi-bin/text-idx?c=ecfr&SID=bdd20ec807fda95c550270c4328e6306&rgn=div9&view=text&node=40:6.0.1.1.6.7.1.3.38&idno=40 (accessed May 15, 2016).
- World Bank. 2016. Kuwait Data Profile. http://databank.worldbank.org/data/reports.aspx?source=2&type=metadata&series=EG.USE.ELEC.KH.PC# ( accessed May 15, 2016).
- World Health Organization. 2016. Ambient (outdoor) air quality and health. http://www.who.int/mediacentre/factsheets/fs313/en/( accessed May 15, 2016).
- Yurdakul, S., M. Civan, and G. Tuncel. 2013. Volatile organic compounds in suburban Ankara atmosphere, Turkey: Sources and variability. Atmos. Res. 120–121:298–311. doi: 10.1016/j.atmosres.2012.09.015.
- Yuval, A.Z., and D.M. Broday. 2008. Revealing source signatures in ambient BTEX concentrations. Environ. Pollut. 156:553–62. doi: 10.1016/j.envpol.2008.01.016.