
ABSTRACT
Military personnel deployed to Southwest Asia and Afghanistan were exposed to high levels of ambient particulate matter (PM). However, quantitative ambient exposure data for conducting health studies are limited due to a lack of PM monitoring stations. Since visual range (VR) is proportional to particle light extinction, VR can serve as a surrogate for PM2.5 (particulate matter with an aerodynamic diameter ≤2.5 µm) concentrations. We used data on VR, relative humidity (RH), and PM2.5 ground measurements collected in Kuwait from years 2004–2005 to establish the relationship between PM2.5 and VR. Model validation obtained by regressing trimester average PM2.5 predictions against PM2.5 measurements in Kuwait produced an r2 value of 0.84. Cross validation of urban and rural sites in Kuwait also revealed good model fit. We applied this relationship to location-specific visibility data at 104 regional sites between years 2000-2012 to estimate monthly average PM2.5 concentrations. Monthly averages at sites in Iraq, Afghanistan, United Arab Emirates, Kuwait, Djibouti, and Qatar ranged from 10 to 365 µg/m3 during this period, while site averages ranged from 22 to 80 µg/m3, indicating considerable spatial and temporal heterogeneity in ambient PM2.5 across these regions. These data support the use of historical visibility data to estimate location-specific PM2.5 concentrations for application in epidemiological studies.
Implications: This study demonstrates the ability to use airport visibility to estimate PM2.5 concentrations in Southwest Asian and Afghanistan. This supports the use of historical and ongoing visibility data to estimate PM2.5 exposure in this region of the world, where PM exposure information is otherwise scarce. This is of high utility to epidemiologists investigating the relationship between chronic exposure to PM2.5 and respiratory diseases among deployed military personnel stationed at various military bases throughout the region. Such information will enable the drafting of improved policies relating to military health.
Introduction
In response to concerns about PM exposure in Southwest Asia and Afghanistan, the Department of Defense (DoD) conducted the Enhanced Particulate Matter Surveillance Program (EPMSP) to characterize airborne exposures at 15 military bases, mainly in Iraq and Afghanistan, for approximately 12 months during the period 2006–2007 (National Research Council [NRC], Citation2010). Although only a small number of samples were collected at each site, mean concentrations of PM2.5 ranged from 33 to 144 µg/m3, which is much higher than ambient levels encountered in the United States (U.S.; national average ~12 µg/m3) during the same time period (U.S. Environmental Protection Agency [EPA], Citation2016). Sources of PM in this region include windblown dust and dust storms, as well as local combustion sources such as open-pit refuse burning, compression ignition vehicles, aircraft engines, diesel electric generators, households, and local industry (Institute of Medicine [IOM], Citation2011). This mix of sources differs from those encountered in the U.S. and Europe, where most previous health studies have been conducted.
The potential for respiratory health effects occurring during deployment concerns PM exposures that are orders of magnitude higher than those commonly found in the U.S., and last several months to several years depending on the length and numbers of deployments. This is in contrast to studies conducted in the U.S. and Europe, which assess the health effects attributable to relatively low exposures over both short (days, months) and long (years, decades) time scales. Results of studies in Europe and the U.S. assessing the impact of long-term PM exposures on pulmonary function, asthma, and chronic obstructive pulmonary disease (COPD) suggest concern about the impact of deployment-related exposures on future respiratory health (Downs et al., Citation2007; Garshick, Citation2014; Schikowski et al., Citation2014; Young et al., Citation2014; Adam et al., Citation2015; Jacquemin et al., Citation2015; Rice et al., Citation2015).
Surveys of troops following deployment have reported high rates of respiratory illness and an increase in respiratory symptoms, including wheezing (Sanders et al., Citation2005; Roop et al., Citation2007). Reports have also documented asthma requiring treatment in returning deployers (Szema et al., Citation2010, Citation2011). Additionally, rates of encounters for asthma/COPD and allied conditions were significantly increased post deployment, as were rates for respiratory symptoms and asthma compared with those at U.S. bases (Abraham et al., Citation2012, Citation2014). Similarly, in the Millennium Cohort Study, troops deployed to Iraq and Afghanistan had higher rates of newly reported respiratory symptoms compared with nondeployed troops (Smith et al., Citation2009). However, these reports, including the assessment of deployment-related changes in pulmonary function, are limited due to lack of objective exposure information (Morris et al., Citation2014).
In Iraq and Afghanistan, for instance, there is a general paucity of integrated air pollution monitoring networks, which makes it difficult to assess previous exposures to PM2.5 using methods similar to those of U.S. and European studies. Although wealthier countries such as Kuwait, Qatar, and United Arab Emirates (U.A.E.) have established networks for PM10 and gaseous criteria pollutants (since the early 2000s), PM2.5 measurements did not start until 3–5 years ago. Additionally, the majority of particle sampling methods currently used in these regions are not adequate to collect particles during dust storms, which are common occurrences each year (NRC, Citation2010).
We assessed the use of airport visual range (VR) measurements to address the lack of PM2.5 data. VR has demonstrated particular promise for use as a PM2.5 predictor, especially when PM2.5 levels are above 10–20 μg/m3. The relationship between particles and VR is due to the light extinction (scattering and absorption) effects of particles with sizes similar to the wavelengths of visible light. In the U.S., the effect of PM on VR has been shown empirically in studies since the 1960s (Burt, Citation1961; Charlson, Citation1969; Waggoner and Weiss, Citation1980). In California, the relationship between VR and PM2.5 estimated for multiple cities was strong, with r2 values of up to 0.83 (Abbey et al., Citation1995b). Cities in other nations have also shown VR to be highly correlated with PM levels and hospital admissions (Thach et al., Citation2010; Ge et al., Citation2011). Additionally, previous U.S.-based epidemiological studies have used airport VR as a surrogate for particulate exposure (Ozkaynak et al., Citation1985; Abbey et al., Citation1995a; Schwartz, Citation1991; Ostro, Citation1995; Yanosky et al., Citation2009; Laden et al., Citation2006).
In this study, we used 648 paired daily airport VR and PM2.5 measurements collected in Kuwait to develop a calibration model that can be used to convert VR to PM2.5 estimates in this region. This enables us to take advantage of the large database of historical VR readings collected by the military in Southwest Asia and Afghanistan.
Methods
The data used for the calibration model in this study were collected in Kuwait, a small desert country located at the northern end of the Persian Gulf, to the south of Iraq and northeast of Saudi Arabia, with weather conditions representative of Southwest Asia and Afghanistan. Kuwait is characterized by long summers of extreme heat and dryness, which extend for roughly 5 months, from May to September. Winters are short, lasting only 3 months from December to February, and are characterized by warm and sometimes rainy conditions. The general region is subject to intense dust storms that occur primarily during spring and summer (Idso, Citation1976).
Visual range and relative humidity data
Measurements of VR and relative humidity (RH) were obtained from the U.S. Air Force 14th Weather Squadron and included 104 sites in Iraq, Afghanistan, United Arab Emirates, Kuwait, Djibouti, and Qatar between 2000 and 2012. Meteorological variables were measured automatically and reported approximately once per hour using either an AN/FMQ-19 Automatic Meteorological Station or a TMQ-53 Tactical Meteorological Observing System. These systems utilized Present Weather Detector 22 (PWD22) sensors (Vaisala Inc., Louisville, CO) in order to measure VR. PWD22 sensors employ proven forward-scatter measurement principles to measure VR and generally evaluated VR from less than 400 to 9999 m. Scatter is measured at an angle of 45°, with a peak measurement wavelength of 875 nm. Sensors utilize an extensive set of self-diagnostics that can automatically detect contamination so as not to report false values. PWD22s are calibrated with reference to a highly accurate transmissometer (Vaisala MITRAS). VR values are calculated from extinction coefficient values, where the extinction coefficient (σ) is defined as follows: σ (1/km) = 3000/VR (m).
In order to generate daily VR averages for use in the model calibration, we averaged reported hourly measurements over 24-hr periods that coincided with daily PM2.5 measurements. Since VR monitors are restricted to finite maximum readings, there inherently exists some truncation at the high end of VR measurements, which can produce an underestimate of VR. For RH, days with any hourly measurements showing near-saturated atmospheres (relative humidity ≥98%) were assumed to be rainy and therefore not used for model calibration or PM2.5 prediction.
PM2.5 data
PM2.5 data were previously collected during an air pollution study in Kuwait during 2004–2005 (Brown et al., Citation2008). Integrated daily measurements were collected at three monitoring sites from 9:00 a.m. to 9:00 a.m. the following morning using a Harvard high-capacity impactor (HHI; BGI Inc., Waltham, MA) operating at a flow rate of 10 L/min (Demokritou et al., Citation2004). In contrast to most particle sampling devices, which are prone to particle bounce and thus measurement error under conditions of extremely high PM, the HHI was specifically designed to function under conditions of high PM and extreme temperatures, making it ideal for sampling in Southwest Asia where dust storms and other extreme events are common. The system uses a slit acceleration jet with dual-stage polyurethane foam impaction surfaces in order to remove particles above 2.5 µm during sampling. The ability of the HHI to minimize particle bounce-off onto the impaction substrate was successfully field-tested in Kuwait City by Brown (Citation2008). Using artificially generated polydisperse aerosols, the device also demonstrated a high capacity (>35 mg of PM) for particle accumulation.
PM2.5 samples were collected onto Teflon filters (Gelman Sciences 47-mm Teflo) and refrigerated immediately following collection in order to minimize losses of semivolatiles. All gravimetric analyses were conducted at the Harvard School of Public Health using a Mettler MT-5 microbalance in a particle-free environment of controlled temperature (18–24 °C) and relative humidity (35–45%). Filters were equilibrated for a period of 24 hr prior to initial weighing and 48 hr prior to postsampling weighing. For quality assurance, all PM2.5 sample masses were blank-corrected using the mean mass (19.5 µg) of the field blanks (n = 114). The limit of detection (LOD) for PM2.5 was calculated to be 3 times the standard deviation of the field blank values and equated to 5 µg/m3. Only a single sample was below the LOD. Further details on sampling, analysis, and quality assurance relating to the PM2.5 data can be found elsewhere (Brown et al., Citation2008).
Model development
We matched selected PM2.5 and VR sites based on proximity between sites, selecting those that were relatively close to one another (less than ~35 km between paired VR and PM2.5 collection locations). Matched PM sites included Kuwait University (central site), Um-Al-Aish (northern site), and Um-Al-Haiman (southern site), with elevations of 18, 80, and 26 m above sea level, respectively. These sites are visually depicted in . The majority of PM2.5 samples were collected at the central site (n = 531), nearly every day from February 2004 to October 2005. This was an urban site impacted by traffic along with residential, commercial, and other local sources. Samples were collected approximately once per week from February 2004 to February 2005 at the northern site (n = 48) and once per week from February 2004 to July 2005 at the southern site (n = 69). Samples at the northern and southern sites were not collected on the same day of the week; therefore, our data included both weekend and weekday observations across all sites. In contrast to the central site, the northern site was located in a remote desert area. This site was not near urban traffic or other such sources and was generally upwind of urban centers. The southern site was located near both urban and industrial areas and was therefore more similar to the central site. This site was located downwind of multiple refineries and other large factories.
Figure 1. Map showing selected PM2.5 and VR sampling stations in Kuwait.
Although VR monitoring in Kuwait was more available (16 stations) over time and geographic space than PM25 monitoring (3 stations), 13 VR sites shared low temporal overlap (<18% in terms of daily observations) with the PM2.5 sites. Of the remaining VR sites, all had high (≥95%) temporal overlap with daily PM2.5 measurements. These three sites were therefore the only VR sites considered for matching with PM2.5 stations. The selection criterion for matching a given VR site (also containing RH data) with a PM2.5 site was based on their proximity to one another. Since Kuwait International Airport was the closest VR site to both our central and southern PM2.5 monitoring sites, VR at this station was matched with PM2.5 observations at both of these PM2.5 sites. That is, the VR data were used twice. Kuwait International Airport is approximately 12 and 36 km from the central and southern PM2.5 monitoring sites, respectively. The northern site was matched with VR monitors at Camp Udairi, which is located approximately 33 km away. Since VR measurements were collected multiple times per day, daily VR represented the daily average of these measurements to enable matching of a single daily VR observation with a single daily PM2.5 observation. The selected VR and PM2.5 monitoring sites for this study are presented in .
Statistical approach
To predict PM2.5, we fit the following multiple linear regression model:
where β1 is the inverse of the effect of VR on PM2.5, β2 is the effect of the squared relative humidity on PM2.5, and α is the regression intercept. We conducted sensitivity analyses by excluding high values of PM2.5 (≥285 µg/m3) to eliminate days with extreme events such as dust storms and other episodic phenomena, where the relationship between VR and PM2.5 may not be accurate, largely due to the difficulty of accurately measuring these variables at such high PM2.5 concentrations.
In this model, inverse VR was used since the functional relationship between PM2.5 and VR is known to be inverse. That is, as PM2.5 increases, VR decreases. Further, VR is not driven by PM2.5 concentrations alone, but also depends on meteorological variables. Specifically, since the extinction efficiency of a particle depends on its size, which for hygroscopic particles is a function of relative humidity, we also considered relative humidity as a covariate in the model (Tang et al., Citation1981; Malm and Day, Citation2001). We used the squared form of RH since the scattering efficiency of PM2.5 has been shown to increase quadratically with increasing RH (Tang et al., Citation1981; Malm and Day, Citation2001). Other forms of this model were also tested, such as using the noninversed and natural log forms of VR as well as the nonsquared form of RH. These alternative variable forms were tested by changing each variable separately as well as both together. Additional variables were also tested for inclusion into the model, such as temperature, wind speed, site, and season. Of note, although we applied an RH cutoff to exclude rainy days, no days exceeded this value. Therefore, all days were retained for model calibration.
After developing the model, predicted and measured daily PM2.5 values were averaged over 3-month periods (trimesters) for each Kuwait site. Trimester averages were used since daily relationships can be noisy and since this model was designed to predict chronic and not daily or peak short-term exposures. Monthly averages were not employed here since there were relatively few daily PM2.5 measurements per month available for pairing with daily VR. Using this approach, a single site containing 12 months of data points is reduced to four points following trimester averaging (each point representing a 3-month average). This was done for predicted and measured values. To assess the performance of the model, trimester averages of measured and predicted PM2.5 were then plotted for comparison. In order to verify that predictability was not affected by site-to-site variation of the PM2.5-VR relationship, we explored a mixed-effects model allowing for random slopes by site.
To validate the final model, we performed a 10-fold cross-validation analysis. That is, our data set was randomly sorted and divided into 10 splits. The model, fit to 90% (nine splits) of the data, was then used to predict the remaining 10% (one split). This process was repeated 10 times, holding out a new 10% split of data for each iteration. Goodness of fit for predictions was examined by comparing predicted and measured trimester average concentrations and their associated percent mean relative errors (%MRE). Percent MRE was calculated as [(Measured concentration − Predicted concentration)/Measured concentration] multiplied by a factor of 100. This produces an easily interpretable error that is in the form of a percent of measured values.
For further validation, we fit the model using only the central site data and then predicted PM at the northern and southern sites. Since our data set is heavily dominated by observations collected at the central site, this validation approach helps us determine whether the model can be used to predict PM2.5 sites at a distance from the Kuwait International Airport.
Estimation of spatial and temporal variability
To examine the extent of spatiotemporal variability of predicted monthly PM2.5 concentrations, we applied our final validated model using over a decade of weather data (2000–2012) to predict monthly average PM2.5 mass at 104 different sites where VR readings where available, including at military locations in Iraq (30 sites), Afghanistan (54 sites), United Arab Emirates (U.A.E.) (11 sites), Kuwait (6 sites), Djibouti (1 site), and Qatar (2 sites). Only months with at least 90% of daily measurements available were used. As with model calibration, an exclusion criterion for rainy days was applied, resulting in the exclusion of approximately 5% of days. Note that although countries where PM2.5 was predicted also include Kuwait, predictions for Kuwait were for a time period different than that used in model calibration.
For further quality assurance of predictions, we compared the predicted seasonal PM2.5 averages of our Kuwait study region with seasonal averages of all other regional sites. To do this, predicted averages for a given season were averaged together over the group of three Kuwait study sites as well as for sites of additional countries in Southwest Asian and Afghanistan. Averages for calibration sites and individual countries were then juxtaposed in a scatter plot for comparison. Season was divided into fall (September–November), winter (December–February), spring (March–May), and summer (June–August) categories.
Results
In selecting the final calibration model (eq 1), additional variables were also tested for inclusion such as temperature, wind speed, and site. However, these terms were not statistically significant (p values ranging from 0.34 to 0.80) and were therefore left out of the model. Of the chosen model variables, other mathematical forms were tested (e.g., inverse, natural log, etc.) but had a negligible impact on the predictive ability of the model. To identify a PM2.5 concentration cutoff for the regression analysis, cutoffs ranging from 100 to 320 µg/m3 were explored. A cutoff of 285 µg/m3 was selected because it resulted in the best model predictability when trimester averages of measured and predicted PM2.5 were compared (r2 = 0.84). Using this cutoff resulted in the exclusion of nine PM2.5 observations, or less than 2% of our data. When higher concentration days were left in our linear calibration model, however, results still had a high r2 of 0.75. Due to the limited data, we chose not to fit a linear model using PM2.5 exceeding 285 µg/m3. However, above this value, the PM2.5-VR relationship may deviate only slightly from linearity as PM2.5 increases. presents effect estimates for model covariates, along with standard errors, and P values.
Table 1. Output for PM2.5 predictive model.
shows predicted versus measured PM2.5 concentrations after calibrating the model using 639 matched PM2.5 and VR measurements from the three Kuwait study sites. To generate this graph, data at each site were averaged over 3-month periods, producing a total of 20 data points. We chose to assess 3-month averages due to limited site-specific PM2.5 data and our objective to predict PM2.5 exposures over longer periods. Regressing these trimester averages (PM2.5 predictions versus PM2.5 measurements) resulted in an r2 value of 0.84, indicating a good predictive ability of the model. Additionally, the average %MRE of the predictions was −4.5%, indicating little bias.
Figure 2. Relationship between trimester-averaged predictions and the corresponding PM2.5 measurements in Kuwait.
To assess the extent to which the regression is driven by the highest data point in , we also fit a line in the absence of this point. The regression equation, however, changed only negligibly when this point was removed (y = 0.76x + 10.44). The r2 value changed more noticeably after removing this point, but still showed a good relationship (r2 = 0.77). Finally, we applied a mixed-effects model allowing for random slopes by site in order to assess the impact of site-to-site variation of the PM2.5-VR relationship. The mixed model, however, showed the random site terms to be non-statistically significant and did not result in meaningful improvement to the prediction of PM2.5 (r2 = 0.85).
presents 10-fold cross-validation results as well as predicted and measured PM2.5 concentrations, and %MREs. Each trial represents the average of a nonoverlapping 10% split of data. Trial averages (including %MREs) were calculated by first averaging within the various trimesters of a single trial. Subsequently, these trimester averages were averaged for that trial to get an overall trial average. This approach resembles the way in which a person’s exposure would be predicted for an epidemiological study. That is, by averaging PM2.5 over specified intervals (trimesters or months), and then using these averages to calculate total exposure. In the table, %MREs are not presented in absolute value form in order to show the direction of potential model bias. Overall, PM2.5 was predicted well as trial %MRE values were nearly all under 15%. That negative %MRE values occurred at a higher frequency than positive values suggests a tendency towards over prediction of PM2.5. This tendency, however, was minimal overall (average %MRE = −5.3%) and therefore unlikely to be of consequence.
Table 2. Results of 10-fold cross-validation of mean trimester-averaged PM2.5 predictions and measurements.
shows validation results from fitting the model to Kuwait data at only the central study site (~80% of total Kuwait calibration data) and then predicting PM2.5 for two nonrandom divisions of the remaining data (northern and southern sites). Data collected at the northern and southern sites constituted 7% and 11% of our total data (after PM <285 µg/m3 restriction), respectively. The plot of predicted versus measured PM2.5 produced a high r2 of 0.87. This suggests that the model also predicted well at the northern (33 km) and southern (36 km) sites, away from the central site. Since the r2 value was high, it appears that our use of mostly central site data (an urban location) for model calibration did not inhibit our ability to predict well at the other sites that included urban and rural locations. As the relationship shown in may be greatly influenced by the highest data point, we also fit a line in the absence of this point. Though reduced, the r2 remained high at 0.75.
Figure 3. Internal cross-validation using trimester-averaged predicted versus measured PM2.5 for the northern and southern sites in Kuwait.
presents a histogram showing the frequency distribution of predicted monthly PM2.5 exposure means for 104 locations, including Iraq, Afghanistan, United Arab Emirates, Kuwait, Djibouti, and Qatar (spanning 2000–2012), to illustrate the extent of PM2.5 exposure variability that could be expected for an epidemiological study of military personnel stationed at different locations. To enable better resolution, this plot restricts data to monthly averages below 200 µg/m3. This resulted in the elimination of five predictions, with 3,964 predicted monthly averages remaining. Predicted averages ranged from approximately 10 to 365 µg/m3 across these locations, with an overall mean and standard deviation of 42.8 and 22.7 µg/m3, respectively. The median was 37.0 µg/m3, suggesting a right-skewed distribution. When averaging predictions by site, predicted PM2.5 ranged from 22.4 to 79.7 µg/m3 over the 74 sites investigated (only sites with 12 or more months of data).
Figure 4. Frequency distribution of monthly PM2.5 predictions for 104 military sites in Southwest Asia and Afghanistan from 2000 to 2012.
presents a scatter plot of predicted PM2.5 concentrations averaged by month using the same data from . In this case, individual monthly predictions are visible, as is the variability in predictions over time. As with , this plot only shows predictions below 200 µg/m3 to enable better resolution, therefore excluding the five highest predictions (maximum = 365.0 µg/m3). Within-site variability of monthly average predictions was similarly large, with predictions ranging by as much as 346 µg/m3 (maximum − minimum concentration) for a single site. Over 50% of sites, and 20% of sites, had monthly predictions that differed by as much as 73 and 120 µg/m3, respectively, whereas nearly 10% of sites had monthly predictions that differed by more than 136 µg/m3. On average, within-site monthly predictions varied by 83.2 µg/m3, with a standard deviation of 54.4 µg/m3.
Figure 5. Monthly PM2.5 predictions for 104 military sites in Southwest Asia and Afghanistan from 2000 to 2012.
A comparison of seasonal PM2.5 predictions averaged across sites within different countries is provided in . The label “Country Average” refers to the overall average for all countries in the plot (excluding “Calibration Average” sites). In the plot, “Calibration Average” refers to the average predictions across all three Kuwait sites used for model calibration, whereas other country labels simply represent predictions averaged over all sites within those respective countries. It is important to note that seasonal PM2.5 predictions for “Calibration Average” are similar to their corresponding measured values since the model predicted on the same data used for calibration. Therefore, this plot also illustrates the seasonal variability of PM2.5 predictions over Southwest Asia and Afghanistan, compared with the approximate variability of field observations from Kuwait.
Figure 6. Comparison of seasonal average PM2.5 predictions for Kuwait calibration sites and for six countries across Southwest Asia and Afghanistan.
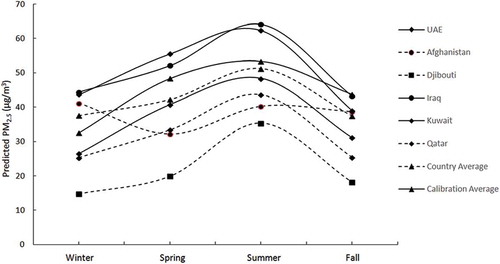
When looking at the intercountry variability of predicted PM2.5 concentrations, nearly every country exhibited a peak in predicted PM2.5 concentrations during the summer season, followed by spring. Fall and winter demonstrated consistently lower PM2.5 concentrations. This pattern is also visible for “Calibration Average.” When comparing “Calibration Average” with “Country Average,” seasonal concentrations were very similar. The overall averages (across seasons) for “Calibration Average” and “Country Average” were very similar, with values of 46.7 and 42.1 µg/m3, respectively.
Discussion
This study demonstrates that VR and relative humidity measurements are useful predictors of chronic PM2.5 exposure in Kuwait. Given the geographic proximity between Kuwait and its neighboring countries, as well as important similarities in climate, land use, and terrain, this study provides for a possible means of predicting chronic PM2.5 in the greater Southwest Asia and Afghanistan region. Calibration of a model to predict PM2.5 in Kuwait resulted in trimester average predictions that correlated well with observed averages (r2 = 0.84). These findings support the use of historical VR data to estimate PM2.5 concentrations in this region of the world. Additionally, this model has high utility for epidemiologists investigating the relationship between chronic exposure to PM2.5 and respiratory diseases among deployed military personnel stationed at various military bases throughout the region. To date, such exposure data in this area is otherwise lacking.
For model performance, 3-month averages were used since daily relationships can be noisy and since this model is designed to predict chronic and not daily or peak short-term exposures. That is, our goal was to predict PM2.5 concentrations that are meaningful for assessing chronic exposure in a given individual. We used trimester rather than monthly averages because calibration requires PM2.5 measurements, of which there were few available per month. For epidemiological studies, however, the availability of daily data will enable the estimation of average monthly exposure since daily VR data are available, as demonstrated in this study. This approach will reduce exposure error and is ideal since military personnel are often deployed for only a matter of months.
Several means of validating our model were conducted. Ten-fold cross-validation analysis showed our model to predict well across randomly divided splits of data, as %MRE values were mostly under 15% for each validation trial. Further, given that prediction errors were low on average (~5%), bias appears to be minimal. Although our model calibration used data mostly collected at a single site, further internal validation showed predictability to remain high at sites exterior to this site, including at both urban and rural locations.
A mixed-model regression analysis was conducted to identify potential differences in the PM2.5-VR relationship between sites. Results demonstrated that PM2.5 predictability did not depend on site. Although our study region covered only a limited geographic region, this result is consistent with Abdeen et al. (Citation2014) who showed that the soluble fraction of PM2.5 aerosols did not vary greatly across three countries in the Middle East, indicating that PM2.5 particles were similarly hygroscopic between countries.
A limitation in using VR measurements is that VR monitors inherently predict PM2.5 levels less accurately in cleaner atmospheres since they are restricted to finite maximum readings. In our study region, however, PM2.5 levels are sufficiently high such that daily PM2.5 can be predicted for the majority of days without this issue. This is demonstrated by our internal cross-validation, where the model predicted well for average trimester PM2.5 concentrations as low as 20.5 µg/m3. Monthly average predictions for 104 sites in Southwest Asian and Afghanistan were as low as 10 µg/m3. Based on previous reporting, long-term PM2.5 concentrations below these levels are not expected to occur in this region (NRC, Citation2010).
Notably, the model in this study was calibrated after excluding days of extremely high PM2.5, where the relationship between VR and PM2.5 may not be accurate due to events such as dust storms and other episodic phenomena. To understand the potentially different PM2.5-VR relationship at higher PM2.5 concentrations, a model that uses penalized splines can be considered. For this study, however, we did not have enough data to appropriately fit splines to assess the potential for nonlinear relationships at higher concentrations.
In assessing seasonal PM2.5, predicted seasonal averages and patterns for Southwest Asian and Afghanistan closely resembled that reported in Kuwait during most seasons, which lends support for the quality of our predictions. Furthermore, seasonal averages for calibration sites in Kuwait as well as Southwest Asia and Afghanistan are consistent with previous PM studies of the area. Specifically, summer is known to be the peak season in terms of elevated PM concentrations due to seasonal shamal winds. Similarly, winter levels are usually low throughout the region.
To examine the extent of spatiotemporal variability of predicted monthly PM2.5 exposure in Southwest Asia and Afghanistan, we applied our calibrated model using over a decade (2000–2012) of weather data to predict PM2.5 mass at 104 different military bases and airports in the region. Results showed predicted monthly averages to range from approximately 10 to 365 µg/m3 between bases. Within-site variability was similarly high. Over 50% of sites, and 20% of sites, had monthly predictions that differed by as much as 73 and 120 µg/m3, respectively. On average, within-site monthly predictions varied by 83.2 µg/m3. Importantly, although excluding days with precipitation could overestimate PM exposure, this is of negligible concern in this study due to the low frequency of rainy events in this region. Further, of the days we defined as rainy, 50% saw rain for less than 3 hr.
That PM2.5 variability is large across time and geographic space in our study region suggests the ability to successfully use such data in epidemiological research. This is of high relevance to understanding the health implications of military deployment to Southwest Asia and Afghanistan. To date, very little PM2.5 exposure data in this region exist partly due to the difficulties inherent to many military zones; namely, limited materials and available personnel to conduct the monitoring, variable temperatures and harsh weather conditions, lack of electricity, as well as low priority relative to the military mission at hand. Additional reasons for the paucity of PM2.5 data include the scarcity of regional PM2.5 monitoring stations as well as the impracticality of outfitting soldiers with personal monitors in the field. As these conditions are unlikely to change, a means of assessing PM2.5 exposure that does not rely on these factors is essential. This study aims to fill this gap.
Finally, the PM2.5 predictions in this study are consistent with measured PM2.5 reported in previous studies. The DOD Enhanced Particulate Matter Surveillance Program, for instance, reported average PM2.5 concentrations ranging from 33 to 117 µg/m3 across 15 sites in Southwest Asia and Afghanistan, with an average concentration of approximately 70 µg/m3 across all sites (Desert Research Institute [DRI], Citation2008). Other studies conducted in this region have reported similar findings, with average concentrations ranging from approximately 20 to 320 µg/m3, depending on the site (Brown et al., Citation2008; Goudarzi et al., Citation2014; Tsiouri et al., Citation2015). Consistency with previously reported measurements reinforces the quality of our PM2.5 predictions as well as suggests that PM exposure among U.S. military personnel is in excess of EPA as well as World Health Organization PM standards. This underscores both the importance of future epidemiological studies in this area and the importance of continued research in the area of predictive PM2.5 exposure modeling in the Southwest Asia and Afghanistan region, particularly relating to the population of deployed military personnel.
Supplemental_Doc.docx
Download MS Word (41 KB)Acknowledgment
The authors appreciate the assistance of Mike Hunsucker and Jeff Zautner, 14th Weather Squadron (USAF), Asheville, NC.
Funding
This work was supported by the VA Cooperative Studies Program #595: Respiratory Health and Deployment to Iraq and Afghanistan, from the United States (U.S.) Department of Veterans Affairs, Office of Research and Development, Clinical Science Research and Development, Cooperative Studies Program. This publication was also made possible by U.S. Environmental Protection Agency (EPA) grant RD-83479801. Its contents are solely the responsibility of the grantee and do not necessarily represent the official views of the EPA, U.S. Department of Veterans Affairs, or U.S. Government.
Additional information
Funding
Notes on contributors
Shahir Masri
Shahir Masri is a recent doctor of science graduate from the Department of Environmental Health, Harvard T.H. Chan School of Public Health, in Boston, MA.
Eric Garshick
Eric Garshick is a physician at the in the Pulmonary, Allergy, Sleep, and Critical Care Medicine Section of the VA Boston Healthcare System, and professor of medicine at the Harvard Medical School.
Jaime Hart
Jaime Hart is an epidemiologist in the Department of Medicine, Channing Division of Network Medicine, at Brigham and Women’s Hospital in Boston, MA.
Walid Bouhamra
Walid Bouhamra is a professor in the Department of Chemical Engineering at the College of Engineering and Petroleum, in Kuwait University, Kuwait.
Petros Koutrakis
Petros Koutrakis is a professor of environmental sciences at the Harvard T.H. Chan School of Public Health.
References
- Abbey, D.E., M.D. Lebowitz, P.K. Mills, F.F. Petersen, W.L. Beeson, and R.J. Burchette. 1995a. Long-term ambient concentrations of particulates and oxidants and development of chronic disease in a cohort of nonsmoking California residents. Inhal. Toxicol. 7:19–34. doi:10.3109/08958379509014268
- Abbey, D.E., B.E. Ostro, G. Fraser, T. Vancuren, and R.J. Burchette. 1995b. Estimating fine particulate less than 2.5 microns in aerodynamic diameter (PM2.5) from airport visibility data in California. J. Expos. Anal. Environ. Epidemiol. 5:161–180.
- Abdeen, Z., R. Qasrawi, J. Heo, B. Wu, J. Shpund, A. Vanger, G. Sharf, Tamar Moise, S. Brenner, K. Nassar, R. Saleh, Q.M. Al-Mahasneh, J.A. Sarnat, and J.J. Schauer. 2014. Spatial and temporal variation in fine particulate matter mass and chemical composition: The Middle East Consortium for Aerosol Research Study. Sci. World J. 2014:1–16. doi:10.1155/2014/878704
- Abraham, J.H., S.F. DeBakey, L. Reid, J. Zhou, and C.P. Baird. 2012. Does deployment to Iraq and Afghanistan affect respiratory health of US Military personnel? J. Occup. Environ. Med. 54:740–745. doi:10.1097/JOM.0b013e318252969a
- Abraham, J.H., A. Eick-Cost, L.L. Clark, Z. Hu, C.P. Baird, R. DeFraites, S.K. Tobler, E.E. Riohards, J.M. Sharkey, R.J. Lipnick, and S.L. Ludwig. 2014. A retrospective cohort study of military deployment and postdeployment medical encounters for respiratory condition. Mil. Med. 179:540–546. doi:10.7205/MILMED-D-13-00443
- Adam, M., T. Schikowski, A. Carsin, Y. Cai, B. Jacquemin, M. Sanchez, A. Vierkötter, A. Marcon, D. Keidel, D. Sugiri, et al. 2015. Adult lung function and long-term air pollution exposure. ESCAPE: A multicenter cohort study and meta-analysis. Eur. Respir. J. 45:38–50. doi:10.1183/09031936.00130014
- Brown, K.W., W. Bouhamra, D.P. Lamoureux, J.S. Evans, and P. Koutrakis. 2008. Characterization of particulate matter for three sites in Kuwait. J. Air Waste Manage. Assoc. 58:994–1003. doi:10.3155/1047-3289.58.8.994
- Burt, E.W. 1961. A study of the relation of visibility to air pollution. Am. Ind. Hyg. Assoc. J. 2:102–108. doi:10.1080/00028896109343378
- Charlson, R.J. 1969. Atmospheric visibility related to aerosol mass concentration: Review. Environ. Sci. Technol. 3:913–918. doi:10.1021/es60033a002
- Demokritou, P., S.J. Lee, and P. Koutrakis. 2004. Development and evaluation of a high loading PM2.5 speciation sampler. Aerosol. Sci. Technol. 38:111–119. doi:10.1080/02786820490249045
- Desert Research Institute. 2008. Department of Defense. Enhanced Particulate Matter Surveillance Program (EPMSP). Reno, NV: Desert Research Institute.
- Downs, S.H., C. Schindler, S. Liu, D. Keidel, L. Bayer-Oglesby, M.H. Brutsche, M.W. Gerbase, R. Keller, N. Kunzli, P. Leuenberger, N.M. Probst-Hensch, J. Tschopp, J. Zellweger, T. Rochat, J. Schwartz, and U. Ackermann-Liebrich. 2007. Reduced exposure to PM10 and attenuated age-related decline in lung function. N. Engl. J. Med. 357:2338–2347. doi:10.1056/NEJMoa073625
- Garshick, E. 2014. Effects of short- and long-term exposures to ambient air pollution on COPD. Eur. Rspir. J. 44:558–561. doi:10.1183/09031936.00108814
- Ge, W., R. Chen, W. Song, and H. Kan. 2011. Daily visibility and hospital admission in Shanghai, China. Biomed. Environ. Sci. 24:117–121. doi:10.3967/0895-3988.2011.02.005
- Goudarzi, G., M. Shirmardi, F. Khodarahmi, A. Hashemi-Shahraki, N. Alavi, K. Ahmadi Ankali, A. Babaei, Z. Soleimani, and M. Marzouni. 2014. Particulate matter and bacteria characteristics of the Middle East Dust (MED) storms over Ahvaz, Iran. Aerobiologia 30:345–356. doi:10.1007/s10453-014-9333-7
- Idso, S.B. 1976. Dust storms. Sci. Am. 235:108–114. doi:10.1038/scientificamerican1076-108
- Institute of Medicine. 2011. Long-Term Health Consequences of Exposure to Burn Pits in Iraq and Afghanistan. Washington, DC: The National Academies Press.
- Jacquemin, B., J.,V. Siroux, M. Sanchez, A. Carsin, T. Schikowski, M. Adam, V. Bellisario, A. Buschka, R. Bono, B. Brunekreef, et al. 2015. Ambient air pollution and adult asthma incidence in six European cohorts (ESCAPE). Environ. Health Perspect. 123:613–621. doi:10.1289/ehp.1408206
- Laden, F., J. Schwartz, F. Speizer, and D. Dockery. 2006. Reduction in fine particulate air pollution and mortality extended follow-up of the Harvard Six Cities study. Am. J. Respir. Crit. Care Med. 173:667–672. doi:10.1164/rccm.200503-443OC
- Malm, W.C., and Derek E. Day. 2001. Estimates of aerosol species scattering characteristics as a function of relative humidity. Atmos Environ. 35:2845–2860. doi:10.1016/S1352-2310(01)00077-2
- Morris, M.J., D.W. Dodson, P.F. Lucero, G.D. Haislip, R.A. Gallup, K.L. Nicholson, and L.L. Zacher. 2014. Study of Active Duty Military for Pulmonary Disease Related to Environmental Deployment Exposures (STAMPEDE). Am. J. Respir. Crit. Care Med. 190:77–84. doi:10.1164/rccm.201402-0372OC
- National Research Council. 2010. Review of the Department of Defense Enhanced Particulate Matter Surveillance Program Report. Washington, DC: The National Academies Press.
- Noll, K.E., P.K. Mueller, and M. Imada. 1967. Visibility and aerosol concentration in urban air. Atmos. Environ. 2:465–475. doi:1016/0004-6981(68)90040-1
- Ostro, B. 1995. Fine particulate air pollution and mortality in two southern California counties. Environ. Res. 70:98–104. doi:10.1006/enrs.1995.1053
- Ozkaynak, H., A.D. Schatz, G.D. Thurston, R.G. Isaacs, and R.B. Husar. 1985. Relationships between aerosol extinction coefficients derived from airport visual range observations and alternative measures of airborne particle mass. J. Air Pollut. Control Assoc. 35:1176–1185. doi:10.1080/00022470.1985.10466020
- Rice, M.B., P.L. Ljungman, E.H. Wilker, K.S. Dorans, D.R. Gold, J. Schwartz, P. Koutrakis, G.R. Washko, G.T. O’Connor, and M.A. Mittleman. 2015. Long-term exposure to traffic emissions and fine particulate matter and lung function decline in the Framingham Heart Study. Am. J. Respir. Crit. Care Med. 191:656–664. doi:10.1164/rccm.201410-1875OC
- Roop, S.A, A.S. Niven, B.E, Calvin, J. Bader, and L.L, Zacher. 2007. The prevalence and impact of respiratory symptoms in asthmatics and nonasthmatics during deployment. Mil. Med. 172:1264–1269. doi:10.7205/MILMED.172.12.1264
- Sanders, J.W., S.D. Putnam, C. Frankart, R.W. Frenck, M.R. Monteville, M.S. Riddle, D.M. Rockabrand, T.W. Sharp, and D.R. Tribble. 2005. Impact of illness and non-combat injury during operations Iraq Freedom and Enduring Freedom (Afghanistan). Am. J. Trop. Med. Hyg. 73:713–719.
- Schikowski, T., M. Adam, A. Marcon, Y. Cai, A. Vierkötter, A. Carsin, B. Jacquemin, Z. Kanani, R. Beelen, M. Birk, et al. 2014. Association of ambient air pollution with the prevalence and incidence of COPD. Eur. Respir. J. 44:614–626. doi:10.1183/09031936.00132213
- Schwartz, J. 1991. Particulate air pollution and daily mortality in Detroit. Environ. Res. 56:204–213. doi:10.1016/S0013-9351(05)80009-X
- Smith, B., C.A. Wong, T.C. Smith, E.J. Boyko, G.D. Gackstetter, and M.A.K. Ryan. 2009. Newly reported respiratory symptoms and conditions among military personnel deployed to Iraq and Afghanistan: A prospective population-based study. Am. J. Epidemiol. 170:1433–1442. doi:10.1093/aje/kwp287
- Szema, A.M., M.C. Peters, K.M. Weissinger, C.A. Gagliano, and J.J. Chen. 2010. New-onset asthma among soldiers serving in Iraq and Afghanistan. Allergy Asthma Proc. 31:67–71. doi:10.2500/aap.2010.31.3383
- Szema, A.M., W. Salihi, K. Savary, and J.J. Chen. 2011. Respiratory symptoms necessitating spirometry among soldiers with Iraq/Afghanistan War lung injury. J. Occup. Environ. Med. 53:961–965. doi:10.1097/JOM.0b013e31822c9f05
- Tang, I.N., W.T. Wong, and H.R. Munkedwitz. 1981. The relative importance of atmospheric sulfates and nitrate in visibility reduction. Atmos. Environ. 15:2463–2471. doi:10.1016/0004-6981(81)90062-7
- Thach, T., C.M. Wong, K.P. Chan, Y.K. Chau, Y.N. Chung, C.Q. Ou, L. Yang, and A.J. Hedley. 2010. Daily visibility and mortality: Assessment of health benefits from improved visibility in Hong Kong. Environ. Res. 110:617–623. doi:10.1016/j.envres.2010.05.005
- Tsiouri, V., K. Kakosimos, and P. Kumar. 2015. Concentrations, sources and exposure risks associated with particulate matter in the Middle East area—A review. Air Qual. Atmos. Health 8:67–80. doi:10.1007/s11869-014-0277-4
- U.S. Environmental Protection Agency. 2016. Particulate matter. http://www.epa.gov/airtrends/pm.html (accessed April 26, 2016).
- Waggoner, A.P., and R.E. Weiss. 1980. Preliminary communication: Comparison of fine particle mass concentration and light scattering extinction in ambient aerosol. Atmos. Environ. 14:623–662. doi:10.1016/0004-6981(80)90098-0
- Yanosky, J., C. Paciorek, and H. Suh. 2009. Predicting chronic fine and coarse particulate exposures using spatiotemporal models for the northeastern and midwestern United States. Environ. Health Perspect. 117:522–529. doi:10.1289/ehp.11692
- Young, M.T., D.P. Sandler, L.A. DeRoo, S. Vedal, J.D. Kaufman, and S.J. London. 2014. Ambient air pollution exposure and incident adult asthma in a nationwide cohort of U.S. women. Am. J. Respir. Crit. Care Med. 190:914–921. doi:10.1164/rccm.201403-0525OC