
ABSTRACT
The interest in biomass fuel is continuing to expand globally and in the northeastern United States as wood pellets are becoming a primary source of fuel for residential and small commercial systems. Wood pellets for boilers are often stored in basement storage rooms or large bag-type containers. Due to the enclosed nature of these storage areas, the atmosphere may exhibit increased levels of carbon monoxide. Serious accidents in Europe have been reported over the last decade in which high concentrations of carbon monoxide (CO) have been found in or near bulk pellet storage containers. The aim of this study was to characterize the CO concentrations in areas with indoor storage of bulk wood pellets. Data was obtained over approximately 7 months (December 2013 to June 2014) at 25 sites in New Hampshire and Massachusetts: 16 homes using wood pellet boilers with indoor pellet storage containers greater than or equal to 3 ton capacity; 4 homes with wood pellet heating systems with outdoor pellet storage; 4 homes using other heating fuels; and a university laboratory site. CO monitors were set up in homes to collect concentrations of CO in the immediate vicinity of wood pellet storage containers, and data were then compared to those of homes using fossil fuel systems. The homes monitored in this study provided a diverse set of housing stock spanning two and a half centuries of construction, with homes built from 1774 to 2013, representing a range of air exchange rates. The CO concentration data from each home was averaged hourly and then compared to a threshold of 9 ppm. While concentrations of CO were generally low for the homes studied, the need to properly design storage locations for pellets is and will remain a necessary component of wood pellet heating systems to minimize the risk of CO exposure.
Implications: This paper is an assessment of carbon monoxide (CO) exposure from bulk wood pellet storage in homes in New Hampshire and Massachusetts. Understanding the CO concentrations in homes allows for better designs for storage bins and ventilation for storage areas. Hence, uniform policies for stored wood pellets in homes, schools, and businesses can be framed to ensure occupant safety. Currently in New York State rebates for the installation of wood pellet boilers are only provided if the bulk pellet storage is outside of the home, yet states such as New Hampshire, Vermont, and Maine currently do not have these restrictions.
Introduction
The United States, especially the New England states and New York and Pennsylvania, are heavily dependent on fossil fuels to provide heat and electricity. According to the U.S. Energy Information Administration (U.S. EIA, Citation2016), energy for space heating, hot water, and industrial heat represents 38% of all energy consumed in these states. The need for energy security and the desire for clean and renewable energy have stimulated the use of alternative heating fuels. Wood pellet use has increased in popularity and wood pellets are one of the largest internationally traded solid biomass commodities, at approximately 4 million tonnes used for energy purposes (Heinimö and Junginger, Citation2009; Sikkema et al., Citation2011). Approximately, 82% of the wood pellets generated in the United States are exported, and the remaining 18% of pellets sales are domestic, supporting winter heating in residential and commercial markets (U.S. EIA, Citation2016). The advantages of wood pellets over other types of biomass such as wood chips or whole logs are their low moisture content, lower emissions, cost, and ease of storage and handling (New York State Energy Research and Development Authority [NYSERDA], Citationn.d.).
While heating with wood has been a common practice for many years, the pellet boiler systems are relatively new in the United States and require a thorough assessment to ensure that both outdoor and indoor pollutants are not significantly increased. An important component of the new pellet boiler systems is the need to store pellets in bulk, 2–10 tons at a time. Pellets stored in this manner can result in the offgassing of high concentrations of carbon monoxide (CO); appropriate care is necessary during manufacturing, handling, and storage of the pellets to minimize exposure to elevated levels of carbon monoxide (CO) and aldehydes (Soto-Garcia et al., Citation2015b, Citation2015c). If precautions are not followed, tragic consequences can result, as documented by Gauthier et al. (Citation2012). The authors investigated two fatalities in German-speaking countries related to CO poisoning when the building occupants entered their wood pellet storage areas. They reported carbon monoxide levels in the storage rooms of 7,500 and > 500 ppm, clearly in the life-threatening range (Gauthier et al. Citation2012).
Carbon monoxide (CO) is a colorless, odorless, and tasteless gas that is toxic to humans when encountered in higher concentrations. The health hazards associated with CO are well documented in the literature and are not significantly reviewed here. However, the acceptable concentrations for exposure are important to understand for both residential and industrial environments. shows common exposure limits/guidelines for CO. These exposure limits/guidelines are typically presented in terms of a time-weighted average (TWA) of the level of CO (ppm) that a person can be exposed to over some period of time, typically 1–8 hr.
Table 1. Summary of regulatory and recommended exposure limits for carbon monoxide.
A series of laboratory studies was conducted by a variety of researchers to investigate the concentrations of CO in enclosed chambers. The laboratory work focused on identifying the emission rates of CO from hardwood and softwood pellets, evaluated the conditions that affect the emission rate, and proposed kinetic models to predict the emissions (Kuang et al., Citation2008, Citation2009; Svedburg et al., Citation2008; Fan and Bi, Citation2013; Soto-Garcia, Citation2015a, Citation2015b). Kuang et al. and Fan and Bi evaluated the emission rates to formulate a kinetic model. Soto-Garcia examined the offgassing from both hardwood and softwood by storing the pellets in steel drums and varying environmental conditions. While the emission rates and airborne concentrations vary to some extent between the published papers, the trends are consistent in that the offgassing causes an increase in CO for 1 to 2 weeks and then the emission rate drops off significantly. The emission rate and CO concentrations increase with temperature and humidity. Recently, a proposed mechanistic pathway for the production of CO from wood pellets was presented in an article by Rahman and Hopke (Citation2016) that expanded on the work conducted by Arshadi et al. (Citation2008). They proposed that hydroxyl radicals are formed as a by-product of the autoxidation of unsaturated compounds in the wood pellet. When these radicals react with hemicellulose, the research found, it results in CO generation at potentially dangerous levels (Rahman and Hopke, Citation2016).
While these laboratory experiments established the foundation for emission rates and factors that affect emission of CO and hydrocarbons, field studies were conducted to assess the CO concentration in living and working environments to assess risk to building occupants. In commercial structures, a number of studies were conducted to identify CO emissions from wood pellets and wood chips during storage and shipping for commercial operations (Soto-Garcia et al., Citation2015b; Yazdanpanah et al., Citation2014a, Citation2014b; Gauthier et al., Citation2012; Kuang et al., Citation2008; Svedburg et al., Citation2004). In residential settings, there are several important published studies that have documented the concentrations of CO near or with in the storage containers inside homes (Svedburg et al., Citation2004; Soto-Garcia et al., Citation2015a). Svedburg et al. investigated the emissions from three household storage rooms, each after the fresh pellets were delivered. Pellets produced during the summer months offgassed in the warehouse, and as a result limited emissions at the homes of end users were observed. Yet during the cold season, the pellets are shipped to the end user shortly after being produced, and hence the emissions are significantly higher in the storage rooms of the end-users. Their conclusions were that the same compounds that were found in the warehouses were found in the homes.
Soto-Garcia et al. investigated storage locations in homes, schools, and small businesses for elevated levels of CO. Using calibrated CO sensors, continuous CO measurements were made in a number of wood pellet storage locations in New York State. The CO sensors, in some cases in conjunction with sensors for CO2, O2, relative humidity, and temperature, were installed in a residential basement, an external storage silo, and several boiler room storage areas in schools and a museum. Peak concentrations in these pellet storage locations ranged from 14 ppm in the basement of a residence to 155 ppm inside the storage silo at a school. While the CO concentrations in the storage facilities were elevated, none were found to be in the range of the extremely high values observed by Gautier et al. (Citation2012).
An important conclusion of these field studies was that storage areas for pellets must be considered confined spaces and require appropriate entry procedures, whether in the home or in a commercial establishment. As the biomass heating with pellets becomes more prevalent, improved designs for storage areas must be considered to minimize the risk of exposure to CO to building occupants and individuals entering the storage area.
The states of New York, New Hampshire, Vermont, and Maine have all developed a significant focus on biomass for heating homes and small businesses. The New York State Energy Research and Development Authority (NYSERDA) has established an incentive program to promote the installation of high-efficiency, low-emission automated wood pellet boilers for use in homes. The new boilers are designed to replace oil-burning boilers, hence providing a more cost-effective means of heating homes, schools, and small businesses. NYSERDA has established a policy that that bulk pellet storage must be outside the home to eliminate the exposure of the occupants to CO. While this policy does eliminate indoor CO, it can still present a risk of CO exposure if individuals enter the storage building without ventilating the space and testing the atmosphere. Other states such as Maine, New Hampshire, and Vermont have elected not to implement restrictions on the pellet storage area at this time.
Exposure to elevated levels of CO in basements and other storage areas adjacent to boilers is a concern because these areas often have limited ventilation. Many building basements can be tightly sealed and insulated to minimize the amount of infiltration of outside air. Furthermore, for those buildings with mechanical ventilation systems, these systems may not introduce enough outside air to the area where the pellets are stored or recirculate the indoor air that has already been heated or cooled. While this strategy is effective for minimizing energy costs, it can have a negative impact on indoor air quality by increasing indoor contaminants that offgas from building materials, cleaning supplies, or materials stored in the home or building, such as wood pellets.
The purpose of this study was to examine the CO concentrations in a number of residences in the states of New Hampshire and Massachusetts where bulk storage of wood pellets is typically done inside the home. Important objectives of the study were to assess the CO concentrations with respect to the American Society of Heating, Refrigerating and Air-Conditioning Engineers (ASHRAE) and World Health Organization (WHO) target concentration of 9 ppm (refer to ). Low-cost monitors were used to maximize the number of homes we could monitor, hence providing a larger data set of CO and temperature. This decision is supported by research that shows that precision error of instrumentation is likely small when compared to environmental variability (Rappaport, Citation1991; Gałuszka et al., Citation2015). While the study locations were residences in New Hampshire and Massachusetts, the results should be applicable to both residential and commercial storage of wood pellets.
Methods
Twenty-four participants suitable to meet the objectives of the study were recruited in the states of New Hampshire and Massachusetts. At each location (home), information describing the type of home, the heating system, and the pellet storage at each site was obtained, and the information is displayed in . Photographs were also taken to document where each pair of monitors was installed as a record of the location of the monitors with respect to the heating and storage systems (e.g., ).
Table 2. Characteristics of the homes included in the study.
Figure 1. A typical wood storage container (bag) used for storage of bulk pellets. The temperature and CO monitors are shown in the upper left corner.
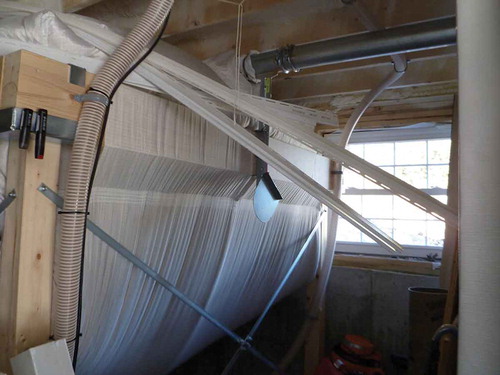
The monitors were typically installed on the outside of the pellet storage containers, for the homes with indoor storage. For the control homes and those with outdoor storage, the monitors were typically placed near the heat source (boiler/furnace/wood stove). The experiment was designed to measure CO in parts per million (ppm), along with temperature (reported in °F), in 16 residences that use wood pellets in their heating systems and store the pellets in the basements. These data are compared to similar measurements made in four homes that use wood pellet fuel but store the pellets outdoors, and in four homes that use a different fuel source for heat. Subhourly data for both CO and temperature were collected from approximately December 2013 to June 2014 in order to obtain both heating and off-season data. Participants were also asked to provide information regarding pellet deliveries.
An important aspect of this study was to test whether CO concentrations exceeded hazardous levels in the home and to compare the measured values to recommended exposure values as defined by ASHRAE and WHO guidelines (). Lascar Electronics, Inc. (Erie, PA), data loggers were purchased. The CO data logger (EL-USB-CO300) covers the range 0–300 ppm and the temperature data logger (EL-USB-1) covers the range –35 to 80°C (–31 to 176°F). The temperature data logger has an accuracy of ±1°C (±2°F) and can operate for a year on a lithium 3.6-V, 1/2AA battery, storing up to 16,382 readings. The CO data logger has a resolution of 0.5 ppm and an accuracy of ±4% or 5 ppm (whichever is greater, i.e., ±5 ppm up to 125 ppm of CO and ±4% at higher concentrations of CO) and can operate for 3 months on a lithium 3.6-V, 1/2AA battery, storing up to 32,510 readings. Its nominal operating range anticipates temperatures within a range of –10 to 40°C (14 to 104°F), assuming relative humidity (RH) is 15–90% and noncondensing. To obtain reliable hourly data in the final data set, the monitors were set to record data at 5-min intervals for CO and at 30-min intervals for temperature. This required downloads at least every 3 months prior to the end of the nominal battery life of the CO monitors. With 25 pairs of monitors to download (16 in homes with indoor pellet storage, 4 in homes with outdoor pellet storage, 4 in homes using nonpellet heating fuels, and 1 that remained in the laboratory at the University of New Hampshire [UNH]), it was not possible to perform all of the installations and downloads in one day. Hence, installations and downloads were typically performed over a couple of weeks at each interval: Installations were done from November 23 to December 4, 2013, the first download from January 28 to February 12, 2014, the second download from April 22 to May 1, and the third download from June 10 to June 16 (with the exception of three sets recovered in August, with final data recorded on August 12–15).
Each monitor pair was numbered prior to installation. Throughout this paper, monitors are referred to by number and/or by type: Control refers to homes that do not use wood pellet fuel, as well as the laboratory monitor pair; outdoor refers to homes storing pellets outdoors; indoor refers to homes storing pellets indoors. Predeployment calibrations for each monitor were performed, which ensured the monitors were functioning properly prior to deployment. Postdeployment calibrations were also performed and were used to calibrate the raw data in order to produce the final data set. The CO monitors have a resolution of 0.5 ppm; that is, data are recorded with values of 0, 0.5, 1.0 1.5, 2.0, 2.5 ppm, and so on.
Results and discussion
We were fortunate in being able to recruit participants who offered a diverse array of housing stock with dwellings representing two and a half centuries, built from 1774 to 2013. There were homes with finished and unfinished basements. Different heating sources included oil, propane, a wood stove fired with wood pellets, and various pellet boiler systems.
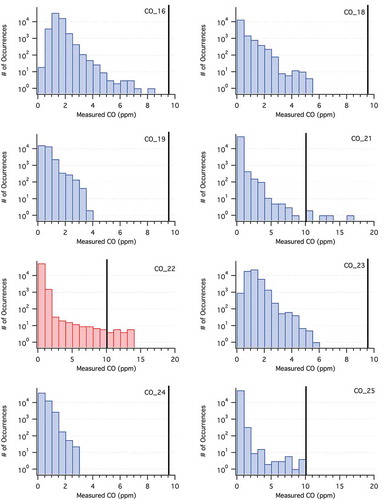
Frequency distributions of the 5-min CO measurements are listed in Table S1 and shown in , , , and , where vertical black lines denote 9 ppm of CO. Three scales are used to bin the frequencies: 0–9.5, 0–19.5, and 0–199.5 ppm. Note that a logarithmic scale is required for the y-axis in order to make the few data points present at higher concentrations legible. The majority of CO monitors (15 out of 25) did not record a CO concentration greater than 9 ppm during the sampling period (), including the controls. Three monitors recorded 1–9 counts in less than 4 bins between 9.0 and 19.5 ppm (homes 7, 15, and 21), which were likely spurious readings out of the tens of thousands recorded data points by each monitor (Table S1). The data for these 16 monitors located inside homes are shown in and . Seven of the 16 monitors show levels above 9 ppm, 5 of which required a frequency distribution scale that extended to 199.5 ppm. Of these 7 monitors, the frequency of 9 ppm exceedances were low, yet elevated levels are always of concern and understanding the source of CO is important to minimize risk to building occupants.
Table 3. Mean ± standard deviation of the CO concentrations in ppm measured by each monitor over approximately 1-hr intervals for each calibrated CO test. Note. The calibration concentrations are shown as the column headings. No calibration data are available for CO monitors 1, 18, and 24.
Figure 2. Histograms showing the frequency distributions for CO monitors in the laboratory and control homes. Measurements resolution was 5 min. Black lines demarcate complete bins up to and including 9 ppm (to the left) and greater concentrations (to the right).
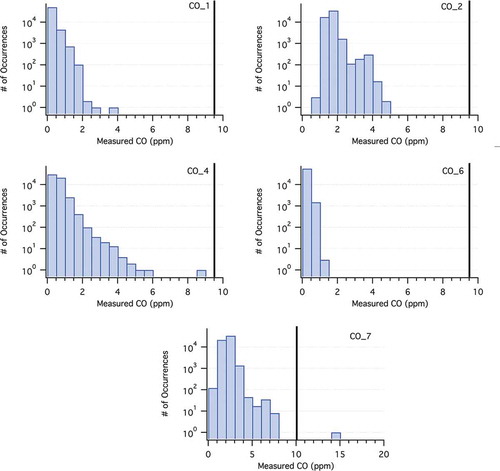
Figure 3. Histograms showing the frequency distributions for CO monitors in the homes with outdoor pellet storage. Black lines demarcate complete bins up to and including 9 ppm (to the left) and greater concentrations (to the right).
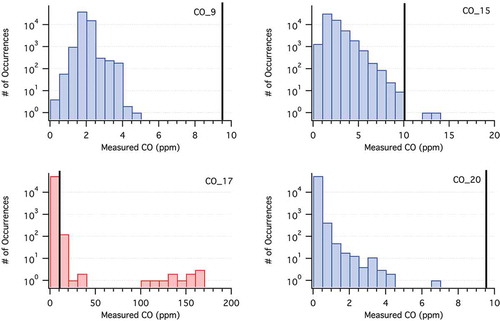
Figure 4. Histograms showing the frequency distributions for CO monitors in the homes (3, 5, 8, 10–14) with indoor pellet storage. Black lines demarcate complete bins up to and including 9 ppm (to the left) and greater concentrations (to the right).
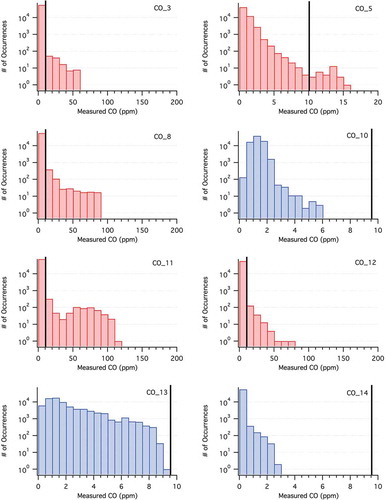
Figure 5. Histograms showing the frequency distributions for CO monitors in the homes (16, 18, 19, 21–25) with indoor pellet storage. Black lines demarcate complete bins up to and including 9 ppm (to the left) and greater concentrations (to the right).
Since the measured concentrations of CO for a large portion of this study were low, the 0.5 ppm precision is evident in the raw data (Supplemental Material, Figure S1) where plots of the raw data often appear as rectangular blocks rather than a smooth curve (e.g., the gray dashed lines for monitors 1, 7, and 9). This is also sometimes apparent in the temperature data as well (e.g., the dashed lines for monitors 2, 3, and 7) with its precision of ±2°F, but given the observed range of temperatures over the course of the experiment, it is less obvious than in the CO data.
This precision in the 5-min CO data can make it difficult to interpret temporal variability over the full duration of the experiment (months). By calculating running 1-hr averages from the 5-min data, temporal variability in the CO data can be more readily discerned at low concentrations (e.g., black lines in the Figure S1: a–i). Similarly, running 1-hr averages are calculated for the temperature data (e.g., red lines in the plots of Figures S1: a–i). In both cases a boxcar algorithm was applied using 13 points for the CO data and 3 points for the temperature data to provide -hr averages. In the predeployment calibrations, intervals of less than 1 hr were used for each increment of the calibration curve. In the postdeployment calibrations, longer intervals were used in order to allow for the calculation of 1-hr means and standard deviations at each increment of concentration (). Given the critical interest in the 9 ppm threshold, calibrations were performed to test the precision of the monitors around this threshold. This was done to ensure that higher concentrations did not potentially skew the calibration curves to provide greater accuracy at higher values where more error can be tolerated for this particular study.
The calibration curves obtained for each CO monitor are shown in Figure S2 grouped according to the type of home in which they were placed: control (Figure S2a), outdoor (Figure S2b), and indoor (Figures S2c and S2d). Note that there were three monitors from which postdeployment calibrations could not be obtained: 1, 18, and 24. Monitor 18 was damaged beyond repair during the second download period, such that no data could be obtained at the second download. Since the study was drawing to a close, that monitor was not replaced. Data from location 18 are limited to the first download period only. Monitors 1 and 24 failed after the monitoring portion of the study concluded. Hence, data are available for all three download periods, but calibration curves cannot be constructed for those two monitors. For all three of these monitors, the smoothed raw data (i.e., 1-hr averages) are presented rather than calibrated data, but as discussed in the following, this is unlikely to have any effect on the interpretation of the data acquired with these particular monitors during the measurement period.
The calibrations show that most of the monitors performed according to manufacturer specifications, that is, within ±5 ppm over the calibrated range and with a zero offset within ±2 ppm (Figure S2: a–d). Some of the monitors provided data very near the calibration values, especially 15 (Figure S2b), and 12 and 13 (Figure S2c). The curves are distributed evenly around the expected values with about half of the monitors registering values that are too high and the rest too low compared to the known values (as indicated by the black lines in Figure S2). The known values were determined using a 104 ppm CO calibration standard (Scott Marin, Inc., Riverside, CA) with precisely measured dilutions using mass flow controllers (MKS Instruments, Andover, MA) and measured with a CO trace gas analyzer model 48i-TLE (Thermo Fisher Scientific, Inc., Waltham, MA). For 7 monitors, the largest calibration measurement (expected value: 24.2 ppm) fell outside of the ±5 ppm accuracy range, with two too high (7, Figure S2a; 17, Figure S2b) and five too low (20, Figure S2b; 5, 10, and 14, Figure S2c; 22, Figure S2d). Only two monitors, 17 and 22, had two points (the two highest: 17.4 and 24.2 ppm) fall outside of the ±5 ppm range. Hence, the largest differences between the raw and calibrated data are found for this set of seven monitors; all of the other calibration adjustments to the raw data are small (less than ±5 ppm).
The final CO and temperature data are shown in and and Figure S3 along with pellet delivery information, as available. CO concentrations were typically less than 9 ppm; hence the left axes use 9 ppm as the maximum value for all of the CO data shown in and S3. Data collected in homes where the calibrated data exceeded 9 ppm at any time are shown to the right of the solid black line in each plot. For these cases a horizontal line indicates the 9-ppm threshold. Temperature data are shown in gray in all plots and refer to the right axes.
Figure 6. Example calibrated final CO and temperature (T) time series plots for the Controls homes. The CO is identified with blue curves (left axes) and T with gray curves (right axes).
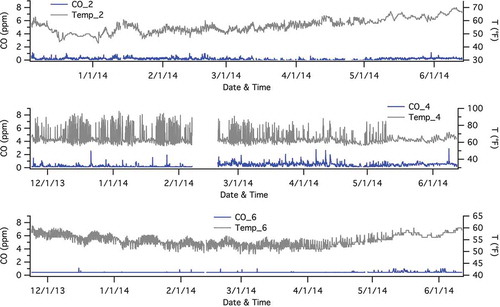
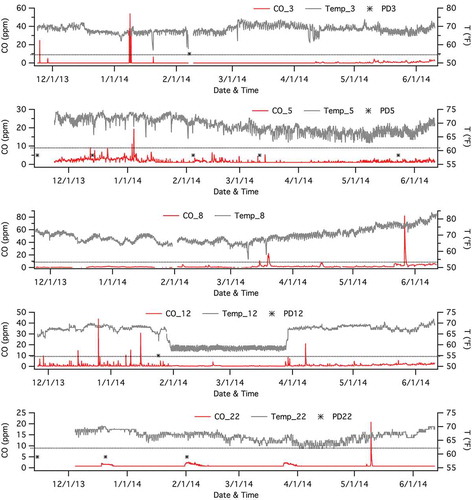
Figure 7. Example plots of calibrated final CO (red curves, left axes) and T (gray curves, right axes) time series for homes with indoor pellet storage where levels of CO exceeded 9 ppm. Final CO (red curves, left axes) and T (gray curves, right axes) data for homes with indoor pellet storage. The 9-ppm threshold is approximately denoted by a horizontal dashed black line in each panel. Pellet deliveries are denoted by asterisks indicating the date of delivery. Not all participants provided pellet delivery information.
Control locations
In all of the control homes, CO () concentrations were low, typically less than 2 ppm, with only a few very brief spikes up to ~4 ppm. Since pellet boilers were not present in these homes, this provides some indication of typical variability in CO monitors or low levels of CO that one might expect in all of the homes without pellet-related contributions, whether related to combustion sources or storage or drift in the CO monitors. Control homes are shown in , where home number is located in the upper right portion of plot.
Location 1 was the pair of monitors kept in the laboratory at the University of New Hampshire. For most of the sampling period CO was below detection, registering zero on the monitor. In the warmer months, the windows were typically opened. The laboratory space was near a road, which might explain more frequent nonzero CO observations in spring (Figure S3a). However, given the precision of these monitors, these data may also simply reflect noise in the data. Note that due to a problem initializing the monitor, no temperature data were recorded for the first download period. A similar glitch affected three other sites as well: 11, 14, and 17.
Locations 2, 4, 6, and 7 were control homes that did not have pellet boilers or pellet storage. Location 2 was the only two-family home (duplex). All monitors were installed in the basement near the heating system. The control homes recorded little CO (typically less than 2 ppm). It is important to note that none of them had an attached garage. Only one reported the storage of a gas-powered piece of equipment (e.g., snow blowers, leaf blowers, lawn mowers, small vehicles like ATVs or motorcycles, etc.) that could be an additional CO source. However, the homeowner reported that it was never started in the vicinity of the monitors. In that sense, these homes provide data that likely reflect typical background values throughout the period of the study, rather than what might be expected whenever gas-powered equipment might be in active use (see ).
Outdoor pellet storage
Results obtained from homes with outdoor pellet storage are shown in and include homes 9, 15, 17, and 20. Further details of the time-series CO concentrations are presented in the supplemental material. The concentrations found in the outdoor pellet storage homes were similar to results from the controls, with the exception of two homes: 15 overall, and 17 only early during the measurement period. For the most part, CO concentrations were less than 9 ppm (Figure S3b).
The outdoor storage homes provided opportunities to measure CO near combustion sources in the absence of wood pellet storage at three sites, as well as in the presence of a storage container without a nearby combustion source at location 9. Location 15 used a wood stove in the living space, while the other two used boilers located in the basement. The data here were similar to those of the control homes, CO concentrations less than 9 ppm over the entire measurement period (excluding the period when the boiler at 17 was known to be malfunctioning). The malfunctioning boiler provided an opportunity to obtain CO concentrations from a known combustion source (a smoking boiler), which was clearly a strong source of CO. The data suggest the pellet boilers release less CO into the air in their immediate vicinity than the wood stove. The data from 9 in comparison with the control homes do not indicate a source of CO from stored wood pellets. As with the control homes, none of the outdoor storage homes had attached garages or other potential CO sources stored near the monitors. Hence the comparison with the controls reflects the differences in heating systems and fuels alone.
Indoor pellet storage
, , and S3 (panels S3c, S3d, and S3e) show the results from homes with indoor pellet storage. Seven of the 16 test homes exhibited levels above 9 ppm, while none of the control homes displayed levels exceeding 9 ppm.
Of the 16 homes with indoor pellet storage, 9 never exceeded 9 ppm (14, 16, 19, 23, 24, 25, Figure S3c; 10, 13, 18, Figure S3d). Another home had just one event that reached 9.1 ppm, yet 6 of the 16 homes tested (3, 5, 8, 11, 12, and 22, Figure S3d and S3e) exceeded the 9-ppm threshold on a number of occasions. Eleven homes had attached garages or had gas-powered equipment (potential CO sources) in use or stored in the vicinity of the pellets. Of the remaining 5 homes where 9 ppm of CO was exceeded (), two had doorways directly leading to attached garages, one rarely used (3) and one used more regularly (12). Another used the space near the wood pellet storage and heating system to store a motorcycle, with the largest event reported by the homeowner as an occasion when the motorcycle was started in the vicinity of the CO monitor (8). The magnitudes of these garage/gasoline-engine events are similar, as is their relatively brief duration. In home 5 the sources of the few events when CO concentrations were >9 ppm was not related to any reported events by the homeowner and hence remain unattributed. However, the transient duration of these events likely suggests a combustion source. Although the pellet delivery record from this set of 16 homes is incomplete, only one home (22) provided a CO concentration record that may indicate an emission source related to wood pellet storage. However, the delivery dates provided by the homeowner are a day or two after the onset of the CO events, and concentrations are enhanced by only ~1 ppm or less. If these are indeed wood pellet emissions, this would suggest that, if present, the signal is lost in the typical background noise of CO as measured in all of the homes (controls, outdoor storage, and indoor storage). Among the set of data collected from the 16 indoor storage homes, the one record that stands out as unusual is 13 (Figure S3d), and yet this record is also among the set of those consistently less than 9 ppm.
Also, it is important to note that at any of these homes, the size, headspace volume, ventilation, and the possible infiltration in the storage room were not measured, which can have a significant impact in the amount of CO observed (Kuang et al., Citation2009; Emhofer et al., Citation2015). Wallace et al. found that for most homes air change rates, assuming windows closed, ranged from 0.30 to 1.9 (Wallace et al., Citation2002; Howard-Reed et al., Citation2002) per hour. Given the published offgassing rates of CO from pellets in the range of 10−5 mg CO/kg pellets/min, a relatively small amount of ventilation can provide protective measures (Meier et al., Citation2016; Soto-Garcia et al., Citation2015b; Fan and Bi, Citation2013; Kuang et al., Citation2009). Hence, from these data, it appears that most homes had infiltration rates that may have helped maintain the low CO concentrations. In addition, Emhofer et al. (Citation2015) discussed that the infiltration rate of outside air into the storage bag through the fill tube (~4–6 inches in diameter) may provide enough ventilation to minimize CO buildup. A previous field study that measured the CO offgassing from stored wood pellets at a home and small business observed concentrations as high 35 ppm shortly after fresh pellets were delivered. However, CO concentrations were reduced to below background levels within a few days. Interestingly, in a Soto-Garcia et al. study, it was observed that some homeowners opened windows to ventilate their basement after a new shipment of pellets was delivered, not to ventilate for CO, but because the occupants were experiencing eye and throat irritation from volatile organic compounds offgassing from the wood pellets (Soto-García et al., Citation2015a).
At each location (home), information describing the type of home, the heating system, and the pellet storage at each site was obtained and is displayed in . The data in were based on interviews with the occupants of the building, and observations were made by research assistants visiting each home. There were cases when other sources of combustion (heating sources, internal gas-powered engines) were found to be stored in the same area as the pellets; these were noted as other possible sources of CO. Also, in some cases the pellet storage area (usually the basement) had a door to a garage where automobiles and/or snow blowers were started, likely resulting in some infiltration of CO from these engines. In this study design, it was not possible to quantify specific contributions from these alternate sources, yet the short spikes in concentrations from these sources were an indicator that the CO would not have been from offgassing of the pellets. As an example, home number 12 had a garage attached to the basement, as well as an all-terrain vehicle and a snow blower stored in the basement. The owner indicated that he would move the items from the basement into the garage and start the engines prior to use. The data for that home did show short periods of elevated CO concentrations that would be consistent with short-term infiltration from the garage (see Figure S3e).
The preceding analysis was organized using 9 ppm as the reference concentration above which one might contemplate mitigation strategies to reduce the observed concentrations of CO. Conversely, below 9 ppm the concentrations are assumed to have a minimal effect on indoor air quality such that any mitigation is both unnecessary and unlikely to succeed (i.e., if the control home data indicate typical indoor background levels near home heating sources then reductions beyond those values may be difficult). If the 9-ppm threshold is arbitrary or found to be too high for optimum human health, then the data analysis should be revised according to whatever alternative standard is deemed appropriate. For this study, however, the conclusions proceed from the assumption that concentrations less than 9 ppm are acceptable. However, as biomass pellet boilers are used on an expanded scale, the precautionary messages communicated to the homeowners and commercial establishments will be important to ensure storage areas are provided with enough ventilation to maintain CO levels similar to back ground concentrations. It is important that building occupants or maintenance personnel are not lured into a false sense of security with respect to the potential risk of CO emissions from pellets. As an example, if the pellets are stored in a room with little to no ventilation, CO levels will rise to life-threatening levels (Arshadi and Gref, Citation2005; Arshadi et al. Citation2008; Soto-Garcia et al., Citation2015b). The data from this study show most CO concentrations are very low for the homes evaluated, which suggests that these homes had adequate ventilation.
Given this critical dependence on the 9-ppm threshold, the second concern here is the precision and accuracy of the data obtained. With many community monitoring projects affordable monitors are important to ensure a large enough data set can be obtained. The relatively inexpensive monitors, the CO (EL-USB-CO300) and T (EL-USB-1) data loggers from Lascar Electronics, Inc. (Erie, PA), were selected due to their range of operation, ease of deployment, and price. In particular, the CO monitor range of 0–300 ppm was the best option for this application. However, 9 ppm is at the low end of the nominal operating range of these sensors; thus, the precision of 0.5 ppm limits the level of detail one can obtain from the data record at lower CO levels. From the calibration tests, it was not clear that these monitors could distinguish between 0 and 0.5 ppm of CO. Given a zero offset of ±2 ppm this is not a surprise. In fact, we were encouraged in reviewing the calibration data to find that every monitor could clearly distinguish 3.3 ppm from 0.5, even if a correction factor was needed to obtain the properly calibrated value. Given that the lowest recommended value is 9 ppm, the calibrated monitors were able to provide reasonably accurate reads well below 9 ppm. Hence, the calibrations were performed only over the range of 0.5–24.2 ppm (the exact values were chosen for convenience based on a 104-ppm standard tank of CO and simple dilution ratios). During the calibration tests of each monitor, the recorded values were typically within ±0.5 ppm of each other at each concentration evaluated (i.e., one discrete measurement interval), although a few exhibited variability of ±1.0 ppm (i.e., two discrete measurement intervals). This suggests a self-consistency within the ±5 ppm accuracy specified by the manufacturer that should result in consistent data from each monitor, even if there is a calibration offset. By smoothing the 5-min data over 1-hr intervals, any spurious data records should be minimized and a reliable signal obtained even at low values. The data obtained from these monitors was adequate to characterize the 9-ppm threshold in this study.
Conclusion
The goal of this study was to provide data to address the question of whether bulk wood pellets storied in homes and buildings are in fact offgassing enough CO to exceed recommended limits (9 ppm) and put occupants at risk. The key to ensuring public safety is ensuring that the manufacturers, distributors, business owners, and homeowners all understand that potential for exposure exists and storage areas must have redundant controls built in to eliminate the risk of over exposure. These redundant controls should include a CO monitoring device with an alarm at the entrance to the storage area, and adequate ventilation in the storage area. In addition, a sealed storage room separate from the boiler area and basement may be the best course of action in some homes/commercial buildings. However this configuration does not eliminate the CO hazard, as these storage areas will still need to be accessed by maintenance personnel and building occupants. Hence, all storage rooms/buildings must have adequate ventilation and a CO monitoring device with a visual read out. Regardless of a governmental policy or lack of policy regarding the storage of wood pellets, the history of CO emissions related to wood pellet storage makes awareness and designing for safety a prudent approach to minimize the risk to home/building occupants. All pellet storage rooms and areas must always be ventilated properly and tested with a CO monitor before anyone enters the storage space, regardless of the age of the pellets or length of storage.
Supplemental Materials
Download PDF (2.9 MB)Acknowledgment
The authors thank all of the participating homeowners for their generosity in opening their homes to us for this study. This project could not have been done without the support and encouragement of Barbara Bernstein at the New Hampshire Public Utilities Commission, who recruited the participants and promoted the adoption of this technology in New Hampshire. Sherry Godlewski, for her assistance and guidance, Sarah Schulenberg and Chris Dorich, for their performance of the fieldwork, and Eric Scheuer, for his assistance with the calibrations, are all gratefully acknowledged.
Funding
This project was funded by NYSERDA under contract 32761.
Supplemental data
Supplemental data for this paper can be accessed on the publisher’s website.
Additional information
Funding
Notes on contributors
Alan Rossner
Alan Rossner is Director of Environmental Health Science and Environmental Science & Policy undergraduate programs at Clarkson University. He is also Associate Director of Clarkson’s Institute for a Sustainable Environment. Dr. Rossner conducts research in the areas of industrial hygiene and environmental health science.
Carolyn E. Jordan
Carolyn Jordan is an associate research fellow at the National Institute of Aerospace and is a member of NASA Langley’s Aerosol Research Group Experiment (https://science.larc.nasa.gov/large). She is also a member of NASA’s GEO-CAPE science working group helping to foster interdisciplinary science between the ocean color and atmospheric composition teams. At the time of this research Dr. Jordan was on the staff of University of New Hampshire.
Cameron Wake
Cameron Wake is the Josephine A. Lamprey Professor in Climate and Sustainability, UNH–Sustainability Institute, University of New Hampshire. Cameron Wake also helps lead Climate Solutions New England, a collaborative effort to secure healthy, prosperous, and sustainable communities through the pursuit of integrated solutions that include building energy self-reliance and weather resilience.
Lydia Soto-Garcia
Lydia Soto-Garcia was a research assistant at Clarkson University.
Related Research Data
References
- Arshadi, M., and R. Gref. 2005. Emission of volatile organic compounds from softwood pellets during storage. Forest Prod J. 55:132–5.
- Arshadi, M., R. Gref, P. Geladi, S.Dahlqvist, and T. Lestander. 2008. The influence of raw material characteristics on the industrial pelletizing process and pellet quality. Fuel Process Technol. 89:1442–7. doi:10.1016/j.fuproc.2008.07.001
- Emhofer, W., K. Lichtenegger, W. Haslinger, H. Hofbauer, I. Schmutzer-Roseneder, S. Aigenbauer, and M. Lienhard. 2015. Ventilation of carbon monoxide from the biomass pellet storage tank—A study of the effects of variation of temperature and cross-ventilation on the efficiency of natural ventilation. Ann. Occup. Hyg. 59:79–90.
- Fan, C., and X. Bi. 2013. Development of off-gas emission kinetics for stored wood pellets. Ann. Occup. Hyg. 57:115–24.
- Gałuszka, A., Z.M. Migaszewski, and J. Namieśnik. 2015. Moving your laboratories to the field—Advantages and limitations of the use of field portable instruments in environmental sample analysis. Environ. Res. 140:593–603. doi:10.1016/j.envres.2015.05.017
- Gauthier, S., H. Grass, M. Lory, T. Krämer, M. Thali, and C. Bartsch. 2012. Lethal carbon monoxide poisoning in wood pellet storerooms—Two cases and a review of the literature. Ann. Occup. Hyg. 56:755–63.
- Heinimö, J., and H.M. Junginger. 2009. Production and trading of biomass for energy—An overview of the global status. Biomass Bioenergy 33(9):1310–20. doi:10.1016/j.biombioe.2009.05.017
- Howard-Reed, C., L.A. Wallace, and W.R. Ott. 2002. The effect of opening windows on air change rates in two homes. J. Air Waste Manage. Assoc. 52:147–59. doi:10.1080/10473289.2002.10470775
- Kuang, X., T.J. Shankar, X.T. Bi, S. Sokhansanj, C.J. Lim, and S. Melin. 2008. Characterization and kinetics study of off-gas emissions from stored wood pellets. Ann. Occup. Hyg. 52(8):675−83.
- Kuang, X., T.J. Shankar, X.T. Bi, C.J. Lim, S. Sokhansanj, and S. Melin. 2009. Rate and peak concentrations of off-gas emissions in stored wood pellets-sensitivities to temperature, relative humidity and headspace volume. Ann Occup Hyg. 53:789–96.
- Meier, F., I. Sedlmayer, W. Emhofer, E. Wopienka, C. Schmidl, W. Haslinger, and H. Hofbauer. 2016. Influence of oxygen availability on off-gassing rates of emissions from stored wood pellets. Energy & Fuels. 30:1006–12.
- New York State Energy Research and Development Authority. n.d. Residential pellet stove. https://www.nyserda.ny.gov/All-Programs/Programs/Renewable-Heat-NY/Residential-Wood-Pellet-Stove ( accessed February 18, 2017).
- Rahman, M.A., and P.K. Hopke. 2016. Mechanistic pathway of carbon monoxide off-gassing from wood pellets. Energy & Fuels. 30:5809−15. doi:10.1021/acs.energyfuels.6b00874
- Rappaport, S.M. 1991. Assessment of long-term exposure to toxic substances in air. Ann. Occup. Hyg. 35:61–121.
- Sikkema, R., M. Steiner, M. Junginger, W. Hiegl, M. Hansen, and A.T. Faaij. 2011. The European wood pellet markets: current Status and prospects for 2020. Biofuels Bioprod. Biorefining 5:250–78. doi:10.1002/bbb.v5.3
- Soto-García, L., X. Huang, D. Thimmaiah, A. Rossner, and P.K. Hopke. 2015a. Exposures to carbon monoxide from off-gassing of bulk stored wood pellets. Energy Fuels 29:218−26.
- Soto-García, L., X. Huang, D. Thimmaiah, Z. Denton, A. Rossner, and P.K. Hopke. 2015b. Measurement and modeling of carbon monoxide emission rates from multiple wood pellet types. Energy & Fuels. 29: 3715−24.
- Soto-García, L., W.J. Ashley, S. Bregg, R. Lebouf, D.Walier, P.K. Hopke, and A. Rossner. 2015c. VOC emissions from multiple wood pellet types and concentrations in indoor air. Energy Fuels 29(10):6485–93.
- Svedberg, U., H. Hogberg, J. Hogberg, and B. Galle. 2004. Emission of hexanal and carbon monoxide from storage of wood pellets, a potential occupational and domestic health hazard. Ann. Occup. Hyg. 48:339–49.
- Svedberg, U., J. Samuelsson, and S. Melin. 2008. Hazardous off-gassing of carbon monoxide and oxygen depletion during ocean transportation of wood pellets. Ann. Occup. Hyg. 52:259–66.
- U.S. Energy Information Administration. 2016. Densified biomass fuel report. December 14. https://www.eia.gov/todayinenergy/detail.php?id=29152 (accessed February 22, 2017).
- Wallace, L.A., S.J. Emmerich, and C. Howard-Reed. 2002. Continuous measurements of air change rates in an occupied house for 1 year: The effect of temperature, wind, fans, and windows. J. Expos. Anal. Environ. Epidemiol. 12:296–306.
- Yazdanpanah, F., S. Sokhansanj, C. J. Lim, A.Lau, X. Bi, and S. Melin. 2014a. Stratification of off-gases in stored wood pellets. Biomass Bioenergy 71:1–11.
- Yazdanpanah, F., S. Sokhansanj, H. Rezaei, J.C. Lim, A. Lau, X. Bi, S. Melin. J. Tumuluru, and C. Kim. 2014b. Measurement of off-gases in wood pellet storage. In Advances in gas chromatography, 1–32. Guo. InTech.