
 ?Mathematical formulae have been encoded as MathML and are displayed in this HTML version using MathJax in order to improve their display. Uncheck the box to turn MathJax off. This feature requires Javascript. Click on a formula to zoom.
ABSTRACT
Novel aerial methane (CH4) detection technologies were used in this study to identify anomalously high-emitting oil and gas (O&G) facilities and to guide ground-based “leak detection and repair” (LDAR) teams. This approach has the potential to enable a rapid and effective inspection of O&G facilities under voluntary or regulatory LDAR programs to identify and mitigate anomalously large CH4 emissions from a disproportionately small number of facilities. This is the first study of which the authors are aware to deploy, evaluate, and compare the CH4 detection volumes and cost-effectiveness of aerially guided and purely ground-based LDAR techniques. Two aerial methods, the Kairos Aerospace infrared CH4 column imaging and the Scientific Aviation in situ aircraft CH4 mole fraction measurements, were tested during a 2-week period in the Fayetteville Shale region contemporaneously with conventional ground-based LDAR. We show that aerially guided LDAR can be at least as cost-effective as ground-based LDAR, but several variable parameters were identified that strongly affect cost-effectiveness and which require field research and improvements beyond this pilot study. These parameters include (i) CH4 minimum dectectable limit of aerial technologies, (ii) emission rate size distributions of sources, (iii) remote distinction of fixable versus nonfixable CH4 sources (“leaks” vs. CH4 emissions occurring by design), and (iv) the fraction of fixable sources to total CH4 emissions. Suggestions for future study design are provided.
Implications: Mitigation of methane leaks from existing oil and gas operations currently relies on on-site inspections of all applicable facilities at a prescribed frequency. This approach is labor- and cost-intensive, especially because a majority of oil and gas–related methane emissions originate from a disproportionately small number of facilities and components. We show for the first time in real-world conditions how aerial methane measurements can identify anomalously high-emitting facilities to enable a rapid, focused, and directed ground inspection of these facilities. The aerially guided approach can be more cost-effective than current practices, especially when implementing the aircraft deployment improvements discussed here.
Introduction
Natural gas (NG) production in the United States has increased by 46% over the last decade (Energy Information Administration [EIA] Citation2017a), and the Energy Information Agency (EIA Citation2017b) projects that the United States will become a net exporter of NG in 2017. According to the EIA, NG has also played a significant role along with renewable energy sources in reducing power sector carbon dioxide (CO2) emissions by displacing more carbon-intensive fossil fuels (EIA Citation2017b). However, leakage of NG—and its primary component methane (CH4)—from the wellhead to the burner tip may erode the climatic and other environmental benefits of NG. In the recent past, the United States has targeted (U.S. Environmental Protection Agency [EPA] Citation2016a) reductions in fugitive CH4 emissions throughout the NG supply chain as a way to cut national greenhouse gas emissions. Although fugitive CH4 emissions from NG are a global phenomenon (Saunois et al. Citation2016; Schwietzke et al. Citation2016), most of the published measurement studies specific to the NG industry took place in the United States. Nevertheless, country-specific analyses and measurements in other world regions have highlighted the need for a better understanding of NG-related CH4 emissions outside the United States (Anifowose and Odubela Citation2015; Papailias and Mavroidis Citation2018), and some more detailed measurement results have been published recently (Johnson et al. Citation2017; Yacovitch et al. Citation2018).
Natural gas “leak detection and repair” (LDAR) programs—either through regulation (EPA Citation2016b) or voluntarily (George Citation2018)—aim at identifying and reducing CH4 and other fugitive hydrocarbon emissions from equipment leaks at oil and gas (O&G) facilities. These LDAR programs are primarily ground based, i.e., the operator conducts LDAR activities at a subset of facilities at a set frequency (ranging from monthly to annually) employing specific instruments such as optical gas imaging (OGI) cameras.
Current federal LDAR regulations rely on on-site inspections of all applicable facilities at a prescribed frequency. A potentially improved approach is to draw on the strengths of aerial CH4 measurements (i.e., high spatial coverage in a relatively short period allowing the amortization of operating costs over many facilities) to guide ground-based LDAR teams (i.e., optimize inspection and repair of facilities identified as potentially CH4 high-emitting facilities by aerial measurements) instead of conducting periodic on-site inspections at all applicable facilities in random order. The goal is to enable a rapid, focused, and directed ground inspection of predetermined anomalously high-emitting facilities that contribute to substantial amounts of the total area CH4 emissions. This is important because several studies, e.g., Allen et al. Citation2015; Brandt, Heath, and Cooley Citation2016; Lamb et al. Citation2015; Mitchell et al. Citation2015, have shown that total O&G CH4 emissions originate from a disproportionately small number of facilities and components, e.g., 5% of leaks typically contribute over 50% of the total emissions (Brandt, Heath, and Cooley Citation2016). Therefore, periodic inspection of all applicable facilities as required by EPA’s current regulation may be a less effective approach for detection and mitigation of emissions than focusing on just high emitters.
Capabilities to aerially detect CH4 emission plumes from individual O&G facilities have previously been demonstrated using in situ (Conley et al. Citation2017) and remote sensing (Frankenberg et al. Citation2016; Thorpe et al. Citation2017) instruments. However, the performance of aerially guided LDAR has so far been assessed only in computer simulations. Kemp, Ravikumar, and Brandt (Citation2016) simulated CH4 leaks in a virtual NG production basin as well as their detection by automated infrared drones and three different ground-based LDAR technologies. They estimate a positive net present value (i.e., the value of saved NG exceeds program cost) for the automated infrared drones of about $8000/well, which is about one third greater than that of the highest ranked ground-based LDAR technology.
We analyze empirical data comparing aerial and ground-based LDAR approaches in terms of CH4 emission mitigation potential and program cost-effectiveness. To the best of our knowledge, this study is the first to deploy and evaluate two existing distinct aerial CH4 detection techniques to perform field measurements in a NG basin under normal operating conditions. The aerial techniques include Kairos Aerospace (“Kairos”) infrared CH4 emission plume imaging during overflights and Scientific Aviation (SA) in situ aircraft CH4 mole fraction measurements near individual facilities (Conley et al. Citation2017). Throughout a 2-week period in parts of the Fayetteville Shale region, ground-based LDAR teams and both aerial teams conducted contemporaneous observations. Ground-based teams employed current regulatory protocols to conduct LDAR at random facilities independent of the aircraft and quantified CH4 emissions from observed leaks at these facilities as detailed below. In addition, a separate ground-based team was exclusively dedicated to verifying the aerial observations for some of the sites (see Materials and Methods and Results). This study also provides insights into the real-world implementation challenges and requirements to coordinate aerial and ground-based LDAR platforms as a means to improve existing ground-based LDAR.
Materials and methods
Study area
The Fayetteville Shale in northern central Arkansas () was chosen as the study area for two reasons: First, two NG operators alone (Southwestern Energy Company, “SWN”; and XTO Energy Inc., “XTO”) account for 76% of all active well pads (Arkansas Oil and Gas Commission Citation2016). The participation of SWN and XTO in this study enabled deployment of ground LDAR teams with on-site access at most NG facilities in the study area, thereby maximizing facility sample size while minimizing coordination efforts with operators. Second, both NG operators had participated in a previous study (Schwietzke et al. Citation2017) with part of this science team in the same study area, which simplified study design development, study logistics, and coordination between NG operators, ground teams, and aerial teams.
Figure 1. Fayetteville Shale study area location and sampling boxes. Two of the nine transmission stations are situated immediately outside of the plotted area and are thus not shown. No transmission station is located in any of the sampling boxes.
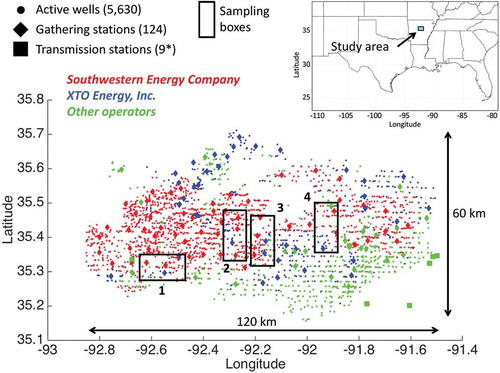
The NG infrastructure in the Fayetteville Shale area includes NG-producing well pads, gathering and boosting (G&B) compressor stations, transmission compressor stations, and gathering and transmission lines. The Fayetteville Shale is a dry gas region, i.e., no oil or hydrocarbon liquids are produced and no centralized gas processing facilities exist. Gas production–normalized CH4 emission rates tend to be lower in dry versus wet gas regions (supplemental information [SI] Section 1), potentially due to the lack of some infrastructure with otherwise substantial CH4 emissions, such as hydrocarbon liquid storage tanks (Lyon et al. Citation2016). The LDAR effectiveness demonstrated in this study is therefore specific to the Fayetteville Shale and may differ in wet gas areas due to additional potential CH4 sources such as liquid hydrocarbon storage tanks. Four subregions (“sampling boxes” of 50 square miles or 128 km2 each; ) were selected with the goal to sample representative facilities throughout the region (SI Section 1).
Measurement platforms and sampling approaches
Ground LDAR platforms
The ground teams used OGI cameras (FLIR GF320 [Nashua, NH, USA] and OpGal EyeCGas [Karmiel, Israel]) for on-site NG leak detection. An entire facility was scanned by a team member using the handheld camera based on a protocol similar to EPA’s New Source Performance Standards OOOOa guidelines (EPA Citation2016c). Meteorological conditions on all days were consistent with these guidelines. In this approach, the maximum viewing distance (ranging between 4.8 and 19.8 m in this study) was determined with a small controlled release from a gas cylinder or gas release point at the well pad at the start of each measurement day, and then all equipment was viewed from that distance or closer. The gas contained 100% CH4 and was released at a rate ranging between 17 and 200 g/hr (0.5–6 L/min). Trained, experienced camera operators conducted the ground LDAR. The camera operator traversed the operating facility, i.e., passing all accessible equipment sides, searching for emissions. Some elevated vent stacks had to be viewed from ground level pointing up, but most equipment, including produced water tank tops and vents, could be viewed from 1–2 m distance or closer. Any observed emission plumes were noted and logged. SI Section 2 describes the emission quantification procedure using the Bacharach Hi-Flow sampler. The developer of the Hi-Flow sampler raised concerned that this instrument may underestimate emission rates under several specific conditions: “(1) Calibration is more than ~2 weeks old; (2) firmware is out of date; or (3) the composition of the NG source is less than ~91% CH4” (Howard, Ferrara, and Townsend-Small Citation2015). Note, however, that the Hi-Flow samplers were calibrated daily in this study, and that the average CH4 content in the Fayetteville Shale is 96.5 mol-% (91.6 wt-%) (Schwietzke et al. Citation2017). Also, the EPA recently concluded that there are no “data that indicate the Hi Flow Sampler malfunctions in high methane content gas streams” (EPA Office of Inspector General Citation2018). Underestimation of emission rates with the Hi-Flow sampler in this study is therefore unlikely.
Similar to regulatory or voluntary LDAR, ground teams were not charged with identifying or quantifying CH4 emissions from compressor stacks (mostly at G&B stations), whereas aerially platforms usually detect CH4 emission plumes from this specific source category.
Kairos LeakSurveyor leak detection platform
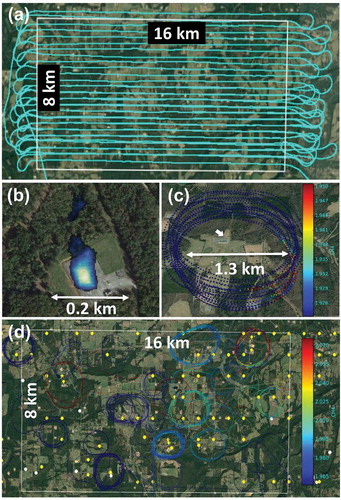
The Kairos LeakSurveyor is a two-channel instrument, which was installed in a light aircraft. The following technology short description is accompanied by additional details in SI Section 2. The first measurement channel is an infrared imaging spectrometer to detect “excess” CH4 (above background) in the air below the aircraft. The second channel is an optical red/green/blue (RGB) imager to create an optical surface map of the surveyed region. An embedded global positioning system provides the geolocation of the spectra and images. A region is surveyed using a raster flight pattern ( and SI Figure 1) where each pass covers a distance of ~400 m on each side of the plane given a surveying altitude of ~900 m above ground level (AGL). A single sampling box was surveyed more than once on the same day depending on time availability. The collected data from each survey were processed after landing to determine potential CH4 plume detects. The analysis involves automated signal processing and human review of potential CH4 plume detections for further refinement. Kairos’ signal processing algorithms measure the absorption level at specific wavelengths relative to the absorption from atmospheric CH4 background to indicate the significance of the detection for each pixel of approximately 4.5 m × 4.5 m area. The CH4 absorption lines are measured in regions where there is no interference from absorption lines for other common hydrocarbons, such as ethane or propane. A matched filter approach is used to detect changes across all of the selected absorption lines. The goal is to match the pattern expected from CH4 rather than better matching the pattern that would be expected from other gases that have some overlapping absorption lines in that portion of the spectrum. Environmental factors affecting LeakSurveyor’s sensitivity to CH4 plume detection include wind speeds (high winds lead to more dilution of emission signals) and illumination levels (e.g., clouds reduce illumination and surrounding water reduces reflectivity). These limitations (clouds in particular) were present during the study period and are described in more detail in SI Section 2. Note, however, that the plume detection statistics presented in this study—and which affect cost-effectiveness—account for these limitations.
Figure 2. (a and b) Examples of Kairos flight patterns to illustrate both aerial leak detection methods. (c and d) Examples of Scientific Aviation flight patterns to illustrate both aerial leak detection methods. The white rectangles in panels (a) and (d) define sampling box 1. The yellow and white symbols in panel (d) indicate SWN/XTO and non-study partner O&G facilities, respectively. The SA flight patterns are color-coded by in situ measured CH4 mole fraction (in ppm). Panel (b) shows a Kairos CH4 plume detection image directly above an O&G facility. Panel (c) illustrates SA’s emission quantification method for an O&G facility where the white arrow indicates the wind direction directly above the facility, and relatively clean air upwind and enhanced CH4 mole fractions downwind of the facility, respectively. Note the scale differences between panels (b) and (c) for improved visibility of image details.
As described in detail in SI Section 2, the resulting CH4 plume detection maps () are an exclusively quantitative product of automated signal processing. However, in postprocessing, Kairos analysts review these maps for factors that would increase or decrease the confidence that CH4 emissions originate from the facility rather than a false-positive reading caused by noise or instrument bias. These factors include plume shape, proximity to an identifiable CH4 source, illumination level, and alignment with known causes of false readings (such as lakes or rivers). These factors are accounted for in determining a “facility confidence level” (“firm,” “likely,” or “suspicious”) for each detected facility. The reported facility plume confidence levels thus encompass some degree of subjectivity due to the human judgment involved and due to the determination of a semiqualitative metric (despite using quantitative and automated computation of the area-weighted confidence metric maps as a basis). In this study, however, the Kairos’ CH4 detections and LDAR cost-effectiveness were determined objectively by two external factors. First, our base case analysis (see below) only accounts for detected leaks when the ground LDAR teams confirmed an aerial detect. Thus, a Kairos “detect” with no ground LDAR confirmation is considered a false positive in our base case. This assumption of a false positive in the base case is intentionally conservative (i.e., potentially underestimating Kairos’ CH4 detections). An alternative scenario is described in Results, which explores the possibility of “missed” CH4 sources by ground teams (e.g., due to short-duration episodic emission sources). Second, controlled CH4 release experiments (SI Section 4) were carried out to objectively evaluate the effectiveness of the Kairos platform (as well as SA; see Materials and Methods). Note that Kairos did not quantify CH4 emission rates in this study. Although CH4 volumes within a plume could be estimated with an airborne infrared imaging spectrometer, their conversion to CH4 emission rates would also require simultaneous near-ground wind speed measurements at each facility, which were not available in this study. Instead, we estimated lower bound and central estimate emission rates for each detected facility by Kairos using the controlled release tests and same-day quantified emission rates by SA for the same facilities (SI Section 4). Kairos’ CH4 detections (detected plume vs. no plume) are, however, completely independent of the SA approach.
Scientific Aviation in situ leak detection and emission quantification platform
The SA leak detection approach involves in situ measurements of CH4 dry air mole fractions (and optionally other gases) sampled downwind of potential emission sources. In this study, a Picarro 2301f cavity ring down spectrometer (Crosson Citation2008) was used in the SA aircraft. Detection of excess CH4 occurs in real time, e.g., while passing an O&G facility at ~150 m AGL. Specific emission locations are verified through a circular flight path around the detected facility to rule out potential upwind plumes passing over this facility (). Although being an optional capability, emissions from a facility were quantified based on Conley et al. (Citation2017), which is briefly summarized below (and expanded in SI Section 2). In situ atmospheric CH4 mole fraction measurements (1.4 ppb measurement uncertainty; Karion et al. Citation2015) are performed along a closed cylindrical flight path (approximately 0.5–1.0 km diameter) at multiple altitude levels (usually 60–600 m AGL) around an emission source (). The lowest and highest altitude levels are generally determined by topography, emission strength, and atmospheric conditions, respectively. The lowest altitude level of 60 m AGL is important for accounting for potential nearby upwind CH4 sources and for enabling downwind CH4 measurements as close to the surface as possible. Boundary layer vertical atmospheric mixing (usually occurring during the day when skies are not overcast) and horizontally consistent winds within the flight circle are needed to satisfy the quantification method’s assumption of constant net emissions and winds within the circle. As described in SI Section 2, the aircraft propeller and engine exhaust have negligable impacts on emission plume mixing and contamination, respectively.
Coordinated air sampling and comparative analysis of LDAR cost-effectiveness
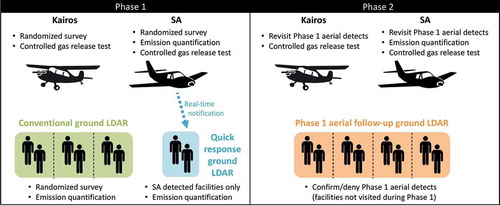
The main objective of all air sampling techniques deployed in the same area for the same amount of time was to locate high emitters and determine their cumulative CH4 emission rates. Aerial and ground-based surveys were divided into Phase 1 (April 3–8, 2017) and Phase 2 (April 19, 2017), as shown in . During Phase 1, aerial and ground-based air sampling were coordinated spatiotemporally as described below to maximize the probability that each sampling platform measured the same emission sources on the same day, thereby allowing a fair comparison of each platform. However, since each sampling platform is unique in terms of survey pattern and speed, simultaneous sampling at each facility was not possible. The Phase 1 surveys targeted as many facilities per box as possible for each platform and were used to determine LDAR cost-effectiveness. In Phase 2, facilities detected during Phase 1 (by ground and aerial teams) were revisited by ground and aerial teams to check for persistent leaks and to increase aerial detection sample size for evaluation of the Kairos platform using SA measurements at the same facilities. Ground teams did not quantify emission rates during Phase 2.
Figure 3. Study objectives of all ground and aerial teams during both study phases. Study design included surveying the same sampling boxes on the same day. During Phase 2, revisiting Phase 1 aerial detects by all teams also increased the sample size of identical facilities surveyed by both aerial and ground teams. A separate ground team (not shown) operated the metered (controlled) release of produced gas from a well pad.
Air sampling for aerial and ground-based LDAR
Kairos and SA aircraft performed surveys of all SWN and XTO well pads and G&B stations in one 50 square mile (128 km2) sampling box per day. Both aircraft sampled the same box on the same day (between 9:30 a.m. and 4:00 p.m. local time) except on two days when one of the aircraft remained on the ground (Kairos did not fly on April 8, 2017, because data collection was completed for all boxes; SA did not fly on April 5, 2017, because of poor atmospheric conditions; see SI Section 4). The aerial survey order of facilities in each box was randomized by applying a raster pattern (Kairos) and selecting the order of circled facilities based on the shortest total transit time between facilities (SA).
Four ground teams were deployed simultaneously with the aerial teams in the same sampling boxes each day during Phase 1. Three of these ground teams performed conventional LDAR at randomly selected facilities (i.e., independent of any aerial team detects) and quantified emissions when the ground survey indicated a leak (and when it was safe to do so). Although leak quantification is not always part of conventional LDAR activities, it was included here to determine the basis of LDAR cost-effectiveness.
Given that SA’s platform indicated near-real-time detections, the objective of the fourth ground team during Phase 1 (SWN quick response team) was to perform LDAR and leak quantification at those SWN facilities that SA reported as a detect (via text messaging). This effort was aimed at getting as close to concurrent ground-based verification and quantification for more aerial detects than could be expected from relying on undirected inspections of the first three ground teams alone. The SWN quick response team transited to a reported SWN facility as soon as practical.
Controlled CH4 release tests
Controlled releases of produced NG (i.e., multiple known CH4 emission rates) were performed on two days (April 4 and 19, 2017; SI Section 4) at a single location to determine the approximate CH4 “minimum detectable limit” (MDL) for the Kairos platform for the particular topography and atmospheric conditions being tested. Since the Kairos platform did not quantify emission rates, the controlled release experiment was also used to assign emission rates to each of Kairos’ detected facilities (SI Section 2). Here, we use the term MDL to refer to the lowest expected emission rate for any detect. MDL thus defines the lowest magnitude of emission sources that can be detected, whereas the reliability of detection determines how consistently emission sources larger or equal to the CH4 MDL will be detected (SI Section 4). This difference is important because MDL is used in this study for converting Kairos’ CH4 detects (binary) into detected CH4 emission rates (as inputs for the cost-effectiveness calculation; SI Sections 2 and 4). Using MDL (as opposed to “detection threshold”) ensures that Kairos’ lower bound detected CH4 emission rates are not overestimated.
SA also participated in a portion of the controlled release experiment to compare results with previous controlled gas release experiments (Conley et al. Citation2017), particularly in terms of accuracy and uncertainty of the estimated emission rates.
Analysis of air sampling data
This analysis distinguishes between fixable (or repairable) and nonfixable emission sources. Fixable emissions are defined as unintended emissions due to wear and tear on sealed surfaces such as emissions from gaskets, screwed connectors, valve packings, pressure relief valve seats, as well as open-ended lines associated with pipelines, pressurized vessels, and compressors. Fixable emissions may also include malfunctioning NG-powered pneumatic controllers, leaking storage tank gauge hatches, and leaking pressure relief valves. Although these pneumatic and tank sources are not always considered fugitive equipment leaks, these are often included in voluntary LDAR programs. Internal combustion engine (ICE) exhaust CH4 slip from compressor stations is a vented emission source (by design) that is not generally considered fixable and which exists at each operating compressor station. Also, “planned or known” episodic emission events such as liquids unloadings are not generally considered fixable emission sources.
In a routine LDAR program for voluntary or regulatory purposes, aerially detecting the nonfixable emissions would not lead to leak repair and associated emission reductions. Our base case LDAR cost-effectiveness thus only considers fixable emissions. As described in detail below, the fixable fractions of aerially detected emissions were determined based on leak rate size distributions from the ground team measurements.
Determination of LDAR deployment cost and cost-effectiveness
The LDAR cost-effectiveness of each platform was determined based on the cumulative detected CH4 emission rates and deployment cost as follows. Total Phase 1 costs, CGround and CAerial, for ground and aerial teams, respectively, were calculated using eqs 1 and 2:
where FGround represents the deployment costs for the ground teams. FGround accounts for the deployed conventional ground LDAR teams consisting of one person per team for OGI-based leak detection and one person each for leak quantification using the Hi-Flow instrument. Each team was deployed for 4 days for 9 hr per day (i.e., the time each team spent during Phase 1 performing leak detection, quantification, and transit between facilities) at an hourly rate of US$142.06/hr based on ICF analysis (ICF International Citation2016), which accounts for labor and capital costs such as OGI cameras. Three conventional ground LDAR teams were deployed in this study, but this count only influences the number of facilities visited, not the cost-effectiveness. That is, additional teams would be able to visit more facilities, but also detect more leaks, thus equally adding to both the numerator and the denominator in the cost-effectiveness calculation.
One hour of leak repair time, tR, at the same hourly rate HGround (US$142.06/hr) is added for each facility where a leak needed to be repaired, NR, that would normally be spent in a real-world LDAR program. Note that the 1 hr repair time used here is similar to the average repair time in the EPA OOOOa LDAR cost calculations of 1.13 hr per facility for both well sites and compressor stations (EPA Citation2016b).
Aerial LDAR costs include the aerial team costs (provided by SA and Kairos) and the ground LDAR leak confirmation costs for those facilities that were aerially detected and then visited by ground teams. FAerial is the total cost that the aerial teams charged to the project for the four flight days during Phase 1 ($60,000 for Kairos and $40,000 for SA). These costs account for downtime of aerial crews, e.g., during unsuitable weather conditions. The costs reflect that both aerial teams carried out their field measurements (including the supply and calibration of measurement instruments) without the help from the National Oceanic and Atmospheric Administration (NOAA) or other project-funded entities (and without the associated costs). The ground team hourly rate was applied to each detected facility where a ground team confirmed an aerially detected facility, NCF, and, when a leak is confirmed, also for repair, NR. The ground team follow-up time needed for leak confirmation, tCF, was assumed to be 1.92 hr per facility (including an average 40 min trip to each facility, 15 min OGI camera leak verification, 30 min general facility survey, and 30 min leak documentation). The ground team follow-up time needed for leak repair, tR, was assumed to be 1 hr per facility (same as for conventional ground LDAR). The durations for leak confirmation and repair used here are specific to this study and can be different elsewhere. For example, longer (or shorter) trip times between facilities (depending on well density in a given basin) would increase (or decrease) leak confirmation time. In terms of cost comparison among LDAR platforms (objective of this particular study), changes in modeled (or empirically derived) repair time would apply to all platforms. The contribution of leak confirmation and repair costs to total costs is summarized in SI Table 4.
For aerial and ground teams, cost-effectiveness, CE, (in US$ spent per million standard cubic feet [Mscf] CH4 emissions avoided) was calculated according to eq 3:
where C is the total aerial or ground-based LDAR cost from eqs 1 and 2, Σ ERFixable is the sum of the emission rates (in Mscf CH4/hr) of each detected leak that was considered fixable/avoidable, and tLeak is the amount of time (2190 hr, i.e., a quarter year, assuming semiannual inspections) that each leak would continue to emit CH4 without the LDAR program (i.e., avoided emissions).
Results
The estimated cumulative CH4 emission rate and cost-effectiveness of aerially guided LDAR depends on the CH4 MDL, the reliability of detection of each aerial platform, the quantification accuracy, and the validity of assuming constant emission rates. Although the CH4 MDL defines the lowest magnitude of emission sources that can be detected, the reliability of detection determines how consistently emission sources larger or equal to the CH4 MDL will be detected.
SA’s approach has been described recently (Conley et al. Citation2017), including its MDL of 5 kg CH4/hr (0.26 Mscf CH4/hr) and its CH4 emission rate quantification accuracy ranging from 1% to 24% during different controlled gas release field experiments. In terms of reliability, all of SA’s documented controlled gas release tests in this study (SI Section 4) and previous experiments (Conley et al. Citation2017) have been detected by SA. It should be noted, however, that the presence of upwind CH4 sources with emissions larger than the targeted source can prevent a reliable emission quantification of the target. As described in Materials and Methods and in SI Section 2, topography, emission strength, and atmospheric conditions determine the lowest and highest sampling altitudes (and thus indirectly also the number of laps per facility). In this study, the average minimum altitude (to account for potential nearby upwind CH4 sources and to extrapolate as close to the surface as possible) was 87 m AGL. The average number of laps per facility in this study was 14, i.e., close to the 15 laps that were previously determined to provide a stable emission rate estimate based on a “large eddy simulation” study (Conley et al. Citation2017).
The CH4 MDL and detection reliability of the Kairos approach, which has not yet been evaluated in the peer-reviewed literature, was assessed in this study using two approaches. The experimental procedures and detailed results are described in SI Section 4 and are briefly summarized here. First, controlled NG release experiments were carried out to directly determine the CH4 MDL. Second, SA’s and Kairos’ CH4 detections during the aerially guided LDAR experiment were compared in the same sampling boxes on the same days. Based on six controlled NG releases ranging between 9 and 92 kg CH4/hr (0.5–4.8 Mscf CH4/hr), we determined Kairos’ MDL to be 46 kg CH4/hr (2.4 Mscf CH4/hr). As described in “Quantified CH4 emission rates” below, Kairos’ MDL is too high to detect CH4 emissions from the majority of facilities. But it may nevertheless detect a substantial fraction of cumulative CH4 emissions given the existence of high-emitting facilities, which is the rationale of aerially guided LDAR.
Considering controlled NG releases and the comparison of Kairos’ CH4 detection of O&G facilities with SA shows that Kairos was able to detect emissions above its CH4 MDL during 12–29% of all passes in this study. Note that these test results are specific to the illumination and atmospheric conditions encountered during this field study. When considering only the “usable” passes (i.e., excluding insufficient illumination and atmospheric conditions), Kairos is able to detect emissions above its CH4 MDL during 15–67% of the time.
For comparison, a Jet Propulsion Laboratory (JPL; National Aeronautics and Space Administration) research instrument, the infrared imaging spectrometer AVIRIS-NG, which has previously been deployed (Frankenberg et al. Citation2016; Thorpe et al. Citation2017) to detect CH4 plumes from operating U.S. O&G facilities, participated in a 7-day controlled NG release experiment in 2013 (Thorpe et al. Citation2016). Based on a total of 143 gas releases, the AVIRIS-NG instrument detected 2.3 kg CH4/hr (0.12 Mscf CH4/hr) 30% of the time, 5 kg CH4/hr (0.26 Mscf CH4/hr) 73% of the time, and ≥22 kg CH4/hr (1.2 Mscf CH4/hr) 100% of the time. Note, however, that any MDL comparison with other instruments in previous studies is subject to limitations. First, the demonstrated MDLs in this study and in Thorpe et al. (Citation2016) are subject to the respective weather conditions. For infrared imaging spectrometers, this largely refers to lighting levels (signal-to-noise ratio deteriorates with lower illumination) and wind speeds near the ground (measured path concentration of methane is proportional to emission rate divided by wind speed). Second, the relatively small and inexpensive instruments used in this study can be mounted on light aircraft (and scaled up in numbers) for commercial deployment, whereas AVIRIS-NG is a scientific instrument designed for research studies rather than commercial deployment.
Detected facilities during Phase 1
A summary of the number of sampled facilities and aerial and ground-based emission detects is shown in . A total of 257 NG facilities operated by SWN or XTO were located in sampling boxes 1–4, of which 49 facilities (19%) had leaks observed by the ground teams during Phase 1 compared with 24 detected facilities by SA (9%) and 7 facilities by Kairos (3%). The 49 ground-based detected facilities include 25 out of the combined 31 aerially detected facilities, thus providing a direct comparison of ground-based and aerial detects at 81% of the aerially detected facilities. Nevertheless, only 7 out of these 25 facilities provide leak detection comparisons from the same day. This temporal difference between aerial and ground-based emission detects is due to three of the four ground teams conducting conventional LDAR independent of the aerial teams, and Kairos detects being reported only after the end of Phase 1 (see above). Thus, whenever ground-based LDAR results differed substantially from aerial detects (emission magnitude by SA or detect vs. no detect by Kairos), the possibility of episodic emissions and leaks had to be taken into account as described in the following section. Other potential explanations such as aerial false positives and plumes missed by ground teams are also described in the following section (see “Fixable emission scenarios”). Note that ground teams were not charged with identifying or quantifying CH4 emissions from compressor engine exhaust stacks (mostly at G&B stations), whereas aerial detects may include signals from this source. However, ground measurements included compressor seals and most of the time also engine crankcases. The latter is a negligible CH4 emissions contributor, as it represents the same unburned CH4 as in the exhaust stack, but at much lower flow volume. Considering the five days when Kairos and SA sampled the same boxes on the same day (including Phase 2), Kairos and SA detected CH4 plumes at 13 and 21 facilities, respectively. Three of these included identical facilities (see SI Table 3). Only one of these three facilities were visited by ground teams, which found six leaks (but this occurred during Phase 2 where no ground quantification took place).
Table 1. Summary of sampled facilities and aerial and ground-based emission detects during Phase 1. See also SI for a definition of the different types of ground verifications and (no) ground verifications.
Quantified CH4 emission rates
Total detected CH4 emissions
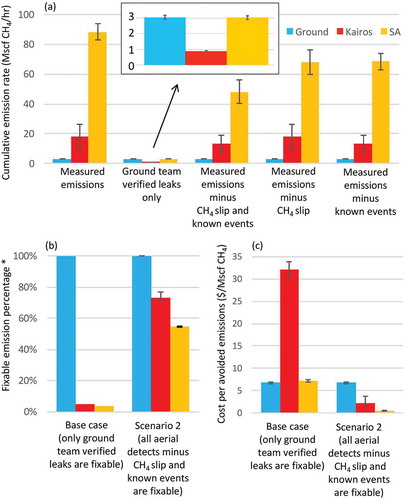
The Phase 1 “measured emissions” () represent the cumulative CH4 emission rates quantified by each platform during Phase 1 irrespective of whether these emissions were fixable or not. All error bars in represent 1σ uncertainties derived by summing the facility-level quantification uncertainties (see Materials and Methods, “Measurement platforms and sampling approaches”) in quadrature. Kairos did not quantify emissions, and the Kairos emission rates were estimated as lower bound and central estimates. As described in more detail in SI Section 2, this was achieved through a combination of (i) applying SA’s quantified emission rates at facilities that were detected by both SA and Kairos and (ii) assigning results from the controlled NG release experiment (CH4 MDL and reliability of detection) according to Kairos’ reported facility confidence level for each detect. Central estimates rather than upper bounds were calculated because a “firm” detect can be associated with the demonstrated CH4 MDL, but it does not rule out a substantially higher emission rate. Note that a “firm” detect signifies the highest probability category that a detect is not a false positive (see Materials and Methods, “Measurement platforms and sampling approaches”). The “firm” label is only applied if a plume is detected. The “firm” label is not used to predict CH4 plume detection.
Figure 4. (a) Cumulative (all facilities) detected CH4 emission rates as measured (leftmost cluster) and including only specific CH4 sources, i.e., those leaks identified as fixable based on routine ground LDAR (remaining clusters for all five scenarios) during Phase 1. The inset magnifies “Ground team verified leaks only.” Note that the ground team sample size (number of surveyed wells) is a factor of 2.4 smaller than the aerial teams (factor 1.6 smaller for G&B stations). (b) Two scenarios of fixable emission rates as a percentage of measured emission rates for each platform. (c) Cost-effectiveness comparison for both fixable emission rate scenarios. All error bars represent 1σ uncertainties derived by summing the facility-level quantification uncertainties (see Materials and Methods) in quadrature. The emission difference between scenario 2 and the base case is due to potential undetected/unmeasured fixable leaks by ground teams, potential aerial false-positive detects, or the presence of episodic emissions (preventing their detection by ground surveys due to differences in the timing between the aerial and ground-based surveys).
The wind conditions during the controlled NG release experiment on April 19, 2017, were comparable with those during Phase 1 (April 3–8, 2017). Surface wind speeds (which are most relevant for the Kairos approach) were compared at nearby airports (Russelville Municipal, Searcy Municipal, and Cantrell Field), which are located within <50 km of the study area. The average surface wind speeds were 4.9 m/sec during the controlled NG release experiment and 5.1 m/sec during the 9:30 a.m. to 4:30 p.m. (local time) flight windows on April 3–8, 2017. Wind speeds therefore do not introduce a substantial bias when using results from the controlled NG release experiment to determine Kairos’ detected CH4 emission rates during Phase 1.
The aerial teams detected substantially more total CH4 emissions than the ground teams (factor of 3–26) despite a factor of 2 fewer detected facilities (). As described in detail in SI , the difference between total aerially detected CH4 emissions and those detected by the ground teams (see definition of fixable leaks above) is likely due to a combination of factors:
Aerial detects include nonfixable emissions from G&B compressor exhaust CH4 slip and known routine events such as liquids unloadings that were not measured by the ground teams. Also, akin to regulatory and voluntary LDAR programs, ground teams were not always able to quantify all emissions on-site because of safety concerns or due to difficulties in equipment access (e.g., lack of manlifts at each facility) at 10% of sites surveyed even though aerial teams may have detected these emission sources. Only 1 out of 111 surveyed facilities by ground teams included a reported CH4 source that was not quantified due to safety concerns. The ground team reported open thief hatches on a water tank, but SA and Kairos did not detect a plume from this facility later the same day.
Differences in the timing between the aerial and ground-based surveys at specific facilities may have prevented ground verification of aerial detects in the presence of potential episodic emission sources. The temporal delay is partly because Kairos reported detects only after Phase 1; thus, not all Kairos detects were verified by ground teams, which did not survey all facilities due to limited personnel. Similarly, the single SWN quick response team was unable to follow up on all SA detects.
Potential false-positive aerial detects may have occurred.
Ground surveys using OGI scans may have failed to identify existing fixable leaks. Given the OGI’s 3 orders of magnitude higher sensitivity of leak detection compared with the aerial platforms in this study (SI Sections 2 and 4), it is unlikely that an OGI camera would miss a major CH4 plume when the OGI camera is directed at such a plume.
The “Ground team verified leaks only” cluster in considers only those emission sources that were indeed detected (and would then be fixed) by ground teams. The 3.0 Mscf CH4/hr (58 kg CH4/hr) cumulative emission rate by the ground teams in excludes 0.3 Mscf CH4/hr (5.8 kg CH4/hr) detected by the SWN quick response team because these leaks were not detected using conventional LDAR. See “Fixable emission scenarios” below for a description of the aerially detected leaks that were verified by ground teams.
The “Measured emissions minus CH4 slip and known events” cluster in excludes estimated CH4 emissions from G&B compressor exhaust CH4 slip and known events from the “Measured emissions” cluster. CH4 slip estimates are based on a recent study (Vaughn et al. Citation2017) in the same study area (Fayetteville Shale), which were calculated based on 111 recent measurements of representative G&B compressor engines and which were consistent with fence-line ground-based measurements and aircraft measurements (SI Section 7). The CH4 emissions from known events were calculated as SA quantified emissions at facilities with known events minus the sum of ground-based quantified emissions at the same facilities (when available) and G&B compressor CH4 slip (for G&B facilities only). Although uncertainties in all three parameters were propagated in this calculation, it assumes zero aerial false positives and zero missed ground-based leak detects (note that these assumptions are relaxed in scenario 2 below).
The rightmost two clusters in show the contributions of CH4 slip and known events individually. The results indicate that almost half of the emission rate difference between SA and ground teams is due to CH4 slip and known events (about one third between Kairos and ground teams).
The remaining differences are likely attributed to the other three factors discussed above (i.e., temporal measurement delays between ground and aerial teams, potential false-positive aerial detects, and other emission sources missed or unmeasured by ground teams). The potential combination of these factors prevents a definitive quantification of the fixable emissions from the aerial detects. Here, we postulate two different fixable emission scenarios from the aerial detects (base case and scenario 2 described below) and use these to estimate a range of LDAR cost-effectiveness for each platform.
Fixable emission scenarios
Our base case assumes that the difference between aerially and ground-based cumulative detected CH4 emission rates is entirely due to a combination of aerially detected nonfixable emissions and aerial false positives. Our base case thus considers only those emission sources fixable that were indeed detected and quantified (and could thus be fixed) by ground LDAR teams (, left cluster).
Whereas the base case cumulative fixable emission rate of the ground teams is equal to all ground measured leaks by definition, the base case cumulative fixable emission rate of the aerial teams can only be estimated because (i) not all aerially detected facilities were visited by ground LDAR teams and (ii) only some facilities were detected on the same day by both ground teams and aerial teams.
In this analysis, the cumulative fixable emission rate of the aerial platforms is a subset of the 3.0 Mscf CH4/hr from the ground teams because the aerial teams detected fewer facilities (6 for Kairos and 22 for SA excluding known events) than the ground teams (49; ). Since the aerial platforms cannot detect the smallest leaks due to the relatively high CH4 MDLs (emission rate size distributions are discussed below), we assume that the aerial teams have detected only the largest fixable leaks that were indeed detected by the ground teams.
For example, SA detected 10 well pads (12 minus 2 well pads with a known event; ). The 10 largest-emitting well pad leaks (based on ground team measurements) account for 79% of the cumulative emissions from all 40 quantified well pads because of the highly skewed emission distribution (), similar to previous studies (Brandt, Heath, and Cooley Citation2016; Zavala-Araiza et al. Citation2017). Considering both well pads and G&B stations, SA’s and Kairos’ estimated fixable emissions are equal to 99.6% and 29.2% of all conventional ground LDAR team fixable emissions (3.0 Mscf CH4/hr), respectively.
Figure 5. Comparison of emission rate distributions from fixable and nonfixable sources in this study (triangles) with previous studies (dots; based on a data set by Brandt, Heath, and Cooley [Citation2016], which was further analyzed here) and with the aerial platform CH4 minimum detectable limits (MDL; black vertical lines) demonstrated in this study.
![Figure 5. Comparison of emission rate distributions from fixable and nonfixable sources in this study (triangles) with previous studies (dots; based on a data set by Brandt, Heath, and Cooley [Citation2016], which was further analyzed here) and with the aerial platform CH4 minimum detectable limits (MDL; black vertical lines) demonstrated in this study.](/cms/asset/74c67c0c-2849-4a5c-b686-2005c3aa68f4/uawm_a_1515123_f0005_oc.jpg)
The fixable emission scenario 2 (, right cluster) provides an upper bound of fixable emissions by accounting for potentially unquantified fixable leaks during the ground surveys due to undetected/unmeasured leaks by ground teams and the presence of episodic emissions. Subtracting the nonfixable emissions due to CH4 slip and known events from the aerial cumulative emission detects results in remaining fixable emission rates of 758–1062 kg CH4/hr (SA; 40–56 Mscf CH4/hr) and 152–360 kg CH4/hr (Kairos; 8–19 Mscf CH4/hr). These are the fixable emission rates that the ground teams were expected to detect if the ground teams had been able to measure simultaneously with the aerial teams (and considering that the known events CH4 emission rates above are representative for all measured facilities). In this scenario, the cumulative aerial fixable emission rates are a factor of 13–19 (SA) and 3–6 (Kairos) larger compared with ground surveys. Note that this upper bound scenario assumes that all aerial emission estimates are correct (no aerial false positives, which are included in the base case). Nevertheless, both scenarios account for all aerial costs, including aerial surveys and ground-team follow-up in case of an aerial detect.
Quantified CH4 emission rate distributions
Similar to previous studies (Brandt, Heath, and Cooley Citation2016; Zavala-Araiza et al. Citation2017), emission rate distributions in this study are highly skewed (), such that leaks from the highest-emitting 7% of facilities contribute 52% of cumulative fixable emissions, and the highest-emitting 13% of facilities contribute to 49% of cumulative nonfixable emissions. Kairos’ demonstrated CH4 MDL (46 kg CH4/hr or 2.4 Mscf CH4/hr) is larger than the total fixable emission rate from any single facility quantified by ground teams during Phase 1. Kairos’ identification of fixable leaks in the Fayetteville Shale thus depends on the presence of fixable leaks larger than those quantified by ground teams, or on the presence of co-located fixable and nonfixable emissions, the sum of which is above Kairos’ CH4 MDL (see triangles in ).
SA’s demonstrated CH4 MDL is sufficient to detect the four largest fixable emission sources (9% of all fixable leaks) during Phase 1 (considering the 10% ground-based quantification accuracy; SI Section 2), which account for 59% of all fixable emissions with leak rate sizes >4.5 kg CH4/hr (>0.24 Mscf CH4/hr).
Comparison with national-level CH4 emission rate distributions
Next, we compared the demonstrated aerial CH4 MDLs with CH4 emission rate distributions elsewhere in the United States based on a measurement data set compiled by Brandt, Heath, and Cooley (Citation2016). As described in SI Section 8, we categorized this data set into fixable and nonfixable emission sources from the O&G production sector only (i.e., excluding processing, transmission, distribution), and we excluded entries where the specific CH4 source and/or the O&G sector could not be identified. This process resulted in 1887 fixable and 1229 nonfixable CH4 sources, i.e., 2–3 orders of magnitude greater sample size than in this study. Note that all 3116 data points as well as the excluded data points represent physical measurements as opposed to emission factors.
We find that this study’s fixable CH4 emission rates are similar to those of Brandt, Heath, and Cooley (Citation2016), but the latter study includes multiple substantially larger (up to an order of magnitude) fixable sources, potentially due to the greater sample size (leading to the identification of more high-emitting sources). The nonfixable CH4 emission rates in the O&G production sector are over an order of magnitude larger in this study compared with Brandt et al. (Brandt, Heath, and Cooley Citation2016). This comparison is subject to two caveats. First, each CH4 emission rate in this study represents the total of a facility, whereas the Brandt, Heath, and Cooley (Citation2016) data set also includes individual components. Second, many Brandt, Heath, and Cooley (Citation2016) data entries with unknown CH4 source and/or O&G sector (N = 2460) have substantially larger CH4 emission rates than those identified as fixable and nonfixable O&G production sources. The blue symbols in show the maximum possible fixable CH4 emission rates in the Brandt, Heath, and Cooley (Citation2016) data set assuming that all unknown source/sector entries are fixable. The true fixable CH4 emission rate distribution of the Brandt, Heath, and Cooley (Citation2016) data set is thus expected in the space between the blue and light green circles.
Considering this larger Brandt, Heath, and Cooley (Citation2016) data set (and the caveats above), we find the following: SA’s CH4 MDL of 5 kg CH4/hr (0.26 Mscf CH4/hr) would be sufficient to detect O&G production sector emission sources outside the Fayetteville Shale that contribute 51–93% of fixable emissions (depending on how many of the “excluded unknown” CH4 source emissions are fixable, as shown in ). The corresponding detectability for Kairos (considering a CH4 MDL of 46 kg CH4/hr or 2.4 Mscf CH4/hr, which is specific to the illumination conditions during this study) is 10–78% of fixable emissions. These data represent wide ranges that prompt further research (see Discussion) and highlight the importance of MDL for detecting fixable emissions. Nevertheless, the results indicate the potential for aerially guided LDAR to detect a substantial fraction of total fixable CH4 emissions. Keep in mind that no single O&G basin may actually represent the average U.S. data set, i.e., emission potentials in a given basin may be lower or higher than in the distributions shown in .
LDAR cost-effectiveness
The cost-effectiveness of each LDAR approach is defined as the total cost expended in Phase 1 divided by the avoided CH4 emissions due to the detection of fixable emissions in Phase 1 (see Materials and Methods). The detailed cost breakdowns by LDAR platform, facility type, and LDAR element (detection, quantification, confirmation, and repair) are provided in SI Section 5. Emission detection/quantification costs during Phase 1 are lowest for ground-based LDAR ($38,000) and SA ($40,000), with approximately 50% greater cost for Kairos ($60,000). The LDAR cost estimates for all aerial and ground teams include the costs for the individual portions of emission detection, quantification, and leak repair. Although emission quantification is not part of routine LDAR, it was performed in this study for comparing the different LDAR platforms. Sensitivity calculations for LDAR excluding emission quantifications, which lead to minor changes in results, are described in SI Section 6. The LDAR cost estimates in this study assume long-term routine costs to perform an annual routine LDAR program as described below.
Considering a conventional ground-based LDAR program with semiannual inspection frequency and a Gaussian leak frequency distribution, each fixable leak would on average continue to emit CH4 for a quarter year (2190 hr, i.e., until LDAR is repeated at the same facility) without the LDAR program. Yet in actual operating conditions, company standard operating and maintenance practices (beyond LDAR) may detect some of these leaks, especially the high-emitting leaks. Although the LDAR frequency may vary among operators or regions, we assume the same frequency for both ground and aerial LDAR to allow a fair comparison between both LDAR types.
As shown in , the cost-effectiveness of ground-based LDAR (US$6.50–7.00 spent per Mscf CH4 emissions avoided) is comparable to SA (US$6.95–7.50) in our base case, and both are substantially more cost-effective than Kairos (US$30.59–33.77). The factor of 4.5 difference between Kairos and the other two platforms is mostly due to Kairos’ relative high CH4 MDL resulting in six detected facilities for Kairos (excluding known events) compared with 22 for SA and 49 for ground teams, and partially due to cost differences. This shows that potential future improvements in the aerial LDAR technologies (i.e., a lower CH4 MDL and enhanced detection reliability under varying illumination conditions for Kairos) could substantially improve aerial LDAR cost-effectiveness as defined here.
However, Kairos’ and SA’s cost-effectiveness outperform ground-based LDAR in scenario 2 by factors of 3 and 15, respectively, despite the differences in aerial MDL between Kairos and SA in this study. The aerial cost-effectiveness in this scenario is based on the assumption that future ground LDAR can be improved to detect and repair substantially more leaks than in this study (that were potentially undetected/unmeasured by ground teams due to missed or episodic leaks).
Note that the absolute cost-effectiveness values presented here were specifically derived to enable a comparison between ground-based and aerially guided LDAR. The cost parameters used here (SI Section 5) are consistent with some other major studies (EPA Citation2016b; ICF International Citation2016). However, differences in scope and analytical system boundaries (e.g., EPA’s OOOOa analysis includes the cost of developing a monitoring plan, compliance notification, whereas the ICF study and this study do not include it) prevent a meaningful cross-study comparison. Harmonizing all analytical differences is beyond the scope of this paper.
All results presented in are specific to the Fayetteville Shale dry gas region, which does not include key fixable sources such as condensate tanks, which would likely constitute additional fixable emission sources for aerial surveys in other basins. A recent OGI helicopter survey (Lyon et al. Citation2016) and a ground-based fence-line measurement study (Brantley et al. Citation2014) (supported with OGI footage), both across the United States, suggest that tank emissions include both fixable leaks and venting, and that the observed emissions also have a highly skewed distribution. In fact, 20% of fixable sources in the Brandt, Heath, and Cooley (Citation2016) data set are from different types of tanks (not all types are specified), which contribute 47% of cumulative fixable emissions.
Discussion
To the best of our knowledge, this is the first study to empirically compare the CH4 emission mitigation potential and cost-effectiveness of ground-based and aerially guided LDAR in the O&G industry during normal operating conditions. Beyond comparing two specific aerial NG detection technologies in one NG basin, the objectives of this study were (i) to better understand the practical challenges of implementing aerially guided LDAR and (ii) to demonstrate how aerial NG detection technologies can be employed to direct and improve on existing ground-based LDAR. In contrast, previous studies (Conley et al. Citation2017; Frankenberg et al. Citation2016; Kemp, Ravikumar, and Brandt Citation2016; Thorpe et al. Citation2017) either focused on the measurement techniques or were computer simulations. Although the findings in this study account for existing, commercially available aerial NG detection technologies, these technologies may evolve in the future. As illustrated here, the intention of using aerial NG detection technologies is not to replace current LDAR, but to make current LDAR more effective by providing ground teams with data to prioritize facilities with high CH4 emission rates.
We show that aerially guided LDAR can detect sufficiently large leaks to mitigate about half or more of all fixable CH4 emissions depending on the employed method’s CH4 MDL. Considering the uncertainties and limitations discussed earlier (including the stated system boundaries for comparing costs among LDAR platforms), aerially guided LDAR can be at least as cost-effective as ground-based LDAR alone, also depending on the employed method’s CH4 MDL. This study also points out important open questions and practical considerations for future developments and implementations of aerially guided LDAR or any remote sensing–based LDAR.
Our results show that fixable CH4 emissions per O&G production facility determined from the aerial approach are up to an order of magnitude greater compared with ground-based detects. Further research needs to identify the potential reasons for this gap. This may include undetected/unmeasured leaks by ground teams, which followed regulatory LDAR procedures in this study. Our results show that these potentially missed CH4 sources by ground teams (along with other plausible explanations such as episodic CH4 sources and aerial false positives) largely contribute to the overall uncertainty, which is represented by the difference between our base case and scenario 2. In future study designs, ground teams may be charged with identifying, documenting, and quantifying (when possible) any other CH4 sources that are not considered part of an LDAR protocol. Although this could increase the scope of fixable emission sources for routine ground-based LDAR, it may also reduce the uncertainty in the cost-effectiveness of aerially guided LDAR.
The Fayetteville Shale CH4 emission rate size distributions in show that nonfixable CH4 sources (e.g., G&B compressor exhaust CH4 slip, liquids unloading, blowdowns) are also about an order of magnitude larger than fixable CH4 sources. This suggests that the detection of facilities using aerial methods is often due to signals from expected nonfixable CH4 sources (those occurring by design). The detected nonfixable CH4 sources may originate from the same facilities with other fixable sources. As a result, a large aerial detect may or may not result in the ground confirmation of a large fixable leak. Vice versa, a relatively small aerial detect could be confirmed as a relatively large fixable leak. The ability to remotely distinguish between fixable and nonfixable CH4 sources would constitute a substantial improvement of aerially guided LDAR. This may include better pinpointing specific CH4 sources from the air or facility-based smart communication systems that automatically signal known nonfixable CH4 releases from sources such as liquids uloadings, blowdowns, and activated pneumatic devices. This may improve cost-effectiveness only marginally (ground confirmation cost was only 3–11% of total aerial cost in this study; SI Table 4). However, it would allow ground teams to confirm and fix leaks more quickly considering the limited availability of ground teams and the potential importance of episodic leaks, both of which were major impediments for explaining the large differences between aerial and ground-based measurements.
In particular, G&B stations will mostly yield a detect by aerial teams because of compressor exhaust CH4 slip, but since CH4 slip is expected at all operating G&B stations, this is often not a relevant signal for fixable leaks. Thus, future aerially guided LDAR may focus on well pads and exclude G&B stations. Nevertheless, in cases where bottom-up inventories of specific G&B stations are available (with known engine counts and types and operating status), aerial surveys may identify anomalously high emitting G&B stations for further investigation by ground teams, e.g., to identify and fix potentially abnormal operating conditions.
Given the regional heterogeneity in leak size distributions shown in this study and elsewhere (Brandt, Heath, and Cooley Citation2016; Ravikumar and Brandt Citation2017), aerially guided LDAR will be more effective in some regions compared with others. In particular, the aerial technologies may detect more leaks in wet gas regions with substantial emissions from condensate tanks and other associated equipment. It is thus expected that the cost-effectiveness of aerially guided LDAR (relative to conventional ground-based LDAR only) would be better in wet gas regions compared with the dry Fayetteville shale region (or other dry gas regions in the United States or internationally). Also, regions with greater distances between facilities are more suitable for the aerial approach.
Through further research and development of the aerial CH4 emission detection technology and the logistics to guide ground-based LDAR teams using aerial CH4 detects, it may be possible for operators to locate the CH4 high-emitting equipment leaks more cost-effectively than current techniques involving scheduled, ground-based LDAR inspections only. The following improvements in field study design based on the practical experiences from this pilot research project may improve the conclusiveness of future findings:
Temporal variability has been identified as a critical factor in understanding O&G CH4 emissions in recent studies (National Academies of Sciences Engineering and Medicine Citation2018; Schwietzke et al. Citation2017; Vaughn et al. Citationin press), consistent with this paper. The wide spatial coverage of aerial measurements in a short amount of time (vs. ground measurements) increases the chances of detecting episodic leaks. Deploying more than one quick response ground LDAR team may lead to more prompt ground confirmation, more identification of episodic leaks, and thus a more mechanistic understanding of the underlying leak causes. If this is impossible due to lack of ground personnel, the conventional ground LDAR teams could be deployed prior to the aerial experiment without repairing leaks to avoid biasing the leak potential. This experimental design may reduce the fixable emission uncertainty arising from the potential influence of temporal variability of leaks.
Performing controlled NG release tests on multiple sampling days (ideally each sampling day) may calibrate the aerial technologies’ CH4 MDL to potentially daily varying weather conditions (e.g., illumination levels).
Aerial detection technologies with postflight facility reporting (such as Kairos) should be accompanied by real-time aerial detection technologies in the same sampling boxes on the same day as done in this study (albeit not on all days). This will help minimize the effects of temporal variability (see above) and will increase the sample size crucial for evaluating detection reliability.
When aerial detects could not be confirmed by ground teams, ground teams may inspect neighboring facilities given potential location errors of the aerial detect.
The field campaign schedule should allow for off-days for both aerial and ground confirmation teams to allow for the same leeway in flight versus no-flight decisions as in real-world applications.
Target only well pads to obtain the cost-effectiveness estimates not determined in this study. This approach is advisable over removing G&B stations from cost-effectiveness calculations post campaign because both ground and aerial teams (at least the SA approach) would sample differently if the study design excludes G&B stations.
Conflict of interest
The authors declare the following personal competing financial interests. Stephen Conley is the owner of Scientific Aviation Inc., which provided one of the aerial methane measurement technologies for comparison with current ground-based measurements in this study. Ken Branson is an employee of Kairos Aerospace, which provided one of the aerial methane measurement technologies for comparison with current ground-based measurements in this study. Research funding provided by institutions associated with the oil and gas industry is as described in the Acknowledgments and Fiji George, Doug Jordan, Changyong Zhang, and Heide L. Mairs are employees and stockholders of these institutions. Gilbert R. Jersey is a former employee and a stockholder and is now a consultant to institutions associated with the oil and gas industry. Matthew Harrison and Terri Lauderdale are employees and stockholders of AECOM, which offers various engineering services to the oil and gas industry.
Supplemental Material
Download PDF (595 KB)Acknowledgment
The authors thank the facility operations teams of Southwestern Energy and XTO Energy and the ground LDAR teams of Southwestern Energy for data collection and cooperation with site access.
Supplemental data
Supplemental data for this paper can be accessed on the publisher’s website.
Additional information
Funding
Notes on contributors
Stefan Schwietzke
Stefan Schwietzke is a research scientist at the Cooperative Institute for Research in Environmental Sciences, University of Colorado, and the Global Monitoring Division, NOAA Earth System Research Laboratory, in Boulder, CO.
Matthew Harrison
Matthew Harrison is vice president at AECOM in Austin, TX.
Terri Lauderdale
Terri Lauderdale is a senior project manager at AECOM in Austin, TX.
Ken Branson
Ken Branson is a data scientist at Kairos Aerospace in Mountain View, CA.
Stephen Conley
Stephen Conley is the president of Scientific Aviation in Boulder, CO, and an associate specialist in the Department of Land, Air, and Water Resources at the University of California in Davis, CA.
Fiji C. George
Fiji C. George was the director of regulatory policy at Southwestern Energy Company in Spring, TX, throughout this project. He is now the director of climate and sustainability at Cheniere Energy in Houston, TX.
Doug Jordan
Doug Jordan was the corporate environmental programs director at Southwestern Energy Company in Spring, TX, throughout this project. He has recently moved to Newfield Exploration in The Woodlands, TX.
Gilbert R. Jersey
Gilbert R. Jersey is a consultant for XTO Energy in Fort Worth, TX.
Changyong Zhang
Changyong Zhang is an engineering specialist at ExxonMobil Upstream Research in Spring, TX.
Heide L. Mairs
Heide L. Mairs is a senior engineering advisor at ExxonMobil Upstream Research in Spring, TX.
Gabrielle Pétron
Gabrielle Pétron is a research scientist at the Cooperative Institute for Research in Environmental Sciences, University of Colorado, and the Global Monitoring Division, NOAA Earth System Research Laboratory, in Boulder, CO.
Russell C. Schnell
Russell C. Schnell is the deputy director of the Global Monitoring Division, NOAA Earth System Research Laboratory, in Boulder, CO.
Related Research Data
References
- Allen, D. T., A. P. Pacsi, D. W. Sullivan, D. Zavala-Araiza, M. Harrison, K. Keen, M. P. Fraser, A. Daniel Hill, R. F. Sawyer, and J. H. Seinfeld. 2015. Methane emissions from process equipment at natural gas production sites in the United States: Pneumatic controllers. Environ. Sci. Technol. 49 (1):633–640. doi:10.1021/es5040156.
- Anifowose, B., and M. Odubela. 2015. Methane emissions from oil and gas transport facilities - exploring innovative ways to mitigate environmental consequences. J. Clean. Prod. 92:121–133. doi:10.1016/j.jclepro.2014.12.066.
- Arkansas Oil and Gas Commission. 2016. Fayetteville Shale Gas Sales Information. http://aogc2.state.ar.us/Fayshale/Default.aspx.
- Brandt, A. R., G. A. Heath, and D. Cooley. 2016. Methane leaks from natural gas systems follow extreme distributions. Environ. Sci. Technol. 50(22):12512–12520. American Chemical Society. doi:10.1021/acs.est.6b04303.
- Brantley, H. L., E. D. Thoma, W. C. Squier, B. B. Guven, and D. Lyon. 2014. Assessment of methane emissions from oil and gas production pads using mobile measurements. Environ. Sci. Technol. 48 (24):14508–14515. American Chemical Society. doi:10.1021/es503070q.
- Conley, S., I. Faloona, S. Mehrotra, M. Suard, D. H. Lenschow, C. Sweeney, S. Herndon, S. Schwietzke, G. Pétron, J. Pifer, E. A. Kort, and R. Schnell. 2017. Application of Gauss’s theorem to quantify localized surface emissions from airborne measurements of wind and trace gases. Atmos. Meas. Tech. 10 (9):1–29. doi:10.5194/amt-10-3345-2017.
- Crosson, E. R. 2008. A cavity ring-down analyzer for measuring atmospheric levels of methane, carbon dioxide, and water vapor. Appl. Phys. B Lasers Opt. 92:403–408. doi:10.1007/s00340-008-3135-y.
- EIA. 2017a. U.S. Energy information administration. www.eia.gov.
- EIA. 2017b. United States expected to become a net exporter of natural gas this year. Https://Www.Eia.Gov/Todayinenergy/Detail.Php?Id=32412&src=email.
- EPA. 2016a. EPA releases first-ever standards to cut methane emissions from the oil and gas sector. https://www.epa.gov/newsreleases/epa-releases-first-ever-standards-cut-methane-emissions-oil-and-gas-sector.
- EPA. 2016b. Background technical support document for the proposed new source performance standards 40 CFR part 60, Subpart OOOOa. Https://Www.Regulations.Gov/Document?D=EPA-HQ-OAR-2002-0037-0180.
- EPA. 2016c. 40 CFR part 60, oil and natural gas sector: Emission standards for new, reconstructed, and modified sources, Final Rule, Federal Register Volume 81, No. 107, June 3, 2016.
- EPA Office of Inspector General. 2018. EPA did not use allegedly flawed studies to estimate methane emissions or set new source performance standards for oil and natural gas production. Https://Www.Epa.Gov/Sites/Production/Files/2018-03/Documents/_epaoig_20180316-18-p-0129.Pdf.
- Frankenberg, C., A. K. Thorpe, D. R. Thompson, G. Hulley, E. A. Kort, N. Vance, J. Borchardt, T. Krings, K. Gerilowski, C. Sweeney, S. Conley, B. D. Bue, A. D. Aubrey, S. Hook, and R. O. Green. 2016. Airborne methane remote measurements reveal heavy-tail flux distribution in four corners region. Proc. Natl. Acad. Sci. 113:9734–9739. doi:10.1073/pnas.1605617113.
- George, F. C. 2018. Rising to the methane challenge – a synopsis of the evolution of corporate and national methane policy. Proceedings of the 27th World Gas Conference, Washington, DC. Submitted.
- Howard, T., T. W. Ferrara, and A. Townsend-Small. 2015. Sensor transition failure in the high flow sampler: Implications for methane emission inventories of natural gas infrastructure. J. Air Waste Manag. Assoc. 65:856–862. doi:10.1080/10962247.2015.1025925.
- ICF International. 2016. Economic analysis of methane emission reduction potential from natural gas systems. Http://Www.Onefuture.Us/Wp-Content/Uploads/2016/06/ONE-Future-MAC-Final-6-1.Pdf.
- Johnson, M. R., D. R. Tyner, S. Conley, S. Schwietzke, and D. Zavala-Araiza. 2017. Comparisons of airborne measurements and inventory estimates of methane emissions in the alberta upstream oil and gas sector. Environ. Sci. Technol. 51 (21):13008–13017. doi:10.1021/acs.est.7b03525.
- Karion, A., C. Sweeney, E. A. Kort, P. B. Shepson, A. Brewer, M. Cambaliza, S. A. Conley, K. Davis, A. Deng, M. Hardesty, S. C. Herndon, T. Lauvaux, T. Lavoie, D. Lyon, T. Newberger, G. Pétron, C. Rella, M. Smith, S. Wolter, T. I. Yacovitch, and P. Tans. 2015. Aircraft-based estimate of total methane emissions from the barnett shale region. Environ. Sci. Technol. 49 (13):8124–8131. American Chemical Society. doi:10.1021/acs.est.5b00217.
- Kemp, C. E., A. P. Ravikumar, and A. R. Brandt. 2016. Comparing natural gas leakage detection technologies using an open-source “virtual gas field” simulator. Environ. Sci. Technol. 50 (8):4546–4553. doi:10.1021/acs.est.5b06068.
- Lamb, B. K., S. L. Edburg, T. W. Ferrara, T. Howard, M. R. Harrison, C. E. Kolb, A. Townsend-Small, W. Dyck, A. Possolo, and J. R. Whetstone. 2015. Direct measurements show decreasing methane emissions from natural gas local distribution systems in the United States. Environ. Sci. Technol. 49(8):5161–5169. American Chemical Society. doi:10.1021/es505116p.
- Lyon, D. R., R. A. Alvarez, D. Zavala-Araiza, A. R. Brandt, R. B. Jackson, and S. P. Hamburg. 2016. Aerial surveys of elevated hydrocarbon emissions from oil and gas production sites. Environ. Sci. Technol. 50 (9):4877–4886. American Chemical Society. doi:10.1021/acs.est.6b00705.
- Mitchell, A. L., D. S. Tkacik, J. R. Roscioli, S. C. Herndon, T. I. Yacovitch, D. M. Martinez, T. L. Vaughn, L. L. Williams, M. R. Sullivan, C. Floerchinger, M. Omara, R. Subramanian, D. Zimmerle, A. J. Marchese, and A. L. Robinson. 2015. Measurements of methane emissions from natural gas gathering facilities and processing plants: Measurement results. Environ. Sci. Technol. 49(5):3219–3227. American Chemical Society. doi:10.1021/es5052809.
- National Academies of Sciences Engineering and Medicine. 2018. Improving characterization of anthropogenic methane emissions in the United States. Washington, DC: The National Academies Press. doi:10.17226/24987.
- Papailias, G., and I. Mavroidis. 2018. Atmospheric emissions from oil and gas extraction and production in Greece. Atmosphere (Basel). 9(4):152. Multidisciplinary Digital Publishing Institute. doi:10.3390/atmos9040152.
- Ravikumar, A. P., and A. R. Brandt. 2017. Designing better methane mitigation policies: The challenge of distributed small sources in the natural gas sector. Environ. Res. Lett. 12 (4):44023. http://stacks.iop.org/1748-9326/12/i=4/a=044023.
- Saunois, M., P. Bousquet, B. Poulter, A. Peregon, P. Ciais, J. G. Canadell, E. J. Dlugokencky, G. Etiope, D. Bastviken, S. Houweling, G. Janssens-Maenhout, F. N. Tubiello, S. Castaldi, R. B. Jackson, M. Alexe, V. K. Arora, D. J. Beerling, P. Bergamaschi, D. R. Blake, G. Brailsford, V. Brovkin, L. Bruhwiler, C. Crevoisier, P. Crill, C. Curry, C. Frankenberg, N. Gedney, L. Höglund-Isaksson, M. Ishizawa, A. Ito, F. Joos, H.-S. Kim, T. Kleinen, P. Krummel, J.-F. Lamarque, R. Langenfelds, R. Locatelli, T. Machida, S. Maksyutov, K. C. McDonald, J. Marshall, J. R. Melton, I. Morino, S. O'Doherty, F.-J. W. Parmentier, P. K. Patra, C. Peng, S. Peng, G. P. Peters, I. Pison, C. Prigent, R. Prinn, M. Ramonet, W. J. Riley, M. Saito, R. Schroeder, I. J. Simpson, R. Spahni, P. Steele, A. Takizawa, B. F. Thornton, H. Tian, Y. Tohjima, N. Viovy, A. Voulgarakis, M. Van Weele, G. van der Werf, R. Weiss, C. Wiedinmyer, D. J. Wilton, A. Wiltshire, D. Worthy, D. B. Wunch, X. Xu, Y. Yoshida, B. Zhang, Z. Zhang, and Q. Zhu. 2016. The global methane budget: 2000–2012. Earth Syst. Sci. Data Discuss. 1–79. Copernicus GmbH. June. doi:10.5194/essd-2016-25.
- Schwietzke, S., G. Pétron, S. Conley, C. Pickering, I. Mielke-Maday, E. J. Dlugokencky, P. P. Tans, T. Vaughn, C. Bell, D. Zimmerle, S. Wolter, C. W. King, A. B. White, T. Coleman, L. Bianco, and R. C. Schnell. 2017. Improved mechanistic understanding of natural gas methane emissions from spatially resolved aircraft measurements. Environ. Sci. Technol. 51(12):7286–7294. American Chemical Society. doi:10.1021/acs.est.7b01810.
- Schwietzke, S., O. A. Sherwood, L. M. P. Bruhwiler, J. B. Miller, G. Etiope, E. J. Dlugokencky, S. E. Michel, V. A. Arling, B. H. Vaughn, J. W. C. White, and P. P. Tans. 2016. Upward revision of global fossil fuel methane emissions based on isotope database. Nature. 538:7623. doi:10.1038/nature19797.
- Thorpe, A. K., C. Frankenberg, A. D. Aubrey, D. A. Roberts, A. A. Nottrott, T. A. Rahn, J. A. Sauer, M. K. Dubey, K. R. Costigan, C. Arata, A. M. Steffke, S. Hills, C. Haselwimmer, D. Charlesworth, C. C. Funk, R. O. Green, S. R. Lundeen, J. W. Boardman, M. L. Eastwood, C. M. Sarture, S. H. Nolte, I. B. Mccubbin, D. R. Thompson, and J. P. McFadden. 2016. Mapping methane concentrations from a controlled release experiment using the next generation airborne visible/infrared imaging spectrometer (AVIRIS-NG). Remote Sens. Environ. 179:104–115. doi:10.1016/j.rse.2016.03.032.
- Thorpe, A. K., C. Frankenberg, D. R. Thompson, R. M. Duren, A. D. Aubrey, B. D. Bue, R. O. Green, et al. 2017. Airborne DOAS retrievals of methane, carbon dioxide, and water vapor concentrations at high spatial resolution: Application to AVIRIS-NG. Atmos. Meas. Tech. doi:10.5194/amt-10-3833-2017.
- Vaughn, T. L., Bell, C. S., Pickering, C. P., Schwietzke, S., Heath, G. A., Pétron, G., Zimmerle, D., Nummedal, D. in press. Temporal Variability Largely Explains Difference in Top-down and Bottom-up Estimates of Methane Emissions from a Natural Gas Production Region. Proceedings of the National Academy of Sciences of the United States of America. In Review.
- Vaughn, T. L., C. S. Bell, T. I. Yacovitch, J. R. Roscioli, S. C. Herndon, S. Conley, S. Schwietzke, G. A. Heath, G. Pétron, and D. Zimmerle. 2017. Comparing facility-level methane emission rate estimates at natural gas gathering and boosting stations. Elem. Sci. Anth. 5:71. doi:10.1525/elementa.257.
- Yacovitch, T. I., B. Neininger, S. C. Herndon, H. D. van der Gon, S. Jonkers, J. Hulskotte, J. R. Roscioli, and D. Zavala-Araiza. 2018. Methane emissions in the Netherlands: The groningen field. Elem. Sci. Anth. 6 (1):57. doi:10.1525/elementa.308.
- Zavala-Araiza, D., R. A. Alvarez, D. R. Lyon, D. T. Allen, A. J. Marchese, D. J. Zimmerle, and S. P. Hamburg. 2017. Super-emitters in natural gas infrastructure are caused by abnormal process conditions. Nat. Commun. 8(January):14012. doi:10.1038/ncomms14012.