
Abstract
Coal combustion is one of the most significant anthropogenic CO2 and air pollution sources globally. This paper studies the atmospheric emissions of a power plant fuelled with a mixture of industrial pellets (10.5%) and coal (89.5%). Based on the stack measurements, the solid particle number emission, which was dominated by sub-200 nm particles, was 3.4×10¹¹ MJ-1 for the fuel mixture when electrostatic precipitator (ESP) was cleaning the flue gas. The emission factor was 50 mg MJ-1 for particulate mass and 11 740 ng MJ-1 for the black carbon with the ESP. In the normal operation situation of the power plant, i.e., including the flue-gas desulphurisation and fabric filters (FGD and FF), the particle number emission factor was 1.7×10⁸ MJ-1, particulate mass emission factor 2 mg MJ-1 and black carbon emission factor 14 ng MJ-1. Transmission electron microscopy (TEM) analysis supported the particle number size distribution measurement in terms of particle size and the black carbon concentration. The TEM images of the particles showed variability of the particle sizes, morphologies and chemical compositions. The atmospheric measurements, conducted in the flue-gas plume, showed that the flue-gas dilutes closed to background concentrations in 200 sec. However, an increase in particle number concentration was observed when the flue gas aged. This increase in particle number concentration was interpret as formation of new particles in the atmosphere. In general, the study highlights the importance of detailed particle measurements when utilizing new fuels in existing power plants.
Implications: CO2 emissions of energy production decrease when substituting coal with biofuels. The effects of fuels changes on particle emission characteristics have not been studied comprehensively. In this study conducted for a real-scale power plant, co-combustion of wood pellets and coal caused elevated black carbon emissions. However, it was beneficial from the total particle number and particulate mass emission point of view. Flue-gas cleaning can significantly decrease the pollutant concentrations but also changes the characteristics of emitted particles. Atmospheric measurements implicated that the new particle formation in the atmospheric flue-gas plume should be taken into account when evaluating all effects of fuel changes.” Are implication statements part of the manuscript?
Introduction
During next years and decades, global warming will enforce the increase of the share of renewable energy production, such as solar power, wind power, and geothermal heat, as well as biogas and biomass for combustion processes. Regarding the most direct substitution for fossil fuels, the utilization of biomass has been seen to be the promising solution, especially in respect of the current infrastructure of energy systems (Strzalka, Schneider, and Eicker Citation2017). Therefore, new biomass alternatives for combustion applications, such as oat hulls (Al-Naiema et al. Citation2015), pulverized olive residues (Jiménez and Ballester Citation2004), bark, sludge, solid recovered fuel (Vainio et al. Citation2013), straw (Hansen et al. Citation1998), waste (Kuuluvainen et al. Citation2015), and many more have been studied. Compared to fossil fuel combustion, biomass combustion could lower NOx, SOx, and fossil-CO2 emissions (Verma et al. Citation2017) because the biomass typically contains less sulfur and nitrogen. In addition, biomass could lower the particulate matter (PM) emissions. For instance, in circulating fluidized bed boiler (CFB) the PM emissions were lowered by a factor of 12 when 50% of coal (by weight) was substituted with biomass (Al-Naiema et al. Citation2015). However, the utilization of new types of fuels can cause undesirable effects also, for example, on the boiler operation or on the emissions of power plants.
Implementation of biomass to combustion processes will not be straightforward with boilers designed for fossil fuels. Hence, upgrading of combustion technologies or pretreatment of the fuels might be required to enable co-combustion of biomass and fossil fuels, during the transition time before new boilers designed for biomass combustion (Madanayake et al. Citation2017) will largely be taken into use. The problems in biomass combustion are related to boiler operation, such as increased corrosion risk (Pisa and Lazaroiu Citation2012), bed agglomeration in fluidized bed combustors (FBC) (Piotrowska et al. Citation2012; Sevonius, Yrjäs, and Hupa Citation2014), grindability of the fuel, fuel moisture, low density of biomass (Madanayake et al. Citation2017), and deposit formation (Heinzel et al. Citation1998; Nutalapati et al. Citation2007). Some of the problems could be solved by leaching, torrefaction, and mechanical pretreatment (grinding and pelletizing) of the biomass (Madanayake et al. Citation2017) or by ferric sulfate additives to the fuel (Kuuluvainen et al. Citation2015). Effect of different pelletizing methods to the grindability and combustion of fuel was studied, for example, by Tolvanen et al. (Tolvanen, Keipi, and Raiko Citation2016), who showed that raw wood pellets had the slowest reaction rate of the studied pellet qualities and that to achieve similar reaction rate as other fuels, the raw wood pellets had to go through pretreatment before combustion. Co-milling and co-combustion of pellets and coal have been tested and taken in use, for example, in the United Kingdom (Colechin Citation2005; Rath et al. Citation2010). Same studies have indicated that existing power plants could substitute coal with wood pellets (Colechin Citation2005; Rath et al. Citation2010; Savolainen Citation2003). In general, new fuels may also have lower alkali content than the coal (Mylläri et al. Citation2017), which might affect corrosion risk of boiler surfaces.
Fuel characteristics, like its chemical composition, can have high influence on the combustion and the particles formed in the combustion. These kinds of effects have been observed in several studies focused on flue gas from pulverized-fuel combustion. Particles from combustion can be characterized based on their diameter, concentration, and chemical composition. These characteristics may change in the flue-gas cleaning processes. Ylätalo and Hautanen (Citation1998) reported—for pulverized combustion of Polish coal without flue-gas cleaning—that the particle size distribution consisted of two modes, and that the mean diameter of the first particle mode was 50 nm and the mean diameter of the second mode was 300–400 nm. In addition, they observed that the mean particle size of the first mode increased slightly as an effect of the electrostatic precipitator (ESP). On the other hand, Linak et al. (Citation2002) studied the combustion of a blend of Indonesian and Australian coal and found a trimodal particle number size distribution, with particle modes of 100 nm, 1000 nm, and 2000 nm, when the flue gas was sampled after the electrostatic precipitator’s outlet. In addition, combustion of anthracite coal from Shanxi province produced a bimodal particle number size distribution with modes of 100 nm and 2000 nm (Yi et al. Citation2008). In studies where the flue-gas cleaning has included ESP, flue-gas desulfurization unit (FGD), and fabric filters (FF), the mean diameter of particles has been between 30 and 90 nm (Frey et al. Citation2014; Mylläri et al. Citation2016). The chemical composition of the particles from coal combustion has been reported to consist of mineral and inorganic substances originating from the coal (Frey et al. Citation2014; Linak et al. Citation2002; Saarnio et al. Citation2014; Yi et al. Citation2008). However, the flue-gas desulfurization can increase the particulate matter originating from reagents used in the desulfurization process (Saarnio et al. Citation2014).
According to the authors’ knowledge, particle emissions from the co-combustion of wood pellets and coal in real-scale power plants have been studied only by Frey et al. (Citation2014). In their study with a 4.5% share of pellets in the fuel, the mean diameter of particles was 70–90 nm after the ESP, FGD, and FF, and larger when measured after the ESP. The particle number emissions were 6.7 × 10¹⁰ MJ−1 with the electrostatic precipitator (ESP) and 7.2 × 10¹⁰ MJ−1 with ESP, flue-gas desulfurization, and fabric filters.
Atmospheric studies for coal combustion emissions (Stevens and Pierce Citation2013; Junkermann and Hacker Citation2015; Lonsdale et al. Citation2012; Stevens et al. Citation2012; Mylläri et al. Citation2016) have shown that the atmospheric dilution of flue gas is affected by turbulent mixing, background concentrations, and source strength. In general, all the atmospheric studies have reported that the particle number concentration increases when the flue gas plume is aged, which highlights the importance of atmospheric studies when evaluating the effects of fuel changes on particle emissions.
This study focuses on characterizing the emissions from co-combustion of wood pellets and coal with a special attention on particle number size distribution and black carbon concentration. The measurements were made for a real-scale power plant combusting 10.5% of industrial quality wood pellets mixed with coal. The particle characterization was made in two flue-gas cleaning situations. Transmission electron microscope images of the combustion particles were used to support the black carbon and particle number size distribution measurements.
Experimental
The studied power plant is a base-load station located near Helsinki city center in Finland. The power plant consists of two boilers (each 363 MWth). One of the boilers was put in use in 1974 (boiler 1) and the other in 1977 (boiler 2). The power plant was originally designed to combust coal, but in this study the experiments were conducted during wood pellet–coal mixture combustion in boiler 1; the fuel consisted of wood pellets of industrial quality (10.5% industrial pellets) and Russian coal (89.5%). Details of the industrial pellets and coal are given in . The fuel components were the same as in Mylläri at al. (Citation2016; Citation2017). The fuel mixture was pulverised in two grinders before combustion in six low-NOx technology burners (Tampella/Babcock-Hitachi HTNR low-NOx, installed in 1992–1993), and six more burners of boiler 1 were fed with the coal from two grinders. The grinding was affected by the pellet addition so that the mean fuel size increased from 47–62 μm (for coal) to 54–174 μm (for the industrial pellet–coal mixture) (Mylläri et al. Citation2017). The burners were situated at the front wall of the boiler. Boiler 2 was used with Russian coal without the addition of industrial pellets. The measurements of flue gas were made simultaneously in the stack for the flue gas from boiler 1 using the wood pellet–coal mixture and in the atmosphere for the mixture of flue gases from both of the boilers.
Table 1. Properties of coal and industrial pellets (Mylläri et al. Citation2017).
In the stack measurement, the sample was taken from the flue-gas duct in two different flue-gas cleaning situations: with and without a semidry flue-gas desulfurization plant (FGD, put into use in 1991) and fabric filters (FF), later called “FGD+FF on/off.” The flue gas was cleaned with electrostatic precipitators in both of the “FGD+FF on/off” situations. The flue gas was sampled from one point close to the center line of the flue-gas duct and diluted with a fine particle sampler (FPS, Dekati Ltd., (Mikkanen and Moisio Citation2001)) using particle-free clean pressurized air. Total dilution ratio (DR) used in the measurements was 22 for “FGD+FF on” and 21 for “FGD+FF off.” The flow inside the flue-gas duct is turbulent and it fulfills the standard EN 15259 for the measurement location. Both the dilution air and the diluter were heated up to 200ºC to avoid nucleation in the sampling system. Particle number size distributions were measured with an electrical low pressure impactor (ELPI, Dekati Ltd.; Keskinen, Pietarinen, and Lehtimäki Citation1992) and a scanning mobility particle sizer (SMPS, TSI Inc.; Wang and Flagan Citation1990). The SMPS, consisting of a DMA3071 (TSI, Inc.) and a CPC3775 (TSI, Inc.), was operated with 0.6/6 standard L min−1 flows. Particle number concentration was measured with a condensation particle counter (CPC3776, TSI, Inc.). A dual-spot aethalometer (AE33, Magee Scientific) with PM1 cyclone was used to measure the aerosol light absorption at 880 nm and corresponding black carbon (BC) mass concentration in the PM1 size fraction. Detailed information about the measurement setup for stack and atmospheric measurements are shown in . Concentrations of the gases in the diluted sample were analyzed with a CO2 analyzer (model VA 3100, Horiba) and NO, NO2, and NOx analyzer (model APNA 360, Horiba). Measurement data were also received from regulatory monitoring of the power plant emissions; raw flue-gas SO2, NOx, and CO2 concentrations and dust (SICK RM 230, calibrated based on SFS-EN 13284–1 standard) were measured directly inside the flue-gas duct. Measurement setup and instruments were similar to those in the studies by Mylläri et al. (Citation2016). In addition to online measurements, the flue-gas particles of coal + 10.5% industrial pellets combustion were collected with a flow-through-type sampler onto holey carbon grids for microscopy studies. These particle samples were studied later with a transmission electron microscope (TEM, Jeol JEM-2010) equipped with an energy-dispersive x-ray spectrometer (EDS, Noran Vantage with Si(Li) detector, Thermo Scientific). Furthermore, the amount of unburned carbon in fly ash samples collected from ESP was determined with a loss on ignition (LOI) method. Further, radiocarbon dating was used to analyze the portion of biomass-based carbon in the fly ash.
Figure 1. (a) Measurement setup used in stack measurements. (b) Measurement setup installed in the helicopter.
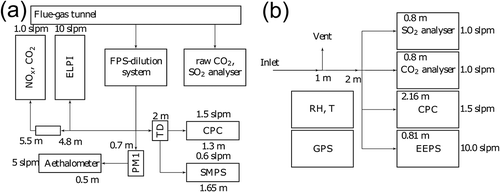
The measurements in the atmospheric flue-gas plume were made with a helicopter equipped with aerosol instruments. Measurements were conducted on 26 March 2014 at 10:30–11:41 UTC+2 for the “FGD+FF on” and 14:28–15:41 UTC+2 for the “FGD+FF off” situation. During the “FGD+FF on” flight, the temperature was 6.5 ± 0.05°C, wind speed was 8 ± 0.6 m/sec, and relative humidity was 29 ± 0.6%. During “FGD+FF off” flight, the temperature was 4.6 ± 0.4°C, wind speed was 6.25 ± 0.4 m/sec, and relative humidity was 38 ± 3%. No additional dilution of the sample was needed for the measurement equipment in the helicopter because of the significant natural dilution of the flue gas in the atmosphere. The measurement instruments installed in the helicopter had high sampling frequency (1 Hz). Particle size distribution was measured with an engine exhaust particle sizer (EEPS, TSI, Inc.; Mirme Citation1994) and the total particle number concentration with a CPC3776 (TSI, Inc.). Additionally, gaseous components CO2/CH4/H2O (Cavity ring-down spectrometry Picarro model G1301-m CO2/CH4/H2O flight analyzer) and SO2 (Thermo Scientific, Inc., model 43i SO2 analyzer with 5 sec response time) were also measured from the flue-gas plume. The position of the helicopter during the flight was recorded based on global positioning system (GPS) coordinates, shown in Figure SI1. Flight direction was 222 ± 7.2º during the “FGD+FF on” situation and 222 ± 7.3º during the “FGD+FF off” situation. The flue-gas plume dispersion and dilution were also measured with a Halo Photonics scanning Doppler lidar. Figure SI3 shows the cross section of the diluting plume in both of the FGD+FF cases. It should be noted that the flight measurements for “FGD+FF off” situation were interfered with by flue gas from the other boiler combusting 100% coal in “FGD+FF on” mode. The flue-gas ducts of the boilers were parallel inside the stack, and thus the atmospheric measurements were performed for the mixed flue-gas plume.
Results
lists the flue-gas concentrations of CO2, SO2, NOx, O2, and CO, total particle number (Ntot), and dust measured in the stack. In addition, shows the flow rate and the temperature of the flue gas inside the duct, as well as the emission factors for particle number, dust, and BC. The emission factors were calculated from total particle number, dust, and BC concentrations using the measured CO2 concentrations and multiplying that with 95.0115 g CO2 MJ−1 for 10.5% industrial pellets and coal (Statistics Finland, Fuel Classification Citation2017). All the values are presented for both studied flue-gas cleaning situations. In general, the CO2, NOx, and O2 concentrations and the flue-gas flow rate were relatively similar with both of the flue-gas cleaning situations. Instead, the “FGD+FF on” lowered the total particle number concentration from (738 ± 70) × 103 to 354 ± 623, that is, by a factor of 2000. The dust concentration was decreased by a factor of 20 and the SO2 concentration by a factor of 4. The FGD+FF also lowered the flue-gas temperature from 129ºC to 77ºC. The CO concentrations were slightly elevated in the combustion of pellets and coal compared to coal combustion, where CO concentration was 0 ± 0 ppm. No correlation between the two was observed in a more detailed analysis of CO and BC concentrations.
Table 2. Flue-gas concentrations of CO2, SO2, NOx, O2, and CO, total particle number (Ntot, >2.5 nm), dust, flue-gas flow rate, and temperature in the stack during the measurements. Mean values (± standard deviation) are presented for both flue-gas cleaning situations (“FGD+FF off” and “FGD+FF on”) for coal + 10.5% industrial pellets. Emission factors for BCPM1 (EFBC, ng MJ−1) and emission factors for particle number and mass (MJ−1 and μg MJ−1) are shown for the co-combustion situation and coal combustion situation. See Supplementary Table SI1 for CO2, SO2, NOx, N>2.5 nm, and dust concentrations in (mg Nm−3 or m−3) when reduced to 6% O2.
For the studied fuel, that is, for the mixture of coal and 10.5% industrial pellets, the particle number emission factor was 3.4 × 10¹¹ MJ−1 and the particulate mass emission factor calculated from the regulatory dust measurement results of the power plant was 50 mg MJ−1 in the “FGD+FF off” situation. In the “FGD+FF on” situation, the particle number emission factor was around 1.7 × 10⁸ MJ−1 and particle mass emission factor around 2 mg MJ−1 for the mixture of coal and 10.5% industrial pellets. The emission factor for the BC was calculated from 880-nm wavelength concentration data of the aethalometer. EFBC for the FGD+FF off situation was 2.8 × 10² μg/kg fuel. The use of FGD+FF decreased the EFBC to 0.33 μg/kg fuel—thus, by a factor of 848. The fly ash from the combustion of industrial pellets and coal contained 10.8% of unburned carbon. The amount of biomass-originated carbon in the fly ash was 0.5%, which is thus only a small portion of the total amount of unburned carbon in fly ash. When combusting coal, the mean amount of unburned carbon was higher (12 ± 2.8)% of the total amount of fly ash, analyzed from daily samples of the whole year 2012.
Mean particle number size distributions measured from the flue-gas duct are shown in . The particle number size distributions were measured in both of the studied flue-gas cleaning situations (“FGD+FF on” and “FGD+FF off”) with SMPS and ELPI. However, in the “FGD+FF on” situation the raw data measured by ELPI, that is, electric currents, were close to the noise level in the submicrometer particle size range, and thus, the particle number size distribution with the ELPI in “FGD+FF on” situation was not included in the figure. However, regardless of low particle concentration, the particle size distribution could be measured using the SMPS. Based on this measurement, in the “FGD+FF on” situation the mean electrical mobility equivalent diameter was 72 nm and the geometric standard deviation (GSD) of the number size distribution was GSD 1.51, measured with SMPS. In the “FGD+FF off” situation, the mean electrical mobility equivalent diameter was 74 nm and the GSD of the size distribution was 1.46. When measured with the ELPI, the mean aerodynamic equivalent diameter of the particle number size distribution was 152 nm (GSD 1.51) for the “FGD+FF off” situation. The difference in the mean diameters measured using the ELPI and the SMPS originates from the differences in the particle size classification principles of these instruments and indicates that the particles dominating the particle number size distributions have relatively high effective densities (see Ristimäki et al. Citation2002). Here, the effective density of particles was 2.5 g cm−3 when calculated based on the geometric mean diameters (GMD) of the size distributions of the particles in “FGD+FF off” situation.
Figure 2. (a) Particle number size distribution of solid particles measured at the stack in “FGD+FF on/off” situations with ELPI and SMPS. (b) Particle volume size distribution calculated from SMPS and ELPI results. (c, d) TEM images of particles collected on TEM grids in (c) “FGD+FF off” and (d) “FGD+FF on” situations. A mixture of industrial pellets and coal was used as a fuel in the experiment.
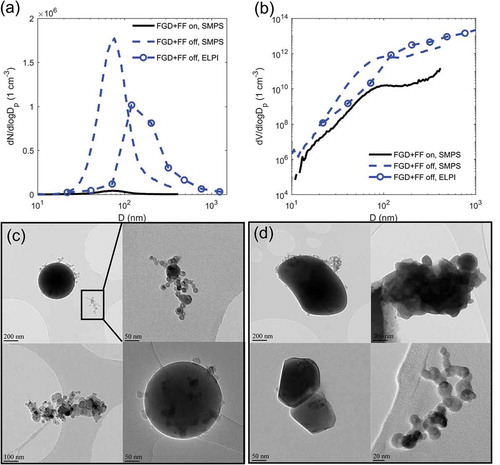
The particle volume size distributions are shown in for particles smaller than 1 μm in diameter. The particle volume size distributions show that the particles larger 100 nm in diameter significantly affect particulate volume and thus also the particulate mass concentration in the flue gas. The particle number size distributions are shown in Figure SI3 with a log–log scale, which shows in more detail the bimodality of the particle number size distribution.
also shows TEM images of the particles in both of the flue-gas cleaning situations, in “FGD+FF off” (c) and in “FGD+FF on” (d). In the “FGD+FF off” situation, three different types of particles were observed. First, the flue gas contained large spherical particles with diameter of around 500 nm. These particles were composed mainly of inorganic species; based on the EDS analyses these particles contained Si, Al, Fe, K, Ca, Mg, and Ti. The second type of particles was agglomerated particles that consisted mainly of spherical primary particles from 25 nm to 50 nm in diameter. These small primary particles in agglomerates contained Si, Al, Ca, P, and Fe. In addition, Mg was found in some of these primary particles. Third, there were particles that had the structure of agglomerated soot, but they also contained detectable amounts of Si, Al, P, and Ca. Also these particles contained spherical primary particles (seen as dark spherical parts in particle shown in the lower row on the left side in ). The particles of the second and the third type had clearly different nanostructures; in the third type of particles the typical nanostructure of soot particles (see, e.g., Happonen et al. Citation2010) can be seen (see Figures SI4 and SI5).
Images of particles on TEM samples collected in “FGD+FF on” situation () show three types of particles: relatively small particles with diameter of 100–200 nm and two types of relatively large 800–1800 nm particles. First, some of these larger particles seem to have porous surface and irregular shape (, top row on the left side). The EDS measurements revealed that these particles consisted mainly of Ca and S, but also small amounts of Ti, Si, and Mg. These porous particles had collected smaller spherical inorganic particles on their surfaces, similar to the first type of particles seen in (top row on left side). Second, the other type of larger particles (800–1400 nm in diameter in , top row on the right side) had similar chemical composition as the spherical (large) particles in “FGD+FF off” situation (, top row on left side). These particles contained Si, Al, Mg, Ti, Fe, S, and Ca. These particles had also smaller particles with agglomerated structure attached on their surfaces. It can be assumed that these particles were formed by coagulation of the large primary particles and smaller agglomerates (consisting of Si, Al, Ca, P, S, Mg, Cu, K, Ti, and Fe) seen in the “FGD+FF off” situation. These primary-particle agglomerates as well as primary particles (100–200 nm) were also found on their own on the TEM grids (, lower row on right side). In general, the TEM images indicated that the flue gas contained relatively large particles in the “FGD+FF on” situation, which could not be measured with the SMPS. However, the particle number size distribution and especially the particle volume size distribution measured by the SMPS indicated that there were also larger particles in the flue gas.
As presented in the experimental section, measurements were made also in the atmosphere for the diluting flue gas. These were made with a helicopter equipped with aerosol instruments. In the data analysis, the atmospheric dilution profiles of the studied pollutants were calculated using the GPS coordinates to determine the distance between the measurement point (helicopter position) and the stack. The atmospheric age of the flue gas was calculated using the distance and the wind speed. Each measured concentration of CO2, SO2, and the ΔNtot (the background concentration subtracted from the measured Ntot) was further classified to 5-sec age intervals. The resulting values are shown in . The median values of SO2, CO2, and ΔNtot concentrations on each 5-sec time interval were plotted on the y-axis. The CO2 and SO2 concentrations in parts per million (ppm) and parts per billion (ppb), respectively, are shown on the left y-axis and the ΔNtot (cm−3) on the right y-axis. In the calculation of the ΔNtot (cm−3), the background particle number concentration was determined from the sampling points, which were outside the plume area marked in Figure S1. The median background concentration of particle number concentration in the atmosphere was 7330 cm−3 for “FGD+FF on” and 15,700 cm−3 for “FGD+FF off.”
Figure 3. Concentration of CO2 (black line, ppm, y-axis on the left), concentration of SO2 (blue line, ppb, y-axis on the left), and ΔNtot (red line, 1 cm−3, y-axis on the right) in flue-gas plume diluting in the atmosphere as a function of flue-gas plume age after the emission from stack. ΔNtot is the particle number concentration in the flue-gas plume after subtracting the background particle number concentration from measured values. The gray vertical lines present the 2-km distance from the stack. A mixture of 10.5% industrial pellets and coal was used as a fuel in the experiment.
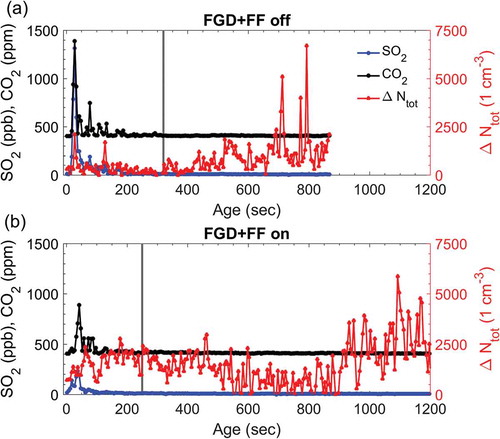
In the “FGD+FF off” situation, the dilution profiles of gaseous CO2 and SO2 and the particle number concentration (ΔNtot) can be clearly seen in . All the SO2, CO2, and ΔNtot peaked near the stack. The dilution of gaseous compounds to the background concentrations took approximately 200 sec, which corresponds to distance less than 2 km from the stack. The dilution profile of the ΔNtot was relatively similar than that of gaseous compounds; the ΔNtot peaked near the flue-gas stack and diluted in 200 sec to the background concentrations. In the “FGD+FF on” situation the dilution profiles of gaseous compounds (CO2 and SO2) were relatively similar to those in the “FGD+FF off” situation; clear concentration peaks were measured close to the stack, and after 200 sec the concentrations were at the background level. However, the profile of ΔNtot differed significantly from the “FGD+FF off” situation during the first 500 sec of dilution. First, no significant or separate peak was observed in the beginning of dilution, and second, the ΔNtot remained at higher concentrations for 0–500 sec after the flue gas entered to the atmosphere. Finally, in both of the flue-gas cleaning situations, the particle number concentration increased at the most aged part of the flue gas plume, for “FGD+FF off” after 400 sec and in the “FGD+FF on” situation after 800 sec of atmospheric dilution.
During the data analysis, it was observed that a regional atmospheric nucleation event might affect the results in the “FGD+FF off” situation. The regional nucleation event increased the particle concentrations after noon. The event was observed, for example, at Kumpula SMEAR III station (Junninen et al. Citation2009) during the “FGD+FF off” measurement. Despite the nucleation event, the ΔNtot was above zero concentration,and thus above the background particle number concentration, which included the particles from the regional nucleation event.
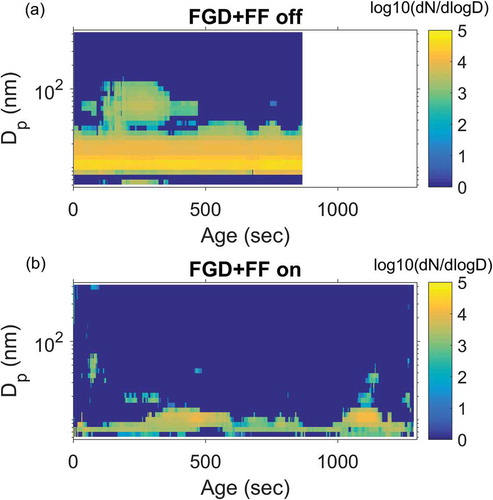
In the “FGD+FF off” situation, the atmospheric dilution of the flue-gas plume could be also observed from the particle number size distribution (see , plume ages up to 400 sec) for particles around 40–100 nm in diameter. The measurement was made with the EEPS installed into the helicopter. Elevated concentrations of these particles with mean diameter of approximately 80 nm corresponded relatively well to the mean particle diameter measured with the SMPS for the flue gas sampled from the stack; see . Additionally, a significant number concentration of particles smaller than 30 nm in diameter was observed in the diluting flue-gas plume. For the “FGD+FF off” situation, the number concentration of particles below 30 nm in diameter was constant throughout the measurement, which indicates that these particles belonged to the regional background aerosol. Instead, during the “FGD+FF on” situation no such high nanoparticle concentrations were measured in the background. Therefore, it can be assumed that the observed nanoparticles existed due to the emissions from the power plant. However, it should be keep in mind that the EEPS can suffer from an increased electrical noise in the electrometers that are used to detect particles, especially in small particle sizes and particularly in helicopter measurements where the device is exposed to vibration. Due to this reason, any direct comparison between the Ntot measured by the CPC and total particle number concentration from size distributions measured with EEPS is not seen to be useful (Levin et al. Citation2015).
Figure 4. Median particle number size distribution measured from the atmosphere with a helicopter in “FGD+FF off/on” (upper/ lower) situations. The measurement data were classified to 5-sec time intervals based on the plume age. Measurements were made with EEPS. The mixture of industrial pellets and coal was used as a fuel during the experiment.
Discussion
The focus of this study was on the characterization of the emissions of a large CHP power plant fueled with a mixture of coal and wood pellets. The special focus was the characterization of flue-gas particles. The study was motivated by the need to decrease the CO2 emissions of energy production, which has resulted, in general, in the need to utilize biomass in existing power plant infrastructures. The study is a continuation especially to the study of coal combustion emissions, presented in Mylläri et al. (Citation2016), and the study of the effect of fuels on aerosols in boiler conditions, presented in Mylläri et al. (Citation2017).
This study has showed that the flue gas aerosol from co-combustion of coal and wood pellets contains various types of particles. The particles have a size distribution covering a large particle size range. In addition to particle size, also other characteristics of particles vary significantly and, as indicated by TEM images of particles, they can be also internally mixed with each other. The flue-gas aerosol was significantly affected by the flue-gas cleaning system.
The complexity of the particle characteristics makes it difficult to evaluate all the atmospheric effects of the flue-gas aerosol and to evaluate the effects of fuel changes. If the results of this study are compared to the coal combustion study of Mylläri et al. (Citation2016), it can be concluded that the 10.5% share of industrial pellets mixed with coal could lower the power plant’s particle number and particle mass emissions when the power plant uses ESPs to clean its flue gases. Based on the data presented by Mylläri et al. (Citation2016) and by using the CO2-release factor of 93.3 g CO2 MJ−1 for coal combustion (Statistics Finland, Fuel Classification Citation2017), for the coal combustion the particle number emission factor was 8.6 × 10¹² MJ−1 and the particle mass emission factor was 90 mg MJ−1 in the “FGD+FF off” situation. Both are significantly higher than the emission factors measured for the combustion of the mixture industrial wood pellets and coal in this study. Thus, the co-combustion of biomass and coal can have positive effects on the emissions, at least from an air quality viewpoint. However, from a particle number and mass emission point of view, the flue-gas cleaning system has even higher influence on the emissions.
Black carbon (BC) concentrations of the flue-gas aerosol can be seen as important with respect of the climatic effects of flue gas. This study indicated that in the case of co-combustion of industrial pellets and coal, the flue-gas aerosol contained elevated concentrations of BC. These concentrations, however, depended on the flue-gas cleaning, so that they were approximately 0.03 μg m−3 in the “FGD+FF on” situation and 25.5 μg m−3 in the “FGD+FF off” situation. Thus, during the normal operation of the power plant, that is, in the “FGD+FF on” situation, the measured BC concentrations were relatively low. To compare, the BC concentrations from the exhaust of heavy duty buses have been measured to be between 1 and 55 μg m−3, depending on the fuel and vehicle (Saarikoski et al. Citation2017). In Helsinki, Finland, the street-level background concentration of the BC is around 1 μg m−3 and on road 2.9–5.5 μg m−3 (Pirjola et al. Citation2017). Thus, the BC concentrations at the street level are similar to the BC concentration level in the stack in “FGD+FF on” situation. The result highlights the important role of flue-gas cleaning in the BC emissions.
In the TEM analysis part of the study, we observed particles with a large particle size range and different characteristics. Regarding the BC emissions discussed earlier, we observed soot particles consisting of agglomerated spherical primary particles. The nanostructure of these primary particles was clearly similar to the nanostructure of diesel exhaust particles (see, e.g., Happonen et al. Citation2010). In particle size distribution, these soot mode particles contributed especially in particles sizes above 100 nm. Based on the boiler aerosol study (Mylläri et al. Citation2017), the addition of the pellets increases particle concentrations especially in this size. Thus, in general, results indicate that agglomerated soot particles cannot be used as tracers of diesel vehicle emissions, at least in environments influenced by coal and biomass combustion power plants.
In the atmospheric measurements, the flue-gas dilution time scales for the atmospheric new particle formation were similar to those observed in Mylläri et al. (Citation2016) for 100% coal combustion; the increase in flue-gas particle number concentration was observed after 400 sec in the “FGD+FF off” situation and after 500 sec in the “FGD+FF on” situation. In principle, the difference between the “FGD+FF on” and “FGD+FF off” situations in the starting of new particle formation could be explained by the higher flue-gas SO2 concentration in the “FGD+FF off” case. This indicates, at least qualitatively, that sulfur compounds have a role in the new particle formation in the atmospheric flue-gas plume, most probably by sulfuric acid formation by atmospheric oxidation of the emitted SO2. However, our previous study (Mylläri et al. Citation2016) indicated that the new particle formation in the flue-gas plume could not be fully explained only by sulfuric acid nucleation.
Conclusion
In this study the focus was in the atmospheric emissions of particles and gaseous compounds from a real-scale power plant. Emissions from co-combustion of wood pellets and coal were studied with the measurements made at the power plant stack and in the atmosphere. The results from stack measurements showed that the flue-gas cleaning devices work efficiently for SO2, particle number concentration, and dust with the studied fuel mixture.
This study showed that the aerosol emitted from power plant fueled with wood pellets and coal is a relatively complicated mixture of internally and externally mixed particles. This aerosol is strongly affected by flue-gas cleaning and atmospheric processes. Importantly, the study showed elevated concentrations of black carbon (BC) in the flue gas, associated with the agglomerated soot particles found in the TEM analyses. Due to the climatic effects of BC, this observation should be taken into account when utilizing biofuels in existing power production facilities. The mean diameter of all particles in particle number size distributions was found to be between 72 and 75 nm in both of the flue-gas cleaning situations. The particles consisted mainly of inorganic matter, which was observed from the EDS analysis made together with the transmission electron microscopy imaging for the particles.
The co-combustion of wood pellets and coal resulted in atmospheric flue-gas plume concentrations and phenomena relatively similar to those previously observed for coal combustion. Especially, the observation that the total particle number concentration started to increase at 400–800 sec after the emission should be taken into account when the emissions are evaluated on a regional level.
Supplemental Material
Download PDF (489.8 KB)Acknowledgment
The study was conducted in the MMEA WP 4.5.2. of Cleen Ltd., funded by Tekes (the Finnish Funding Agency for Technology and Innovation). The authors acknowledge Aleksi Malinen for measurement help. F.M. acknowledges the TUT Graduate School, KAUTE Foundation, and TES Foundation for financial support. E.A., V.V., and E.O. acknowledge the support of the Academy of Finland Centre of Excellence program (project number 307331). This work was supported by KAUTE-Säätiö; Tekniikan Edistämissäätiö; Academy of Finland [307331] and Strategic Research Council [314319]; and TUT Graduate School.
Supplemental data for this paper can be accessed on the publisher’s website.
Additional information
Funding
Notes on contributors
Fanni Mylläri
Fanni Mylläri is a doctoral student at the Tampere University of Technology (TUT).
Liisa Pirjola
Liisa Pirjola works as a project leader at the Metropolia University of Applied Sciences.
Heikki Lihavainen
Heikki Lihavainen is a former head of a unit at the Finnish Meteorological Institute (FMI) and is now a director at SIOS, theSvalbard Integrated Arctic Earth Observing System.
Eija Asmi
Eija Asmi was a group leader at FMI and is also working at Servicio Meteorológico Nacional in Buenos Aires, Argentina.
Erkka Saukko
Erkka Saukko was a doctoral student at TUT and now is a senior research and development (R&D) engineer at Pegasor.
Tuomas Laurila
Tuomas Laurila is a research scientist at FMI.
Ville Vakkari
Ville Vakkari is a researcher at FMI.
Ewan O’Connor
Ewan O’Connor is a tenure-track professor at FMI.
Jani Rautiainen
Jani Rautiainen is a process engineer at Helen Oy.
Anna Häyrinen
Anna Häyrinen is an air quality engineer at Helen Oy.
Ville Niemelä
Ville Niemelä is a Director, Research and Development, and Manufacturing in Dekati Ltd.
Joni Maunula
Joni Maunula is a product engineer at Valmet Technologies.
Risto Hillamo
Risto Hillamo was a research professor at FMI during MMEA project.
Jorma Keskinen
Jorma Keskinen is a professor at the Tampere University of Technology (TUT).
Topi Rönkkö
Topi Rönkkö is a associate professor at the Tampere University of Technology (TUT).
Related Research Data
References
- Al-Naiema, I., A. D. Estillore, I. A. Mudunkotuwa, V. H. Grassian, and E. A. Stone. 2015. Impacts of co-firing biomass on emissions of particulate matter to the atmosphere. Fuel 162 (December):111–120. doi:10.1016/j.fuel.2015.08.054.
- Colechin, M. 2005. Best practice brochure : Co- firing of biomass (main report). no. May.
- Frey, A. K., K. Saarnio, H. Lamberg, F. Mylläri, P. Karjalainen, K. Teinilä, S. Carbone, et al. 2014. Optical and chemical characterization of aerosols emitted from coal, heavy and light fuel oil, and small-scale wood combustion. Environ. Sci. Technol. 48 (1):827–836. doi:10.1021/es4028698.
- Hansen, P. F. B., K. H. Andersen, K. Wieck-Hansen, P. Overgaard, I. Rasmussen, F. J. Frandsen, L. A. Hansen, and K. Dam-Johansen. 1998. Co-firing straw and coal in a 150-MWe utility boiler: In situ measurements. Fuel Process. Technol. 54 (1–3):207–225. doi:10.1016/S0378-3820(97)00070-2.
- Happonen, M., M. E. Tero Lähde, T. S. Messing, L. Martti Larmi, R. Wallenberg, A. Virtanen, and J. Keskinen. 2010. The comparison of particle oxidation and surface structure of diesel soot particles between fossil fuel and novel renewable diesel fuel. Fuel 89 (12):4008–4013. doi:10.1016/j.fuel.2010.06.006.
- Heinzel, T., V. Siegle, H. Spliethoff, and K. R. G. Hein. 1998. Investigation of slagging in pulverized fuel co-combustion of biomass and coal at a pilot-scale test facility. Fuel Process. Technol. 54:109–125. doi:10.1016/S0378-3820(97)00063-5.
- Jiménez, S., and J. Ballester. 2004. Formation and emission of submicron particles in pulverized olive residue (Orujillo) combustion. Aerosol Sci. Technol. 38 (7):707–723. doi:10.1080/02786820490490092.
- Junkermann, W., and J. M. Hacker. 2015. Ultrafine particles over Eastern Australia: An airborne survey. Tellus, Ser. B 67 (1):1–18. doi:10.3402/tellusb.v67.25308.
- Junninen, H., A. Lauri, P. Keronen, P. Aalto, V. Hiltunen, P. Hari, and M. Kulmala. 2009. Smart-SMEAR: On-line data exploration and visualization tool for SMEAR stations. Boreal Environ. Res. 14 (4):447–457.
- Keskinen, J., V. Pietarinen, and M. Lehtimäki. 1992. Electrical low pressure impactor. J. Aerosol. Sci. 23 (4):353–360. doi:10.1016/0021-8502(92)90004-F.
- Kuuluvainen, H., P. Karjalainen, C. J. E. Bajamundi, J. Maunula, P. Vainikka, J. Roppo, J. Keskinen, and R. Topi. 2015. Physical properties of aerosol particles measured from a bubbling fluidized bed boiler. Fuel 139:144–153. Elsevier Ltd. doi:10.1016/j.fuel.2014.08.048.
- Levin, M., A. Gudmundsson, J. H. Pagels, M. Fierz, K. Mølhave, J. Löndahl, K. A. Jensen, and I. K. Koponen. 2015. Limitations in the use of unipolar charging for electrical mobility sizing instruments: A study of the fast mobility particle sizer. Aerosol Sci. Technol. 49 (8):556–565. doi:10.1080/02786826.2015.1052039.
- Linak, W. P., C. Andrew Miller, W. S. Seames, and J. O. L. Wendt. 2002. On trimodal particle size distributions in fly ash from pulverized-coal combustion. Pulverized-coal combustion. 29:441–447.
- Lonsdale, C. R., R. G. Stevens, C. A. Brock, P. A. Makar, E. M. Knipping, and J. R. Pierce. 2012. The effect of coal-fired power-plant SO2 and NOx control technologies on aerosol nucleation in the source plumes. Atmospheric Chem. Phys. 12 (23):11519–11531. doi:10.5194/acp-12-11519-2012.
- Madanayake, B. N., S. Gan, C. Eastwick, and H. K. Ng. 2017. Biomass as an energy source in coal co-firing and its feasibility enhancement via pre-treatment techniques. Fuel Process. Technol. 159:287–305. doi:10.1016/j.fuproc.2017.01.029.
- Mikkanen, P., and M. Moisio. 2001. Sampling method for particle measurements of vehicle exhaust. 724:1–6. Society of Automotive Engineers Inc.
- Mirme, A. 1994. Electric aerosol spectrometry. Ph.D. Thesis from University of Tartu.
- Mylläri, F., E. Asmi, T. Anttila, E. Saukko, V. Vakkari, L. Pirjola, R. Hillamo, et al. 2016. New particle formation in the fresh flue-gas plume from a coal-fired power plant: effect of flue-gas cleaning. Atmospheric Chem. Phys. 16 (11):7485–7496. doi:10.5194/acp-16-7485-2016.
- Mylläri, F., P. Karjalainen, R. Taipale, P. Aalto, A. Häyrinen, J. Rautiainen, L. Pirjola, R. Hillamo, J. Keskinen, and T. Rönkkö. 2017. Physical and chemical characteristics of flue-gas particles in a large pulverized fuel-fired power plant boiler during co-combustion of coal and wood pellets. Combust. Flame 176. doi:10.1016/j.combustflame.2016.10.027.
- Nutalapati, D., R. Gupta, B. Moghtaderi, and T. F. Wall. 2007. Assessing slagging and fouling during biomass combustion: A thermodynamic approach allowing for alkali/ash reactions. Fuel Process. Technol. 88 (11–12):1044–1052. doi:10.1016/j.fuproc.2007.06.022.
- Piotrowska, P., A. Grimm, N. Skoglund, C. Boman, M. Öhman, M. Zevenhoven, D. Boström, and M. Hupa. 2012. Fluidized-bed combustion of mixtures of rapeseed cake and bark: The resulting bed agglomeration characteristics. Energy Fuels 26 (4):2028–2037. doi:10.1021/ef300130e.
- Pirjola, L., J. V. Niemi, S. Saarikoski, M. Aurela, J. Enroth, S. Carbone, K. Saarnio, et al. 2017. Physical and chemical characterization of urban winter-time aerosols by mobile measurements in Helsinki, Finland. Atmos. Environ. 158:60–75. doi:10.1016/j.atmosenv.2017.03.028.
- Pisa, I., and G. Lazaroiu. 2012. Influence of co-combustion of coal/biomass on the corrosion. Fuel Process. Technol. 104:356–364. doi:10.1016/j.fuproc.2012.06.009.
- Rath, J., S. Kay, D. Bielunis, R. Pellage, and J. Rath. 2010. Technical publication: Co-milling and suspension co-firing of wood pellets with bituminous coal.
- Ristimäki, J., A. Virtanen, M. Marjamäki, A. Rostedt, and J. Keskinen. 2002. On-line measurement of size distribution and effective density of submicron aerosol particles. J. Aerosol. Sci. 33 (11):1541–1557. doi:10.1016/S0021-8502(02)00106-4.
- Saarikoski, S., H. Timonen, S. Carbone, H. Kuuluvainen, J. V. Niemi, A. Kousa, T. Rönkkö, D. Worsnop, R. Hillamo, and L. Pirjola. 2017. Investigating the chemical species in submicron particles emitted by city buses. Aerosol Sci. Technol. 51(3):317–329. Taylor & Francis. doi:10.1080/02786826.2016.1261992.
- Saarnio, K., J. V. Anna Frey, H. T. Niemi, T. Rönkkö, P. Karjalainen, M. Vestenius, et al. 2014. Chemical composition and size of particles in emissions of a coal-fired power plant with flue gas desulfurization. J. Aerosol. Sci. 73:14–26. doi:10.1016/j.jaerosci.2014.03.004.
- Savolainen, K. 2003. Co-firing of biomass in coal-fired utility boilers. Appl. Energy. 74:369–381. doi:10.1016/S0306-2619(02)00193-9.
- Sevonius, C., P. Yrjäs, and M. Hupa. 2014. Defluidization of a quartz bed – laboratory experiments with potassium salts. Fuel 127 (July):161–168. doi:10.1016/j.fuel.2013.10.047.
- Statistics Finland, Fuel Classification. 2017. Accessed November 29, 2017. http://www.stat.fi/polttoaineluokitus.
- Stevens, R. G., and J. R. Pierce. 2013. A parameterization of sub-grid particle formation in sulfur-rich plumes for global- and regional-scale models. Atmospheric Chem. Phys. 13 (23):12117–12133. doi:10.5194/acp-13-12117-2013.
- Stevens, R. G., J. R. Pierce, C. A. Brock, M. K. Reed, J. H. Crawford, J. S. Holloway, T. B. Ryerson, L. G. Huey, and J. B. Nowak. 2012. Nucleation and growth of sulfate aerosol in coal-fired power plant plumes: Sensitivity to background aerosol and meteorology. Atmospheric Chem. Phys. 12 (1):189–206. doi:10.5194/acp-12-189-2012.
- Strzalka, R., D. Schneider, and U. Eicker. 2017. Current status of bioenergy technologies in Germany. Renew. Sustain. Energy Rev. 72:801–820. doi:10.1016/j.rser.2017.01.091.
- Tolvanen, H., T. Keipi, and R. Raiko. 2016. A study on raw, torrefied, and steam-exploded wood: fine grinding, drop-tube reactor combustion tests in N2/O2 and CO2/O2 atmospheres, particle geometry analysis, and numerical kinetics modeling. Fuel 176:153–164. doi:10.1016/j.fuel.2016.02.071.
- Vainio, E., P. Yrjäs, M. Zevenhoven, A. Brink, T. Lauren, M. Hupa, T. Kajolinna, and H. Vesala. 2013. The fate of chlorine, sulfur, and potassium during co-combustion of bark, sludge, and solid recovered fuel in an industrial scale BFB boiler. Fuel Process. Technol. 105:59–68. Elsevier B.V. doi:10.1016/j.fuproc.2011.08.021.
- Verma, M., C. Loha, A. N. Sinha, and P. K. Chatterjee. 2017. Drying of biomass for utilising in co-firing with coal and its impact on environment – a review. Renew. Sustain. Energy Rev. 71 (May):732–741. doi:10.1016/j.rser.2016.12.101.
- Wang, S. C., and R. C. Flagan. 1990. Scanning electrical mobility spectrometer. Aerosol Sci. Technol. 13 (2):230–240. doi:10.1080/02786829008959441.
- Yi, H., J. Hao, L. Duan, X. Tang, P. Ning, and L. Xinghua. 2008. Fine particle and trace element emissions from an anthracite coal-fired power plant equipped with a Bag-House in China. Fuel 87 (10–11):2050–2057. doi:10.1016/j.fuel.2007.10.009.
- Ylätalo, S. I., and J. Hautanen. 1998. Electrostatic precipitator penetration function for pulverized coal combustion. Aerosol Sci. Technol. 29 (1):17–30. doi:10.1080/02786829808965547.