
 ?Mathematical formulae have been encoded as MathML and are displayed in this HTML version using MathJax in order to improve their display. Uncheck the box to turn MathJax off. This feature requires Javascript. Click on a formula to zoom.
ABSTRACT
The type of control at intersections has a major effect on the operation of any urban corridor. Different predefined procedures are available to calculate some of the main operational characteristics, such as capacity, delay, and level of service, in order to select the best type of control. However, there are other important factors that affect major arterials operational characteristics, factors that are not fully addressed, such as the impact of emissions. In this study, a microscopic simulation approach using VISSIM and MOVES was developed to assess the environmental effect of converting four three-lane roundabouts to signalized intersections along a heavily congested urban corridor in Qatar. A decision was made to switch all roundabouts to traffic signals for better operations. Preliminary results indicated that the signal control outperformed the roundabout in the range of 37% to 43% reduction in emissions. A more detailed analysis revealed that roundabout corridor operations’ effects on emission rates are divergent from those of signalized corridors, particularly upstream and downstream of the intersections. Immediate roundabout upstream approaches are driver behavior dependent, characterized by substantial coasting at lower speeds and subsequent re-accelerating with less idling, described as acceleration events, which resulted in high emission rates, while signalized corridors are signal timing dependent, characterized by ample idling with less coasting and re-acceleration, resulting in reduced emission rates. The results also revealed that there was no significant difference between emission rates in the vicinity of the two types of control. Both recorded nearly the same emission rate.
Implications: A microscopic simulation approach using VISSIM and MOVES was developed to assess the environmental effect of converting four three-lane roundabouts to signalized intersections along a heavily congested urban corridor in Doha, Qatar. Intersection geometries along with the control type have significant impact on emission rates and play a major role in assessing environmental impacts. US EPA MOVES was calibrated to Qatar conditions which can be used to estimate emission factors and quantify vehicular emissions along other corridors in the country. The results can also be beneficial for other countries within the region.
Introduction
Motorized vehicles are the main source of air pollution. Nonmotorized sections of a road have much less pollution than motorized sections (Ming et al. Citation2018). Traffic-related air pollution varies with the time of the day, wind direction, and traffic volumes (Chaichan, Kazem, and Abed Citation2018; Ming et al. Citation2017). The exposure to this air pollution affects drivers on the road, in addition to pedestrians and cyclists on the side of the road (Dons et al. Citation2012), and can cause major health problems among adults and children (Khreis et al. Citation2017). Some countries have even converted the central part of a city into a traffic-restricted zone in order to reduce air pollution (Shahbazi et al. Citation2017). Qatar, a rapidly growing, rich country in the Middle East, has dramatically expanded and rebuilt the transportation network in the country during the last few years. Previous research showed that the expansion of road networks encourages the use of more motorized vehicles and leads to more emissions (Hofer, Jäger, and Füllsack Citation2018). Consequently, Qatar is currently among the list of countries with the highest numbers of motor vehicles per capita. Furthermore, vehicle exhaust emissions have become one of the most important issues facing the country, especially considering that Qatar lacks forests and green areas to offset the effects of greenhouse gas emission. The CO2 emissions from transport almost quadrupled over 10 years, from 2000 (2.4 million metric tons) to 2010 (9.2 million metric tons) (Planning Citation2011).
One of the factors that affect pollution along roadways is the type of control at intersections (Fernandes, Coelho, and Rouphail Citation2017). For years, the main type of traffic control at major intersections in Qatar was roundabouts. The massive increase in the number of vehicles caused law enforcement personnel to regulate traffic on roundabouts during peak hours. Due to the shortage of enforcement personnel and worsening of traffic conditions, many roundabouts were converted to traffic signals in the recent years. The main objective of this study is to assess and quantify the effect of changing the traffic control system on vehicles’ emission of greenhouse gas (CO2), as well as other criteria pollutants such as carbon monoxide (CO) and nitrogen oxides (NOx). Two different scenarios are tested using the microscopic traffic simulation software VISSIM9 with the emissions integrated into the latest Environmental Protection Agency (EPA) Motor Vehicle Emission Simulator (MOVES2014a) model. The first scenario represents the before conditions of a major urban corridor with four roundabouts, and the second scenario represents the after conditions after replacing all four roundabouts with signalized intersections.
Literature review
Since vehicle emission is a measure of the operational efficiency of intersections, many studies investigated vehicle emissions for different types of intersections. Several studies confirmed that signalized intersection produces minimal emission compared with other intersection types for the highest traffic demand (Coelho, Farias, and Rouphail Citation2006; Mustafa and Vougias Citation1993; Vlahos et al. Citation2008). However, a signalized intersection can produce up to 50% more emissions than unsignalized intersection (Mustafa and Vougias Citation1993). Similarly, Ahn et al. (Ahn, Kronprasert, and Rakha Citation2009) concluded that signalized intersections had lower total CO emissions compared to roundabouts, followed by stop-controlled intersections. Furthermore, they found an increase in emissions with an increase in demand. Ranjitkar et al. (Ranjitkar, Shahin, and Shirwali Citation2014) found similar results with regard to the direct relationship between the total amount of emissions and the total intersection demand at a signalized intersection.
Várhelyi (Citation2002) and Mandavilli et al. (Mandavilli, Rys, and Russell Citation2008) didn’t reach the same conclusions in their emission studies at intersections. With a car following method, Várhelyi (Citation2002) found that replacing a signalized intersection with a roundabout in Sweden reduced fuel consumption and the total amount of emissions per day compared to the increase in emissions produced by replacing several yield-controlled intersections. Likewise, Mandavilli et al. (Mandavilli, Rys, and Russell Citation2008) calculated the rate of emission of HC, CO, NOx, and CO2 using SIDRA’s measures of effectiveness tool and concluded that roundabouts produced lower vehicular emissions compared to a stop-controlled intersection.
Consequently, Pandian et al. (Pandian, Gokhale, and Ghoshal Citation2009) explained how the rate of emission was a cumulative effect of not just traffic demand and type of intersection, but also the type of vehicle and the speed of the vehicles as they approach and leave an intersection. They also found greater emissions with increasing traffic density, similar to Ahn et al. (Ahn, Kronprasert, and Rakha Citation2009) and Ranjitkar et al. (Ranjitkar, Shahin, and Shirwali Citation2014). Additionally, like Várhelyi (Citation2002) and Mandavilli et al. (Mandavilli, Rys, and Russell Citation2008), they also observed lesser emissions at roundabouts.
Hallmark et al. (Citation2011) measured emissions along two uncongested corridors. They noticed that although roundabouts reduced delay time or stops by slowing down all entering vehicles, they also more likely cause increases in emission as opposed to a signalized intersection that delayed or stopped only a portion of the traffic. However, like Pandian et al. (Pandian, Gokhale, and Ghoshal Citation2009), they thought their study was inconclusive with regard to benefits of using a roundabout since quality at an intersection depends on a number of complex factors. They attributed any change in emissions to driver behavior rather than the intersection type.
In a recent study, Salamati et al. (Citation2015) proposed an empirically based macroscopic method to estimate pollutant emissions generated at an intersection based on the concept of vehicle-specific power for different vehicle classes such as passenger cars and trucks. They analyzed 1,980 vehicle trajectories collected at signalized intersections and roundabouts in six different states in the United States. Results showed that when an intersection is oversaturated (when d/c > 1), the amount of produced emissions increases gradually, whereas,emissions at signalized intersections increase rapidly. Thus, under congested conditions, roundabouts outperform signalized intersections.
In summary, studies quantifying the environmental performance of corridor roundabouts are still in their infancy. Limited studies investigated the difference in emissions between signalized intersections and roundabouts, and most of them focused on one- or two-lane roundabouts. This study investigates a major corridor with major roundabouts (three circulating lanes). Furthermore, this is one of the early efforts to conduct this type of environmental analysis using real-life before and after data, especially in this region. Moreover, this is an attempt to calibrate MOVES to unique conditions in a unique environment of this region. The results can be beneficial for Qatar and other countries within the region.
Integration of microscopic traffic simulation and MOVES emission models
In this study, the effect of the traffic control system on greenhouse gas vehicle emission on a major urban corridor is evaluated using the microscopic traffic simulation software package VISSIM integrated with MOVES emission software and utilizing VISSIM Moves Integration Software (VIMIS) developed by Abou-Senna et al. (Abou-Senna and Radwan Citation2013). VIMIS has been developed on the basis of converting vehicle trajectory data (vehicle weight, type, speed, and acceleration) for every second of the simulation into operating mode (Opmode) distribution. Operating mode distributions define the amount of travel time spent in various operating modes, including, braking, idling, coasting, and cruising/accelerating within various speed ranges and at various ranges of vehicle specific power (VSP). The MOVES emission rates are a direct function of VSP, a measure that has been shown to have a better correlation with emissions than average vehicle speeds, and users can input locally specific VSP distributions based on the exclusive characteristics of the modeled system calibrated in VISSIM to local driving conditions.
MOVES calculates emissions by calculating a weighted average of emissions by operating mode. For running exhaust emissions, the operating modes are defined by vehicle specific power or the related concept, scaled tractive power (STP). Both VSP and STP are calculated based on a vehicle’s speed and acceleration, but they differ in how they are scaled. The VSP, as shown in eq 1, is used for light-duty vehicles (source types 11–32), while the STP, as shown in eq 2, is used for heavy-duty vehicles (source types 41–62) (Agency Citation2010):
where VSP is vehicle specific power (kW/ton), STP is scaled tractive power (kW/ton), M is vehicle mass (metric tons), A is a rolling term (kw-sec/m), B is a rotating term (kw-sec2/m2), C is the aerodynamic drag term (kw-sec3/m3), v is instantaneous vehicle velocity (m/sec), a is Instantaneous vehicle acceleration (m/sec2), is road grade (fraction), and F is fixed mass factor.
Therefore, the simulated vehicle driving cycle output data from VISSIM was input into the MOVES model based on specific project-level traffic conditions to calculate carbon monoxide (CO), nitrogen oxides (NOx), and carbon dioxide (CO2). shows a simple schematic diagram of the integration process.
Figure 1. VISSIM MOVES integration process.
Data collection
Al Corniche Street, a busy urban corridor of 4.35 km length, was selected to be analyzed in this study. It is located in the downtown area of the city of Doha and experiences high traffic volumes throughout the day and recurring congestion during the peak hours. The corridor is a six-lane divided urban arterial, oriented along the north–south direction with four major intersections, and 80 km per hour (50 mph) posted speed limit, serving commuters, commercial, and recreational traffic. Turning movement count data for the roundabouts (before condition) were obtained from the Ministry of Transport dated April 2013 for the AM, midday (MD), and PM peak hours. All four roundabouts had three circulating lanes. Traffic counts for the signalized intersections (after condition) were also obtained. However, the counts didn’t change much due to the fact that the corridor is operating at capacity, especially during the AM peak hour from 7:00 a.m. to 8:00 a.m. in the northbound direction, as shown in . There is also very high directionality in the corridor as seen from the southbound traffic volumes.
Figure 2. Turning movement count data for the corridor.
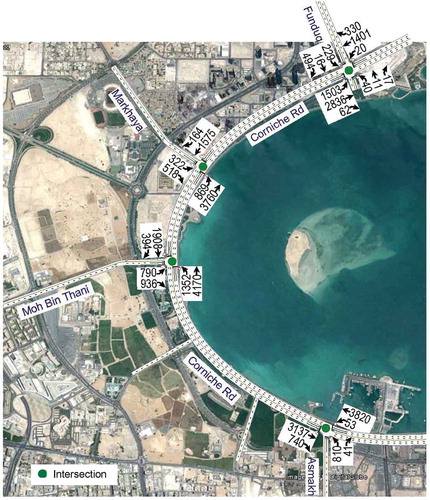
Signal phasing and timing data were obtained from the maintaining agency. However, signals were optimized using the Synchro software. Traffic composition consisted of 98% gasoline private passenger cars and 2.0% diesel buses. Heavy-duty trucks are not permitted to use this corridor. The intersections’ reconstruction was completed by early 2014. For analysis purposes, the intersections and corridor segments are labeled and numbered in . It should be noted that for the intersections (after conditions), the roadway segments are divided into three links: upstream of the intersection approach link (left and through traffic combined), approach link upstream of the stop bar (left and through traffic separated with left turn storage bays), and the intersection link (downstream of the stop bar).
Table 1. Intersections and roadway segments in the before and after conditions.
Calibration and validation process
VISSIM model
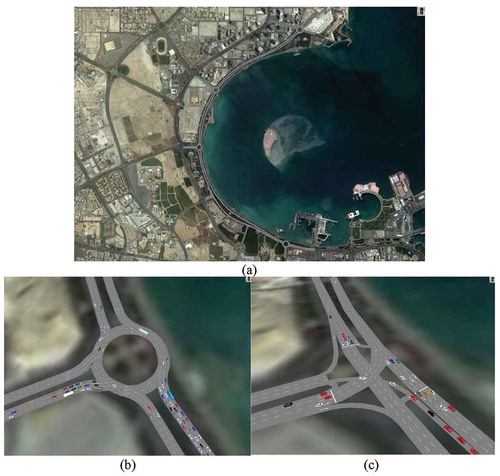
The corridor was modeled in detail using the latest VISSIM 9 software and overlaid on aerial maps. The roadway network included the number of lanes, lane configuration, speed distributions, and geometry of the roadway links to replicate the before and after conditions. Traffic regulations like priority rules and conflict areas for roundabouts and signal control and turning speed restrictions were modeled realistically in the model in the before and after cases, respectively. The second major input was the traffic demand. As can be seen in , the roadway network for Al Corniche Street is modeled in the before case for the four intersections as roundabouts and as signalized intersections in the after case. also shows screen shots for both cases.
Figure 3. (a) VISSIM screenshot showing the corridor layout. (b and c) VISSIM screenshot showing (b) the before case (roundabout) and (c) the after case (signalized intersection).
An important factor in the calibration process was the replication of how law enforcement personnel regulated the roundabouts during the peak hours. The AM southbound traffic is not heavy, thus providing more gaps to the eastbound traffic on the side streets, which was impeding the throughput on the mainline. Therefore, the law enforcement was impeding some of the traffic from the side streets to allow more throughput on the mainline. This condition was replicated in the VISSIM model using the priority rules by increasing the gap time and headway distance for the side streets. Another key parameter in the calibration process was the driver behavior. As can be seen from the traffic data in , the corridor throughput is way above the regular capacity of any six-lane divided urban arterial in the United States. For example, the maximum generalized peak hour directional service volume for Florida’s urbanized areas for Class I arterial is 3,020 vehicles per hour. However, segments along the corridor carry from 4,500 to 5,500 vehicles per hour in the AM peak hour, which corresponds to the capacity of uninterrupted flow highways in Florida, although the longest distance between two successive intersections/roundabouts didn’t exceed 1.15 miles. Therefore, the only difference between all the stochastic traffic factors in the transportation system that affects the roadway capacity is the aggressiveness of the driver behavior. The main driver behavior parameters were divided into car-following parameters (average standstill distance and additive and multiple parts of safety distance), lane-change parameters, gap acceptance parameters (minimum gap time and headway distance), and simulation resolution. Several trials were conducted using different driving behavior distributions along with different arrival rates and peaking characteristics until the model produced reasonable results close to existing volumes. In the roundabout case, throughput values matched 93%, and matched 98% in the signal case. Queue lengths and time-dependent throughput were validated from video data collected using Miovision video collection units (VCUs).
As mentioned earlier, second-by-second vehicle trajectory data are crucial for the emissions calculations. Therefore, the simulation was run in discrete time steps using a time step of 1 sec. After calibrating and validating the microsimulation traffic model and to account for the stochastic nature of the transportation system, 10 replications were made for each scenario using different random seed numbers. The simulation period starts at 7:00 a.m. and ends at 8:00 a.m. with a 15-min warmup period. The simulation results shown throughout this study are the average of 10 simulation runs with different random seeds.
MOVES model
MOVES can be used to estimate national-, state-, and county-level inventories of criteria air pollutants, greenhouse gas emissions, and some mobile source air toxics from highway vehicles. The MOVES model is different from previous U.S. EPA mobile source emissions models in that it was deliberately designed to work with databases that allow and facilitate the import of data specific to a user’s unique needs and for specific areas (EPA Citation2020). In an attempt to calibrate MOVES to the city of Doha, especially along the corridor, two inputs are needed for emission estimation: the emission rate, and the driving cycle data. The driving cycle represents the driving activity data that are commonly used in most studies. However, the parameters used for developing a driving cycle only represent the driving characteristics and not emission characteristics. The driving cycle represents a speed–time profile of driving characteristics in an area. It has been widely used in various studies on emissions. Numerous studies have investigated the development of driving cycles outside the United States. Hung et al. (Citation2007) used the performance value and speed-acceleration probability distribution to determine the synthesized driving cycles of light-duty vehicles for representing urban, suburban, and highway driving characteristics in Hong Kong. Nesamani and Subramanian (Citation2011) used speed-acceleration frequency distribution (SAFD) based on a global positioning system (GPS) to develop the driving cycles for intracity buses in Chennai, India. Wang et al. (Citation2008) employed the traffic factor in developing driving cycles of light-duty vehicles for 11 cities in China to reflect real-world traffic conditions.
There are two primary methods commonly employed to collect driving data for developing driving cycles: the chase car technique and the onboard measurement technique. In this study, the chase car technique was employed to collect actual vehicular speed profiles along the corridor and then was used to obtain emission factors for major vehicle types, which included passenger cars and intercity buses. This approach is physically representative of realistic traffic conditions along the corridor. The driving cycle data and speed profiles collected from the field were compared with vehicle activity data and speeds from the calibrated VISSIM model utilizing vehicle specific power (VSP) distributions.
VSP distribution is an important parameter that can resolve the chase car technique limitation because of its close relationship with driving and emission characteristics. VSP distribution includes the percent of time spent in each VSP bin. VSP distributions not only represent the driving characteristics but also are highly correlated with the vehicle emission characteristics (EPA Citation2020). Hence, in this study, VSP distribution is used to develop driving cycles that can represent both driving and emission characteristics of the corridor. The final step involved the city of Doha specific inputs to the database in MOVES, including link speeds and second-by-second operating mode distributions, vehicle fleet characteristics, age distribution, fuel composition, ambient condition, and detailed meteorology data for the month of April. MOVES project-level analysis was used to estimate emission factors that represent Qatar’s conditions.
Results
After the calibration and validation process, VIMIS software was used to integrate the vehicle trajectories data from VISSIM into MOVES operating mode distributions and inputs to estimate the corridor’s emissions. provides a comparison of the results for CO, NOx, and CO2 emissions (kg) when the MOVES analysis was conducted for the two traffic control scenarios. The results are also shown for each vehicle type (passenger car and buses) and as a total for the whole traffic fleet. For the same corridor, the two approaches resulted in total CO2 emission estimates of 8778 kg for the roundabout scenario and 4982 kg for the signals scenario, CO emission estimates of 108 kg for roundabouts and 67.5 kg for signals, and NOx emissions of 9.40 kg for roundabouts and 5.50 kg for the signals scenario.
Table 2. Emissions by control type, link, pollutant, and source type.
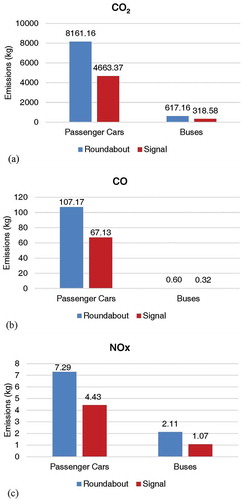
These results indicate that the signal control scenario outperformed the roundabout scenario by a margin of 37% to 43% reduction in emissions. However, a closer examination is needed to understand the difference between the two scenarios. First, at the vehicle type level, shows how each pollutant emissions vary between the two vehicle types depending on the intersection control. Given their lower fuel economy due to weight and diesel engine, buses typically have higher NOx emission rates than passenger cars. NOx are mainly created during fuel combustion, especially at high temperatures where engines burn a small amount of the nitrogen in the air along with nitrogen compounds from the vehicle fuels. Diesel engines generally produce greater amounts of NOx than gasoline engines due to their higher combustion temperatures. Therefore, when comparing the amount of NOx generated from each vehicle type and the fleet composition of 2% of buses, it is found that 2% of buses accounted for more than 22% of NOx emissions along the corridor in the roundabout scenario and 20% in the signals scenario. Similarly, total CO2 emissions are more sensitive to vehicle miles traveled (VMT), which is a function of volume and distance traveled, while CO2 emission rates are linked directly to fuel consumption, so CO2 emissions per mile go up at very low or very high speeds. That’s why 2% buses generated about 7% of CO2 emissions. On the other hand, the results show that buses generated a negligible amount of CO compared to passenger cars. Since CO results from the vehicle’s incomplete combustion of fuels, especially at low temperatures, gasoline engines emit higher amounts of CO than diesel engines, due to their lower combustion temperature compared to diesel, specifically at high speeds. Furthermore, a detailed analysis is conducted for the corridor links for the two scenarios. However, the analysis will be represented by CO2 emissions only since other pollutants showed a similar pattern.
Figure 4. (a) CO2, (b) CO, and (c) NOx emissions by vehicle and control types.
Roundabout analysis
At the corridor link level for roundabouts in the AM peak hour northbound direction, shows in greater detail the variations in CO2 total emissions as well as emission rates, respectively on a link-by-link basis. It can be seen that this variability increases at certain locations (links 2, 3, and 4) and decreases at other locations (RA1, RA2, RA3, and RA4). The results in show that the circulatory roadway emissions at the roundabout vicinity are very much lower than the mainline emissions. When examining the network, it is found that links 2, 3, and 4 are the mainline segments carrying the traffic from one roundabout to the other, including the left turn and through traffic. However, due to the limited capacity of the roundabout compared to the mainline, at the roundabout itself, circulating traffic has the right of way and is constantly moving but at a lower speed and lower capacity than the mainline. Because the corridor is operating at capacity and because the roundabouts have yield signs, the amount of throughput depends mainly on the minimum gap and follow-up time, which are typically dependent upon the driver behavior. Congestion creates a lot of friction between the vehicles and increases the driver’s aggressive behavior to enter the roundabout, thus creating a bottleneck at the roundabout entry approaches at links 2, 3, and 4.
Figure 5. (a) Total emissions variation on corridor links for roundabouts. (b) Emissions rates variation on corridor links for roundabouts.
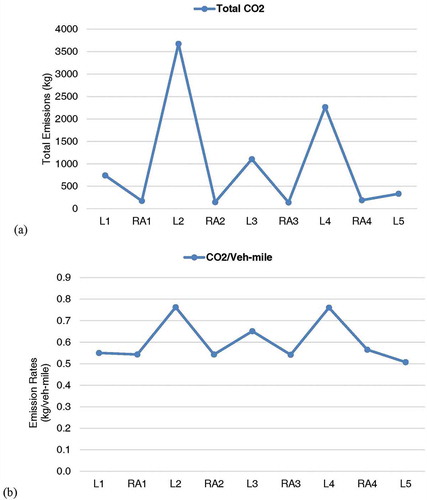
addresses the effect of VMT along with , which addresses the operating mode distribution (speeds, accelerations, and decelerations) of the CO2 emissions on the selected corridor links L2, RA2, and L3. These links were selected for comparison purposes. As shown in , CO2 emissions are the highest on link L2 when compared with the rest of the network links, although seems to show otherwise for emission rates (emissions per vehicle-mile [veh-mile]). The difference lies in the distance traveled (L2 is 1.15 miles, L3 is 0.47 miles, and L4 is 0.85 miles), as well as the traffic volume (4,187 on L2, 1,957 at RA2, and 3,611 on L3). All parameters should have the same scale for a fair comparison between them. By normalizing the emissions to vehicle-miles, it was found that L2 and L4 are the highest in emission rates (e.g., 763 grams/veh-mile CO2). However, L3 has slightly lower emission rates (651 grams/veh-mile CO2), while all the RAs emissions are the lowest (around 550 grams/veh-mile CO2).
Figure 6. Link operating mode distribution on selected links (L2, RA2, L3) for roundabouts.
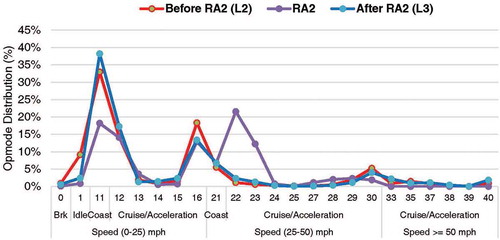
explains the emissions rate difference between L2, RA2, and L3 based on their operating mode distributions. From , L2 and L3 have almost similar operating mode distribution patterns, but L3 resulted in lower emission rates. This is attributed to the fact that L2 has a greater fraction of the vehicle activity (about 10%) in the braking and idling operating modes (0, 1), combined with coasting (33%) and re-acceleration (37%) in the low-speed modes (12–16), which are characterized by high emission factors compared to L3. Also, L2 has lower percentages of time spent at the high speed in the cruise/acceleration modes (33–40) compared to L2. Those operating mode differences translate into slight improvement in traffic operations on L3 compared to L2. Other than that, the two links show alternating values for the rest of the modes. On the other hand, RA2 has the smallest emission rates on the corridor links (550 grams/veh-mile CO2). A greater fraction of the vehicle activity is in operating modes 16–30 (moderate speed coasting and cruise/acceleration); here there are relatively higher speeds (25–50 mph) with almost 0% idling or braking. From the traffic operations standpoint, the bottleneck at the end of L2 (immediate upstream approach) and the continuous operations at RA2 act like a filter that meters the traffic downstream of RA2 traveling on L3 with smoother speeds.
Intersection analysis
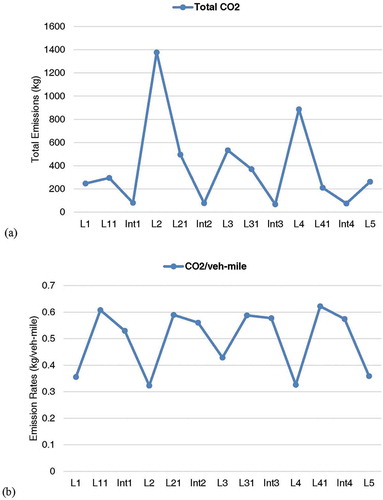
A similar examination was conducted for the links in the signalized intersection scenario. shows the total emissions and emission rates, respectively. Similar to the roundabout scenario, shows that total CO2 emissions are the highest on link L2 when compared to the rest of the network links. However, reveals otherwise for emission rates (emissions per vehicle-mile). As mentioned before, due to differences in length and throughput on each link, all parameters should have the same scale for a fair comparison. By normalizing the emissions to vehicle-miles, contrary to the roundabout, it was found that L2 and L4 have the lowest emission rates (e.g. 325 grams/vehmile CO2) among all corridor links. L3 has slightly higher emission rate than L2 and L4 (428 grams/veh-mile CO2), while all the intersections (Ints) and the Int approach links are the highest ranging from around 530 to 625 grams/veh-mile CO2. It should be noted also that the throughput increased on all the intersection links compared with the roundabout scenario. L2, Int approach (L21), Int2, and L3 volumes were 4535, 4427, 4382, and 4016 vph, respectively.
Figure 7. (a) Total emissions variation on corridor links for intersections. (b) Emission rates variation on corridor links for intersections.
explains the emissions rate differences between L2, L21, Int2, and L3 based on their operating mode distributions for the through movement as well as the left turn movement. It should be noted that L2 and L3 are the same links in both the through and left-turn scenarios. However, Int app L21 and Int2 include separate left and through movements. When examining links L2 and L3, it was found that L3 has higher emission rates than L2, expressed in more time spent in lower speed modes with increased coasting and acceleration compared to L2, which has the majority of the time spent in higher speed modes.
Figure 8. Link operating mode distribution on selected links (L2, L21, Int2, and L3) for (a) the through movement and (b) the left movement.
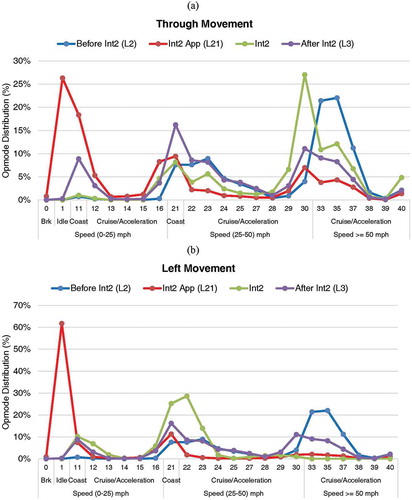
From the corridor’s volumes, Int2 is the heaviest (4382 vph,) and from the corridor’s length, L3 is the shortest (0.47 miles). The corridor’s optimized cycle length of 150 sec processed almost all the traffic at Int2, which was slightly congested on L3 due to the short distance between the two intersections resulting in reduced speeds and increased emission rates on L3. Yet emission rates on L2 and L3 are still lower than L21 and Int2. Each of L21 and Int2 is composed of two movements, left and through. The combined emission rates are shown in . However, analyzes each movement separately. reveals that 26% of the time, through vehicles were in the idling mode, which indicates an arrival on red phase, while shows that 61% of the time, left-turning vehicles arrived on red phase. In the through movement, L21 shows 18% coasting and about 16% accelerating at low speeds (0–25 mph), while the left turn shows 7% and 6%, respectively, indicating the effect of queuing and the start of the green phase. The rest of the distributions shows 38% for the through and 24% for the left turn time spent in modes with higher speeds (>25 mph), which indicates an arrival on a green phase. Int2 link represents the vicinity of the intersection immediately after the stop bar, which indicates whether there is congestion downstream of the intersection. The distribution shows that a greater fraction of the vehicle activity (94%) is in operating modes 21–40 (moderate and high-speed coasting and cruise/acceleration): relatively higher speeds (>25 mph) with 0% idling or braking. For the left turn, it has a lower fraction (75%) due to the lower turning speed. The overall distribution in the vicinity of the intersection (Int2) for the through and left-turn movements combined has better emission rates than the intersection approach L21. However, both links have higher rates than the before and after links.
Discussion
The preceding results demonstrate that the effect of control type on emission rates is significant. The results also indicate that effects of roundabout corridor operations on emission rates and those of signalized intersection corridor operations are divergent, especially when the corridor’s volumes are near or exceed capacity. However, there is no significant difference between emission rates in the vicinity of the roundabout or the intersection; both recorded approximately the same emission rate (550 grams/veh-mile CO2). This is attributed to the approximate speed characteristics of traffic passing through the intersections. For heavily congested corridors with roundabouts, immediate upstream approaches of the roundabouts are characterized by substantial coasting at lower speeds (<25 mph) and subsequent re-accelerating with less idling, described as acceleration events, which have a significant impact on pollutant emission rates. Conversely, for heavily congested signalized corridors, immediate upstream approaches are characterized by ample idling (lowest emission factor of all modes) but with less coasting and re-acceleration, resulting in lesser emission rates. Because of the continuous movement of the circulating traffic and the type of yield control at the roundabout approach, traffic movement is left up to the drivers’ discretion or judgment of accepting or rejecting a gap, which involves a lot of hesitations; thus, there is a driver behavior effect. For signalized intersections, drivers are controlled by the signal display: stop on red and accelerate or coast on green.
Other factors that affected emission rates included the number of approach lanes upstream of the intersection. In the roundabout scenario, the left and through traffic were using the same three-lane approach. However, at the signalized intersection approach, there were additional exclusive lanes for the left turns, which affected the upstream links’ emission rates. Therefore, if we assume that 550 grams per vehicle-mile is the baseline emission rate at both the corridor’s oversaturated roundabouts and signalized intersections, assigning more space (exclusive turn lanes) and time (traffic control) diminishes the driver behavior effect and improves emission rates upstream as well as downstream to the intersections.
Conclusion
This paper presented a detailed examination of two different types of control and their environmental impacts on vehicular travel along a heavily congested urban corridor in the city of Doha, Qatar. The corridor’s roundabout intersections were replaced with signalized intersections in 2014, seeking to improve operations. The corridor is operating at capacity in the AM peak hour with very high throughput. The corridor was modeled using VISSIM and MOVES. The VISSIM/MOVES models were calibrated to Qatar’s conditions, and VIMIS was used to estimate emissions derived from the detailed operating mode distribution (OPMODE).
Preliminary overall results indicated that the signal control scenario outperformed the roundabout scenario in the range of 37% to 43% reduction in emissions. A more detailed examination was conducted to understand the difference in environmental performance between the two scenarios for three different levels: vehicle type level, corridor level, and link level. The detailed analysis revealed that roundabout corridor operations effect on emission rates are divergent from signalized intersection corridor operations, particularly upstream and downstream from the intersection, and when the corridor’s volumes to capacity ratio approach or exceeds unity. Immediate upstream approaches of the roundabouts are characterized by substantial coasting at lower speeds and subsequent re-accelerating with less idling, described as acceleration events, which have a significant impact on pollutant emission rates. Conversely, for heavily congested signalized corridors, immediate upstream approaches are characterized by ample idling (lowest emission factor of all modes) but with less coasting and re-acceleration, resulting in reduced emission rates. The results also revealed that there is no significant difference between emission rates in the vicinity of the two types of control. Both recorded nearly the same emission rate (550 grams/veh-mile CO2) due to the same characteristics of speed and acceleration once entered the intersection. However, providing more space and control time minimizes the driver behavior effect and mitigates emission rates along oversaturated corridors.
Additional information
Notes on contributors
Khaled Shaaban
Khaled Shaaban is an associate professor and the Transportation and Air Quality Program Director in the Department of Civil Engineering at Qatar University, Doha, Qatar.
Hatem Abou-Senna
Hatem Abou-Senna is an assistant professor in the Center for Advanced Transportation Systems Simulations, Department of Civil, Environmental and Construction Engineering, University of Central Florida, Orlando, Florida, United States.
Dina Elnashar
Dina Elnashar is a project manager at TraffiConsult, Doha, Qatar.
Essam Radwan
Essam Radwan is a professor and director in the Center for Advanced Transportation Systems Simulations, Department of Civil, Environmental and Construction Engineering, University of Central Florida, Orlando, Florida, United States.
Related Research Data
References
- Abou-Senna, H., and E. Radwan. 2013. VISSIM/MOVES integration to investigate the effect of major key parameters on CO 2 emissions. Transp. Res. Part. D: Transp. Environ. 21:39–46. doi:10.1016/j.trd.2013.02.003.
- Agency, US Environmental Protection. 2010. MOVES2010 highway vehicle population and activity data. North Carolina: US Environmental Protection Agency, Assessment and Standards Division, Office of Transportation and Air Quality Research Triangle Park.
- Ahn, K., N. Kronprasert, and H. Rakha. 2009. Energy and environmental assessment of high-speed roundabouts. J. Transp. Res. Rec. 2123:54–65.
- Chaichan, M. T., H. A. Kazem, and T. A. Abed. 2018. Traffic and outdoor air pollution levels near highways in Baghdad, Iraq. Environ. Dev. Sustainability 20 (2):589–603. doi:10.1007/s10668-016-9900-x.
- Coelho, M. C., T. L. Farias, and N. M. Rouphail. 2006. Effect of roundabout operations on pollutant emissions. Transp. Res. Part. D: Transp. Environ. 11 (5):333–343. doi:10.1016/j.trd.2006.06.005.
- Dons, E., L. I. Panis, M. Van Poppel, J. Theunis, and G. Wets. 2012. Personal exposure to black carbon in transport microenvironments. Atmos. Environ. 55:392–398. doi:10.1016/j.atmosenv.2012.03.020.
- EPA. 2020. Transportation conformity guidance for quantitative hot-spot analyses in PM2.5 and PM10 nonattainment and maintenance areas. Michigan, USA: United States Environmental Protection Agency.
- Fernandes, P., M. C. Coelho, and N. M. Rouphail. 2017. Assessing the impact of closely-spaced intersections on traffic operations and pollutant emissions on a corridor level. Transp. Res. Part. D: Transp. Environ. 54:304–320. doi:10.1016/j.trd.2017.05.016.
- Hallmark, S., B. Wang, A. Mudgal, and H. Isebrands. 2011. On-road evaluation of emission impacts of roundabouts. J. Transp. Res. Rec. (2265):226–233. doi:10.3141/2265-25.
- Hofer, C., G. Jäger, and M. Füllsack. 2018. Large scale simulation of CO2 emissions caused by urban car traffic: An agent-based network approach. J. Clean. Prod. 183:1–10. doi:10.1016/j.jclepro.2018.02.113.
- Hung, W. T., H. Y. Tong, C. P. Lee, K. Ha, and L. Y. Pao. 2007. Development of a practical driving cycle construction methodology: A case study in Hong Kong. Transp. Res. Part. D: Transp. Environ. 12 (2):115–128. doi:10.1016/j.trd.2007.01.002.
- Khreis, H., C. Kelly, J. Tate, R. Parslow, K. Lucas, and M. Nieuwenhuijsen. 2017. Exposure to traffic-related air pollution and risk of development of childhood asthma: A systematic review and meta-analysis. Environ. Int. 100:1–31. doi:10.1016/j.envint.2016.11.012.
- Mandavilli, S., M. J. Rys, and E. R. Russell. 2008. Environmental impact of modern roundabouts. Int. J. Ind. Ergon. 38 (2):135–142. doi:10.1016/j.ergon.2006.11.003.
- Ming, T., P. Davies, W. Liu, and S. Caillol. 2017. Removal of non-CO2 greenhouse gases by large-scale atmospheric solar photocatalysis. Prog. Energy Combustion Sci. 60:68–96. doi:10.1016/j.pecs.2017.01.001.
- Ming, T., W. Fang, C. Peng, C. Cai, R. De Richter, M. H. Ahmadi, and Y. Wen. 2018. Impacts of traffic tidal flow on pollutant dispersion in a non-uniform urban street canyon. Atmosphere 9 (3):82. doi:10.3390/atmos9030082.
- Mustafa, M. A. S., and S. Vougias. 1993. “Analysis of pollutant emissions and concentrations at urban intersections.” Compendium of Technical Papers, ITE, 63rd Annual Meeting.
- Nesamani, K. S., and K. P. Subramanian. 2011. Development of a driving cycle for intra-city buses in Chennai, India. Atmos. Environ. 45 (31):5469–5476. doi:10.1016/j.atmosenv.2011.06.067.
- Pandian, S., S. Gokhale, and A. K. Ghoshal. 2009. Evaluating effects of traffic and vehicle characteristics on vehicular emissions near traffic intersections. Transp. Res. Part. D: Transp. Environ. 14 (3):180–196. doi:10.1016/j.trd.2008.12.001.
- Planning, Qatar General Secretariat for Development. 2011. Qatar national development strategy 2011-2016. Doha, Qatar: Qatar General Secretariat for Development Planning.
- Ranjitkar, P., A. Shahin, and F. Shirwali. 2014. Evaluating operational performance of intersections using sidra. Open Transportation J. 8:50-61.
- Salamati, K., N. M. Rouphail, H. Christopher Frey, B. Liu, and B. J. Schroeder. 2015. Simplified method for comparing emissions in roundabouts and at signalized intersections. J. Transp. Res. Rec. (2517):48–60. doi:10.3141/2517-06.
- Shahbazi, H., R. Ganjiazad, V. Hosseini, and M. Hamedi. 2017. Investigating the influence of traffic emission reduction plans on Tehran air quality using WRF/CAMx modeling tools. Transp. Res. Part. D: Transp. Environ. 57:484–495. doi:10.1016/j.trd.2017.08.001.
- Várhelyi, A. 2002. The effects of small roundabouts on emissions and fuel consumption: A case study. Transp. Res. Part. D: Transp. Environ. 7 (1):65–71. doi:10.1016/S1361-9209(01)00011-6.
- Vlahos, E., A. Polus, D. Lacombe, P. Ranjitkar, A. Faghri, and B. Fortunato III. 2008. Evaluating the conversion of all-way stop-controlled intersections into roundabouts. J. Transp. Res. Rec. (2078):80–89. doi:10.3141/2078-11.
- Wang, Q., H. Huo, K. He, Z. Yao, and Q. Zhang. 2008. Characterization of vehicle driving patterns and development of driving cycles in Chinese cities. Transp. Res. Part D: Transport Environ. 13 (5):289–297. doi:10.1016/j.trd.2008.03.003.