
 ?Mathematical formulae have been encoded as MathML and are displayed in this HTML version using MathJax in order to improve their display. Uncheck the box to turn MathJax off. This feature requires Javascript. Click on a formula to zoom.
ABSTRACT
Waste oil fly ash (OFA) collected from disposal of power generation plants was treated by physicochemical activation technique to improve the surface properties of OFA. This synthesized material was further used for potential hydrogen sulfide (H2S) adsorption from synthetic natural gas. The raw OFA was basically modified with a mixture of acids (20% nitric acid [HNO3] and 80% phosphoric acid [H3PO4]), and it was further treated with 2 M potassium hydroxide (KOH) to enhance the surface affinity as well as surface area of synthesized activated carbon. Correspondingly, it enhanced the adsorption of H2S. Crystallinity, surface morphology, and pore volume distribution of prepared activated carbon were investigated using X-ray diffraction (XRD), scanning electron microscopy (SEM), and Brunauer-Emmett-Teller (BET) analyses. Fourier transform infrared (FTIR) study was also performed to identify the functional groups during different synthesis stages of modified activated carbon. The Langmuir, Freundlich, Sips, and dual-site Langmuir (DSL) models were used to study the kinetic and breakthrough behavior of H2S adsorption over alkali-modified activated carbon. Modeling results of isotherms indicated that OFA has dual sites with high and low affinity for H2S adsorption. The Clark model, Thomas model, and Yoon-Nelson model were used to examine the effects of flow rate and inlet concentration on the adsorption of H2S. Maximum uptake capacity of 8.5 mg/g was achieved at 100 ppm inlet concentration and flow rate of 0.2 L/min.
Implications: Utilization of worthless oil fly ash from power plant is important not only for cleaning the environment but also for solid waste minimization. This research scope is to eradicate one pollutant by using another pollutant (waste ash) as a raw material. Chemical functionalization of synthesized activated carbon from oil fly ash would lead to attachment of functional groups of basic nature to attract the acidic H2S. Such type of treatment can enhance the uptake capacity of sorbent several times.
Introduction
Hydrogen sulfide (H2S) is an airborne pollutant causing both acute and chronic health problems depending on exposure time and toxicant concentration (Feng et al. Citation2005; Wang Citation2010). It causes eye irritation at low concentrations (10–20 ppm) while engenders respiratory paralysis above the 300 ppm level. Five-minute exposure to higher concentrations (500–1000 ppm) may lead to death (Elsayed et al. Citation2009; Xiao et al. Citation2008). Apart from its toxicity to human, hydrogen sulfide can also deactivate industrial catalysts even at concentration as low as 1 ppm in the gas stream (Ashori, Nazari, and Illas Citation2014; Forzatti and Lietti Citation1999). Therefore, controlling the emission of H2S is beneficial for both human lives and industries.
Various remediation technologies have been practiced industrially to meet the strict environment regulations of H2S emission. These methods include absorption using alkanolamine solutions (Godini and Mowla Citation2008; Su et al. Citation2010), oxidation of H2S to sulfur by the Claus process (Ledoux et al. Citation2000; Mora Citation2000), biological oxidation to sulfuric acid (Soroushian et al. Citation2006), and adsorption using carbonaceous and/or aluminosilicate adsorbents (Wiheeb et al. Citation2013). All these methods have their own benefits and limitations that make them suitable for specific applications. Among these techniques, adsorption on a suitable surface of solid is preferred for treating sour gas streams that have lower concentration of H2S (Choo, Lau, and Mohamed Citation2013; Meeyoo, Trimm, and Cant Citation1997). Activated carbon is widely used as an adsorbent due to its high surface area and porosity. Different types of inexpensive materials can be used as precursors for the synthesis of activated carbon (Hernandez-Ramirez and Holmes Citation2008; Mohamad Nor et al. Citation2013). Oil fly ash, a by-product from power plants, represents a promising option to be converted to activated carbon and used for H2S capture from gas stream. The yearly world production of fly ash is more than 700 million tons, with only 30% being used and the rest is dumped in landfill (Wee Citation2013). The main composition of oil fly ash includes unburned carbon, aluminum oxide, traces of heavy metals, and silicon dioxide. However, the ash obtained from coal combustion comprises mainly iron, aluminum (Al), and silicon (Si), with minor concentration of alkali and alkaline metals. Iron-aluminum-silicates and/or calcium-iron-aluminum-silicates account for 60–90% of most of the coal-fired fly ashes. Depending on the composition of raw fly ash, versatile materials such as zeolites, catalysts, and activated carbon may be derived from fly ash, which is advantageous due to the low cost and abundant availability fly ash, besides solving solid waste issue (Salehin, Aburizaiza, and Barakat Citation2016; Musyoka et al. Citation2012; Manique et al. Citation2017; Adamczyk and Białecka Citation2005; Aslam et al. Citation2015).
Several studies have been reported on the utilization of fly ash for the adsorption of individual toxicants in an aqueous solution or from flue gas. Salvatro Andidi et al. used oil fly ash to adsorbed 2-chlorophenol (CP), 2-chloroaniline (CA), and methylene blue (MB) from aqueous solutions. They reported that the adsorption capacity was highest for 2-chlorophenol (CP); however, the other two organics showed less affinity for fly ash adsorbent (Andini et al. Citation2008). Bada and Potgieter-Vermaak investigated the adsorption capabilities of fly ash–based adsorbents for organic pollutants originated from petrochemical waste. They compared acid-activated ash adsorbent with heat-treated fly ash adsorbent and found that the chemically treated ash was superior for liquid-phase adsorption of organic pollutants (Bada and Potgieter-Vermaak Citation2008). Azhar Uddin et al. prepared activated carbon for adsorption applications by the pyrolysis of mixture of fly ash with road paving asphalt dissolved in kerosene at 650 °C in nitrogen (N2) atmosphere. They showed that macropore diameter of the sample increased with asphalt ratio (Azhar Uddin et al. Citation2007). Bagreeve et al. studied the sodium hydroxide (NaOH)-modified activated carbon for the adsorption of H2S and concluded that pollutant-binding capacity was increased with loading of NaOH and the adsorption capacity was insensitive to pore structure and surface area of carbon (Bagreev and Bandosz Citation2002). Prezeprioski et al. also reported a significant improvement in adsorption capacity of H2S by treating activated carbon with potassium carbonate (K2CO3) (Przepiorski, Yoshida, and Oya Citation1999). It can be concluded that the presence of alkali metals on the surface of activated carbon helps to dissociate the H2S molecule and hence increases the uptake capacity. However, the porosity of a solid sorbent is also important for enhancing its pollutant uptake capacity. Thus, high surface area and fine microporous adsorbent surface help to build strong interactions between adsorbate gas molecules and the carbon structure. This interaction may lead to physical adsorption of H2S pollutant onto adsorbent surface. On the other hand, anchoring oxygen-containing functionalities on the adsorbent surface may led to the oxidation of H2S, or strong bonding to these surface functionalities, and hence promotes chemisorption (Feng et al. Citation2005).
The present work aimed at equilibrium and column breakthrough study of H2S adsorption in a packed column with alkaline-treated activated carbon derived from oil fly ash. The effects of operating variables such as temperature, influent concentration of H2S, flow rate, and inlet pressure of gas stream have also been investigated. Meanwhile, different isotherm models such as the Freundlich, Langmuir, Sips, and dual-site Langmuir (DSL) models were tested to fit the experimental adsorption data. Subsequently, the Clark model, Thomas model, and Yoon-Nelson model were also fitted with experimental data.
Experimental methods and materials
Materials
Rabigh (RB) Power Plant, Saudi Arabia, provided the raw fly ash sample, which was further dried overnight in an oven at 110 °C for removal of any entrained moisture in the sample. In addition, 45 µm mesh size sample was extracted from the dry raw fly ash through sieve tray and stored in the closed sample container for synthesis of activated carbon. shows the composition of raw oil fly ash where high carbon content can be observed in the raw material. Nitric (69% pure) and orthophosphoric (85% pure) acids were of analytical grades, supplied by Panreac Quimica, Spain.Potassium hydroxide was received from Merck Chemical Company, Germany. A 2 M solution of KOH was further prepared by dissolving it in the deionized water. Synthetic natural gas containing 50 and 100 ppm H2S in methane was provided by Saudi Gas Company. All the volumetric glassware was rinsed with distilled water and dehydrated in an oven at 105 °C.
Table 1. Elemental compositions of raw OFA and FA-AC.
Preparation of activated OFA and surface modification with aqueous KOH
Initially, 10 g oil fly ash (OFA) was added into round-bottom flask that already contained 200 mL of acid mixture (composed of 20% HNO3 and 80% H3PO4 by volume). The contents of the flask were heated and boiled under total reflux conditions for 4 hr. Then activated sample was filtered, and the obtained solid residue was washed repeatedly with distilled water. The washing of residue was continued until pH of spent acid in the filtrate reached 5. Finally, the solid residue was dried in an oven at 110 °C for 5 hr. The alkali functionalization of the produced carbon was performed by mixing of 5 g of solid residue in 50 mL of 2 M KOH solution and heating the mixture for 4 hr at 100 °C in a round-bottom flask at total reflux. The resultant mixture was cooled, followed by filtration, and then the filter cake was washed with 500 mL distilled water. Filter cake was dried in an oven at 110 °C for 5 hr and stored in a closed-cap bottle for further characterization and adsorption tests. In the following description, the three samples are abbreviated as “raw OFA” for raw oil fly ash, “FA-AC” for acid-activated raw oil fly ash, and “FA-ACKOH” for KOH-functionalized acid-activated fly ash.
Characterization of produced carbon
Surface area and pore characteristics were measured using Micromeritics ASAP 2020 analyzer (xx, xx) by measuring the Brunauer-Emmett-Teller (BET) adsorption-desorption capacity of N2 at 77.35 K. Initially, the sample was degassed under vacuum at 200 °C for 6 hr; after that nitrogen gas was adsorbed/desorbed on a sample at different relative pressures to obtain equilibrium isotherm. PerkinElmer fiber probe coupler (FPC) Fourier transform infrared (FTIR) spectrophotometer was used to measure the functional groups on the surface of activated OFA. A mixture of adsorbent samples and KBr powder was hydraulically pressed at 10 ton/m2 to prepare a thin uniform disk. Then the disk was dried in oven at 110 °C to inhibit any interference due to moisture. Transmission mode was set in the machine’s software to record the entire FITR spectrum.
The X-ray diffraction (XRD) of the OFA sample was determined using a Phillips PW 1830 diffractometer (xx, xx) operating at 40 kV and 40 mA. The scan rate ranged from 2θ = 0° to 2θ = 80°, and sample phases were identified by using the HighScore Plus software. Energy-dispersive X-ray (EDX) spectrophotometer was used to analyze the elemental composition of OFA samples.
The samples used for EDX analysis were coated with a thin layer of gold. Spot analysis was used to generate the characteristic X-ray spectra, from which the compositions of the samples were obtained.
Adsorption of H2S
Adsorption capacity of the synthesized adsorbent, i.e., FA-ACKOH, was evaluated by H2S adsorption tests in a packed column as shown in Figure S1. Jacketed adsorption column (8 cm in length and 1.0 cm diameter) was made up of quartz glass. Isothermal conditions were maintained inside the column by continuous circulation of glycol in a glass jacket of the column. The column was packed with 1 g adsorbent and small amounts of cotton were put at the top and bottom to facilitate the distribution of adsorbate stream. First of all, the packed column was flushed with nitrogen. Then, the adsorbate gas stream having 100 ppm H2S (remaining was methane [CH4]) was introduced into the column from the bottom at 0.4 L/min and 1 atm pressure at different temperatures (i.e., 1, 10, 20, 30, 40, 50 °C). The temperature was changed by circulating ethylene glycol (Cole-Parmer Polystat cooling/heating circulating bath) in an adsorption column jacket to maintain the required temperature. The exit concentration of toxic H2S was measured at different time intervals by digital MultiRAE IR sensorinstalled at the outlet pipe. The experiments were repeated by varying the adsorbate flow rate and inlet concentration of the toxicant. Desorption experiments were performed in a similar manner by sweeping the nitrogen into the column, and outlet H2S concentration was also measured as a function of time. Figure S1 showed the experimental setup used for H2S adsorption and desorption tests. Adsorption capacity was calculated using eq 1:
where q is the adsorption capacity (mg/g); Co and C are the initial and instantaneous concentrations at time t, respectively; and M, F, and t are adsorbent mass (g), flow rate of adsorbate (mL/min), and time (min), respectively.
Results and discussion
Characterization of OFA absorbents
Energy dispersive X-ray (EDX) spectroscopy was conducted to obtain the elemental compositions of raw OFA and FA-AC. Initially, raw OFA contained unburned carbon as the main constituent and other mineral oxides, with trace amounts of heavy metals. During the activation process, several nitrification and phosphate reactions occurred due to the interaction of ash with the acid mixture. As a result, all the inorganic oxides leached out completely from the ash, but organically bounded sulfur still remained in the carbon structure, as can be seen from . This shows that the mixture of acids used was more effective in attacking the organic form of sulfur as compared with pyrite and sulfate-type sulfur in the fly ash (Izquierdo and Querol Citation2012; Kandah, Shawabkeh, and Ar’ef Al-Zboon Citation2006; Mustafa Arslan Citation1993; Shawabkeh et al. Citation2011). shows the complete elemental compositions of raw OFA and FA-AC.
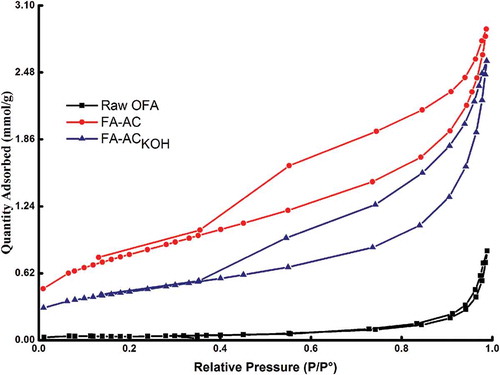
The porosimetric features of raw OFA and its derived substances are shown in . The precursor material has small BET surface area and negligible micropore volume. Acid treatment induces porosity to ash by removing inorganic matter from the surface and produces a porous carbon. The BET surface area has also increased from 2.75 to 61.54 m2/g. However, the surface area and pore volume are reduced after the functionalization of FA-AC with aqueous KOH. In fact, the reductions are believed to occur because of destructive action of KOH on the inner pores of carbon.
Table 2. Porosity characteristics of raw and activated ash samples.
The Barrett-Joyner-Halenda (BJH) pore size distribution (Figure S2) of FA-ACKOH shows that 91% of the pore area belongs to mesopores, whereas micropores make up only 4.7% of the total area and macropores the remaining area. Meanwhile, in FA-AC, mesopores account for almost same percentage (i.e., 90.4%) of the pore area and the remaining 8% and 1.5% are contributed by micro- and macropores, respectively. The pore area distribution as shown in Figure S2 depicts the heterogeneity of the adsorbent surface, and it can be characterized as mesoporous adsorbent. The hysteresis in the isotherms of FA-AC and FA-ACKOH is approximately the same, as shown in , which confirms that the mesoporous area in FA-ACKOH is almost the same as its precursor. Although FA-AC is more porous than FA-ACKOH, the surface modification with alkali treatment has increased its adsorption capacity several times, as discussed in the subsequent sections.
Figure 1. BET isotherm plots of activated oil fly ash carbon at different stages of synthesis.
FTIR spectra of different ash samples are shown in Figure S3. A broad band appears in the range 3100–3550 cm−1 for raw oil fly ash, with minimum intensity at 3400 cm−1.This stretching vibration is attributed to free hydroxyl groups (–OH) in raw oil fly ash sample (Hontoria-Lucas et al. Citation1995). Similarly, it can also be related to both adsorbed water (3400 cm−1) and silanol groups (Si–OH) on the surface. Two peaks can be observed in raw OFA at 2924 and 2854 cm−1 that correspond to C–H sp3 stretching in aliphatic acids and O–H vibration in the molecule (Bakr and Gabre Citation2013; Kumar, Prasad, and Mishra Citation2010). Three peaks (1625, 1394, and 1115 cm−1) between 1100 and 1650 cm−1 are indicative of C=C stretching/bending vibrations of O–H groups and stretching vibrations of C–O groups, respectively. Compared with raw OFA, acid treatment of fly ash (i.e., FA-AC) introduces oxygenated acidic surface functional groups that mainly consist of phenolic hydroxyls, carboxylics, and lactones (Shafeeyan et al. Citation2010). After KOH treatment, the FA-AC surface is functionalized and the hydroxyl group is attached to the surface, as indicated by intense peak at 3435 cm−1. The peak at 1630 cm−1 is due to C=O double-bond stretching vibrations of aromatic carbons (Buasri et al. Citation2013; Shawabkeh Citation2004). The adsorption of H2S onto FA-ACKOH surface produces a strong band with minimum at 3435 cm−1, and this peak can be ascribed to dissociative adsorption of H2S. This increase in intensity is due to contribution of –OH stretching of –SO–OH functional group. –SH group can be assigned to the peak that appears at 1620 cm−1 (Travert et al. Citation2002; Wang et al. Citation1998; Lee et al. Citation2002). Comparison of FTIR spectra shows that the H2S adsorption became more effective due to the presence of hydroxyl groups.
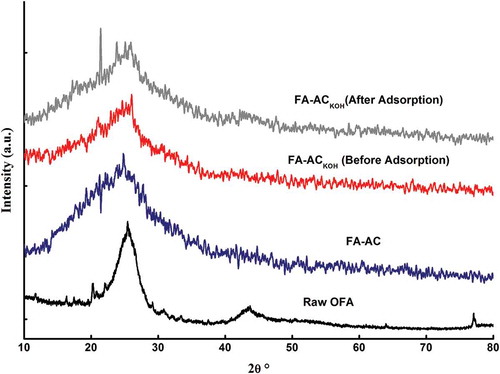
XRD was performed to investigate the changes incorporated into the ash at various stages of its use, as shown in . Generally, the crystal structure of heavy oil fly ash consists of carbon in amorphous state and crystallites of metallic oxides. The presence of amorphous carbon can be indicated by a broad peak at 2θ = 25° (Yaumi, Hussien, and Shawabkeh Citation2013). The crystallites of metallic oxides in raw OFA include mullite (aluminosilicate), zeolite, quartz, faujasite, and cancrinite. Small peaks at 2θ = 11°, 16°, and 18° can be assigned to zeolite. A distinct peak at 2θ = 22° is related to the presence of quartz in the fly ash. Three small peaks between 2θ = 27° and 2θ = 38° reveal the presence of faujasite, cancrinite, and mullite phases. Furthermore, a wide peak at 2θ = 43° reveals a sodalite phase, followed by a small peak of quartz at 2θ = 76° (Katara et al. Citation2013; Musyoka et al. Citation2011; Shawabkeh et al. Citation2011). Treatment of raw OFA with mixture of acids washed out almost all the minerals, as most of the tiny peaks do not exist further, as shown in for FA-AC. The carbon peak intensity at 2θ = 25° has increased up to 185% in comparison with raw oil fly ash. The broadening of the carbon peak after acid activation of raw ash reflects the predominance of amorphous and porous nature of activated carbon (Tangjuank et al. Citation2009). The XRD pattern remains the same after functionalization of FA-AC with KOH, except around 50% decrease in peak intensities after KOH treatment. It shows surface coverage of porous carbon with alkali; hence, decrease in surface area has been observed, as indicated in BET analysis (Ilango Citation2008). Comparing the individual peaks of X-ray diffractograms of FA-ACKOH before and after H2S adsorption tests reveals no major difference between them except the appearance of a clear, sharp peak at 2θ = 21.5° after H2S adsorption onto FA-ACKOH. Therefore, it indicates the possibility of formation of a new substance, i.e., K2SO4, as a result of chemical reaction of acidic H2S in the gas stream with carbon in the adsorbent (Lee et al. Citation2002; Shawabkeh Citation2004).
Figure 2. XRD patterns of Raw and synthesized adsorbents.
Adsorption thermodynamics
Thermodynamic parameters were evaluated through the adsorption equilibrium data. For that purpose, the following equations were used for the calculation of thermodynamic parameters:
where ∆H*, ∆S*, and ∆G* are the change in enthalpy, entropy, and Gibbs free energy of the adsorption process, respectively. ∆G* is the fundamental criterion of the process spontaneity. The specific values of all the pertinent parameters for H2S adsorption over FA-ACKOH were calculated using eqs 2 and 3, and the results are presented in Table S1.
The enthalpy, ∆H* (−3.51 KJ/mol), of adsorption is negative, which indicates that the sorption of H2S onto FA-ACKOH is exothermic in nature. The Gibbs free energy, ∆G*, was found to be negative, which confirms that the adsorption of H2S is a spontaneous process and the degree of spontaneity increases with rise in temperature. The positive entropy change (∆S*) indicates the affinity of the FA-ACKOH for adsorption of H2S. It also suggests the increase in randomness of the adsorption process.
Adsorption isotherms
The Freundlich, Langmuir, Sips, and dual-site Langmuir (DSL) models were utilized for isothermal analysis of H2S adsorption onto FA-ACKOH. The mathematical expression of each isotherm with associated parameters is presented in . The experimental data were analyzed by nonlinear least squares method, as nonlinear regression is superior to linear regression for analysis of the data. In order to evaluate the applicability of each isotherm model, statistical parameters were used, such as coefficient of determination (R2) and residual sum of squares (RSS). Microsoft Excel (Redmond, WA) “Solver” function was used to carry out the regression and optimization of statistical parameters such as RSS by using the following equation:
Table 3. Isotherm models and their pertinent parameters for runs at different temperatures at flow rate 0.4 L/min and 100 ppm initial concentration.
where n is the number of data points, qi,exp and qi,model are the experimental and theoretical values of adsorbed amount of H2S on FA-ACKOH, respectively. The correlation coefficient (R2) is a measure of variance in the experimental and model predicted values, and the standard error (RSS) provides an indication of the precision of the results. The model that provides high R2 and low RSS can be ranked as the best isotherm model for the observed results. shows the typical isotherm plots, and the calculated capacities along with other model parameters are summarized in . The results indicate that the adsorption isotherms were best fitted by the dual-site Langmuir (DSL) model, which can be seen through the RSS and regression coefficient values. The Freundlich model underestimated the experimental values at lower concentrations and overestimated them at higher concentrations, whereas the Langmuir and Sips models are the opposite (overestimated at lower concentrations and underestimated at higher concentrations). The parameter n of the Freundlich isotherm signifies the degree of favorability of adsorption. It is clear that increase in temperature decreases the value of n, which is unfavorable for the adsorption of H2S. Adsorption at higher temperatures raises the vapor pressure of adsorbate and hence increases the energy level of pollutant gas to overcome the van der Waals force of attraction and migrates it back to bulk gas phase. As a result, uptake of H2S decreases, which is also reflected in the decline of value of n. The better correlation coefficient (R2) of the Sips isotherm indicates that the adsorbent surface is not completely homogeneous. The factor βS reflects the surface heterogeneity, and the smaller the value of this factor, the higher the surface heterogeneity of adsorbent.
Figure 3. Fitting adsorption isotherm data for H2S at 100 ppm inlet concentration and 0.4 L/min flow rate: (a) Different adsorption models at 1 °C. (b) Dual-site Langmuir (DSL) model for all temperatures.
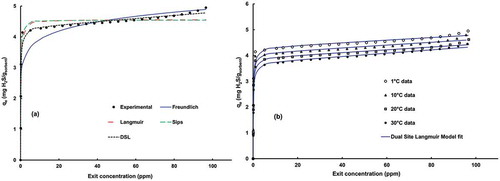
After concluding the DSL model as the best-fit model, the experimental adsorption data at different temperatures (from 1 to 30 °C) were analyzed and regression results are depicted in . The results show that the amount adsorbed on solid phase increased sharply up to a value close to 3.5–4.25 mg/g when the bed temperature was in the range of 1–30 °C. The fitting of isotherms with the DSL model suggests that the interaction between H2S and FA-ACKOH has dual-site characteristics. It means that adsorbent has two energetically different sites with high and low affinity. The exit concentration of the column outlet remained zero until the high-affinity first type of sites was fully exhausted by gaseous adsorbate. The coverage of pores with alkali during KOH functionalization (as supported by surface area characterization in earlier discussion) tends to chemisorb the influent H2S onto FA-ACKOH; hence, K2SO4 was formed, as evident from the X-ray diffractogram. These high-affinity sites contributed more toward the overall adsorption capacity. After the steep rise in qe due to utilization of higher-affinity sites, adsorption became slower, as shown in . This flat portion of isotherm may be related to the filling of lower-affinity sites by the diffusion of adsorbate into the pores until the column became saturated. Both the saturation capacities (qm1, qm2) and affinities (K1, K2) decreased with increase in bed temperature, as also supported by thermodynamic study discussed in the previous section.
Column dynamics and effects of operating conditions
The breakthrough behavior and adsorption capacity were predicted through different dynamic adsorption models. The Yoon-Nelson model, Thomas model, and Clark model were used for analyzing the experimental data of H2S adsorption.
Yoon-Nelson model
Yoon-Nelson model, a very simple model, can be used to predict the breakthrough behavior of vapor or gas adsorption over an adsorbent surface. In this model, it is assumed that the rate of decrease of adsorbate gas adsorption is directly proportional to the probability of adsorbate breakthrough on the adsorbent and adsorption potential of adsorbate. The mathematical expression of the Yoon-Nelson model can be represented as follows. It is usually used for breakthrough behavior of a single component.
Here, kYN (min−1) is the rate constant of the Yoon-Nelson model. This rate constant is a function of contaminant concentration (C), volumetric flow rate (F), and weight of the adsorbent, W (i.e., ). τ (min) is the time required to reach at 50% adsorbate breakthrough time.
Thomas model
The Thomas model assumes that diffusion constraints (both external and internal) are absent in the adsorption process. It indicates that the rate of driving force follows second-order reversible reaction kinetics and the Langmuir adsorption isotherm. The Thomas model computes the maximum concentration of solute gas on the adsorbent surface and adsorption rate constant for an adsorption process. The linearized form of the Thomas model is represented by eq 6:
where qo (mg/g) is the maximum uptake of the solid-phase adsorbent, KTh is the constant (mL/min·mg) of the Thomas model, Q is the flow rate (mL/min), and X (g) is the amount of adsorbent packed in the column. The specific constants can be determined by analyzing the data through either linear or nonlinear regression.
Clark model
The Clark model is based on the concept of mass transfer in combination with the Freundlich isotherm. The model equation can be expressed as follows:
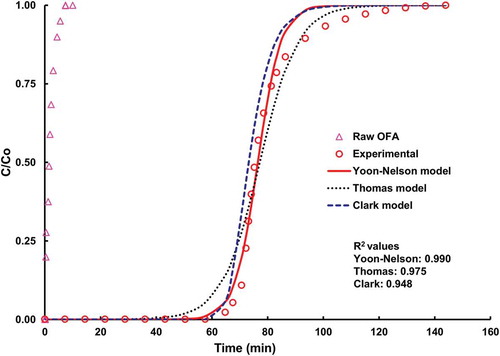
where the constants A and r must be adjusted using the values of n determined from the Freundlich isotherm model. For this study, the value n was ~11 (calculated from isotherm modeling). Nonlinear regression method was used to find the parameters of all the models cited above. shows the breakthrough curves of raw OFA and FA-ACKOH. The spread of breakthrough curve for raw OFA is very small, in contrast to its counterpart, correspondingly the minor uptake of raw material (~0.28 mg/g) as compared with FA-ACKOH. Modeling with the Yoon-Nelson, Thomas, and Clark models for the adsorption run at 1 °C and 100 ppm inlet H2S concentration and 0.4 L/min flow rate was carried out. The regression correlation coefficient (R2) value for each dynamic model is shown in . It can be seen that the Yoon-Nelson model better fitted the adsorption of H2S on FA-ACKOH than any other model. The Thomas model at lower exit concentrations is not as appropriate as it is at higher exit concentrations, whereas the Clark model shows the reverse behavior as compared with the Thomas model. Having a higher correlation coefficient value, the Yoon-Nelson model was further used to explain the effects of operating conditions on the breakthrough curves.
Figure 4. Breakthrough curve modeling with the Yoon-Nelson, Thomas, and Clark models for the adsorption run at 1 °C with 100 ppm inlet H2S concentration and 0.4 L/min flow rate.
Effects of flow rate, concentration, and inlet pressure
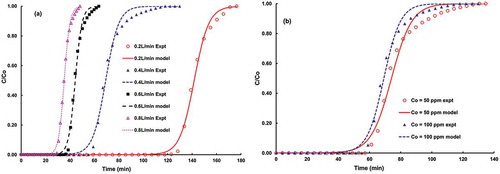
The Yoon-Nelson model was applied to experimental breakthrough data that were collected at various flow rates and two different initial concentrations, as presented in . The correlation coefficients are summarized and compared with experimental findings in Table S2. The values of regression constants and percentage errors in comparing predicted versus experimental τ values are negligible. Raising the volumetric flow rate shifts the breakthrough time curve to the left and affects the adsorption capacity. Decreasing the flow rate from 0.8 to 0.2 L/min increases the column breakthrough time many folds, as shown in . As the rate of introduction of adsorbate increases, the active sites are filled quicker and adsorbent achieves saturation at faster speed. The value of the Yoon-Nelson model constant (i.e., ) increases with flow rate, hence higher uptake rate of pollutant molecules at constant concentration and mass of an adsorbent. On the other hand, the lower inlet concentration of pollutant gas (at constant temperature, flow rate, and adsorbent mass) gives slower breakthrough, since lower concentration gradient causes slower transport. The breakthrough curves are presented in . The Yoon-Nelson model parameters are presented in Table S2 for two different initial concentrations. Because of direct relation with concentration, the transport rate, kYN, shows a higher (~0.188 min−1) value at higher concentration as compared with its lower value corresponding to lower concentration. On the other hand, lower pollutant concentration in the influent stream increases the treated volume that can be processed and shifts the breakthrough curve to the right.
Figure 5. Comparison of experimental versus predicted (Yoon-Nelson) breakthrough curves: (a) Different flow rates (temperature = 30 °C; inlet concentration = 100 ppm). (b) Different inlet concentrations (temperature = 30 °C; flow rate = 0.4 L/min).
Adsorption experiments were also conducted at different gauge pressures (20–50 psi) to examine the effect of inlet pressure on the column breakthrough curve. The column breakthrough data were fitted to the Yoon-Nelson model, and it shows good agreement with experimental data. The Yoon-Nelson model parameters are listed in Table S3. Pressure drop in column remained below 6%, and the 50% breakthrough time was increased from 76 to 89 min by increasing the pressure level from 20 to 50 psi. In , a comparison of adsorption capacities between synthesized fly ash–based adsorbent and other similar types of activated carbon reported illustrates that the studied adsorbent has almost similar or higher capability to adsorb the pollutant acidic gas (H2S) from gas stream.
Table 4. Comparison of breakthrough capacities of synthesized adsorbents reported in the literature.
Conclusion
This study suggests that a waste oil fly ash can be utilized as a low-cost adsorbent for removal of H2S from natural gas. Chemical treatment with acid solution removed the undesired minerals from raw OFA and increased the surface area, which is required for increased adsorption capacity. Activation of raw OFA with the described approach has converted it into a valuable adsorbent, and this can also aid waste disposal related to oil fly ash. H2S uptake capacity was increased to 8.5 mg/g from just 0.28 mg/g. H2S adsorption process was exothermic in nature and was spontaneous, as shown by the ∆G* value. The DSL isotherm better explained the isotherm breakthrough experimental data with dual-site adsorption characteristics of produced adsorbent. The Yoon-Nelson dynamic model was considered to be most appropriate among all the dynamic models to reproduce the experimental breakthrough curves.
Supplemental Material
Download PDF (510.3 KB)Acknowledgment
The authors would like to acknowledge the help of the Science and Technology Unit at King Fahd University of Petroleum and Minerals (KFUPM), Saudi Arabia.
Supplemental Data
Supplemental data for this paper can be accessed on the publisher’s website.
Additional information
Funding
Notes on contributors
Zaheer Aslam
Zaheer Aslam is working as assistant professor at Department of Chemical Engineering, UET, Lahore 54000, Pakistan.
Ibnelwaleed A. Hussein
Ibnelwaleed A. Hussein is working as assistant professor at Department of Chemical Engineering, UET, Lahore 54000, Pakistan.
Reyad A. Shawabkeh
Reyad A. Shawabkeh is a professor at Department of Chemical engineering, University of Jordan, Amman, Jordan.
Mohammad Anwar Parvez
Mohammad Anwar Parvez is an assistant professor at Department of Chemical Engineering, University of Hafr al Batin, Kingdom of Saudi Arabia.
Waqar Ahmad
Waqar Ahmad is a PhD scholar at Department of Chemical Engineering, Monash University, Clayton Campus, Australia.
Ihsanullah
Ihsanullah is Research Engineer-III/Assistant Professor at Centre for Water and Environment (CEW), Research Institute, King Fahd University of Petroleum & Minerals, Dhahran, Kingdom of Saudi Arabia.
Related Research Data
References
- Adamczyk, Z., and B. Białecka. 2005. Hydrothermal synthesis of zeolites from polish coal fly ash. Polish J. Environ. Stud. 14 (6):713–719. doi:10.1179/1743676115Y.0000000063.
- Andini, S., R. Cioffi, F. Colangelo, F. Montagnaro, and L. Santoro. 2008. Adsorption of chlorophenol, chloroaniline and methylene blue on fuel oil fly ash. J. Hazard. Mater. 157 (2–3):599–604. doi:10.1016/j.jhazmat.2008.01.025.
- Ashori, E., F. Nazari, and F. Illas. 2014. Adsorption of H2S on carbonaceous materials of different dimensionality. Int. J. Hydrogen Energy 39 (12):6610–6619. doi:10.1016/j.ijhydene.2014.02.004.
- Aslam, Z., R. A. Shawabkeh, I. A. Hussein, N. Al-Baghli, and M. Eic. 2015. Synthesis of activated carbon from oil fly ash for removal of H2S from gas stream. Appl. Surf. Sci. 327:107–115. Elsevier B.V. doi:10.1016/j.apsusc.2014.11.152.
- Azhar Uddin, M., Y. Shinozaki, N. Furusawa, T. Yamada, Y. Yamaji, and E. Sasaoka. 2007. Preparation of activated carbon from asphalt and heavy oil fly ash and coal fly ash by pyrolysis. J. Anal. Appl. Pyrolysis 78 (2):337–342. doi:10.1016/j.jaap.2006.09.004.
- Bada, S. O., and S. Potgieter-Vermaak. 2008. Evaluation and treatment of coal fly ash for adsorption application. Leonardo El. J. Pract. Technol. 12 (January–June):37–48.
- Bagreev, A., and T. J. Bandosz. 2002. A role of sodium hydroxide in the process of hydrogen sulfide adsorption/oxidation on caustic-impregnated activated carbons. Ind. Eng. Chem. Res. 41 (4):672–679. doi:10.1021/ie010599r.
- Bakr, M. H. M., and A. M. E. Gabre. 2013. Reduction of COD in resin production wastewater using three types of activated carbon. J. Environ. Treat. Tech. 1 (3):126–136.
- Buasri, A., N. Chaiyut, V. Loryuenyong, E. Phakdeepataraphan, S. Watpathomsub, V. Kunakemakorn, A. Materials, and P. Samples. 2013. Synthesis of activated carbon using agricultural wastes from biodiesel production. Int. J. Mater. Metallurgical Eng. 7 (1):98–102.
- Choo, H., L. C. Lau, and A. R. Mohamed. 2013. Hydrogen sulfied adsorption by alkaline impregnated coconut shell activated carbon. J. Eng. Sci. Technol. 8 (6):741–753.
- Elsayed, Y., M. Seredych, A. Dallas, and T. J. Bandosz. 2009. Desulfurization of air at high and low H2S concentrations. Chem. Eng. J. 155 (3):594–602. doi:10.1016/j.cej.2009.08.010.
- Feng, W., S. Kwon, E. Borguet, and R. Vidic. 2005. Adsorption of hydrogen sulfide onto activated carbon fibers: Effect of pore structure and surface chemistry. Environ. Sci. Technol. 39 (24):9744–9749. doi:10.1021/es0507158.
- Forzatti, P., and L. Lietti. 1999. Catalyst deactivation. Catal. Today 52:165–181. doi:10.1016/S0920-5861(99)00074-7.
- Godini, H. R., and D. Mowla. 2008. Selectivity study of H2S and CO2 absorption from gaseous mixtures by MEA in packed beds. Chem. Eng. Res. Des. 86 (4):401–409. doi:10.1016/j.cherd.2007.11.012.
- Hernandez-Ramirez, O., and S. M. Holmes. 2008. Novel and modified materials for wastewater treatment applications. J. Mater. Chem. 18 (24):2751. doi:10.1039/b716941h.
- Hontoria-Lucas, C., A. J. López-Peinado, J. D. D. López-González, M. L. Rojas-Cervantes, and R. M. Martín-Aranda. 1995. Study of oxygen-containing groups in a series of graphite oxides: Physical and chemical characterization. Carbon 33 (11):1585–1592. doi:10.1016/0008-6223(95)00120-3.
- Ilango, S. 2008. Equilibrium sorption studies of Fe, Cu and Co ions in aqueous medium using activated carbon prepared from recinius communis linn. J. Appl. Sci. Environ. Manag. 12 (2): 81–87.
- Izquierdo, M., and X. Querol. 2012. Leaching behaviour of elements from coal combustion fly ash: An overview. Int. J. Coal Geol. 94 (May):54–66. Elsevier B.V. doi:10.1016/j.coal.2011.10.006.
- Kandah, M. I., R. Shawabkeh, and M. Ar’ef Al-Zboon. 2006. Synthesis and characterization of activated carbon from asphalt. Appl. Surf. Sci. 253 (2):821–826. doi:10.1016/j.apsusc.2006.01.015.
- Katara, S., S. Kabra, A. Sharma, R. Hada, and A. Rani. 2013. Surface modification of fly ash by thermal activation. International Research Journal of Pure & Applied Chemistry : A DR/FTIR study. 3 (4):299–307.
- Kumar, A., B. Prasad, and I. M. Mishra. 2010. Isotherm and kinetics study for acrylic acid removal using powdered activated carbon. J. Hazard. Mater. 176 (1–3):774–783. doi:10.1016/j.jhazmat.2009.11.102.
- Ledoux, M. J., C. Pham-Huu, N. Keller, J.-B. Nougayrède, S. Savin-Poncet, and J. Bousquet. 2000. Selective oxidation of H2S in claus tail-gas over SiC supported NiS2 catalyst. Catalysis Today61:157–163.
- Lee, Y.-W., J.-W. Park, J.-H. Choung, and D.-K. Choi. 2002. Adsorption characteristics of SO2 on activated carbon prepared from coconut shell with potassium hydroxide activation. Environ. Sci. Technol. 36 (5):1086–1092. doi:10.1021/es010916l.
- Manique, M. C., L. V. Lacerda, A. K. Alves, and C. P. Bergmann. 2017. Biodiesel production using coal fly ash-derived sodalite as a heterogeneous catalyst. Fuel 190:268–273. doi:10.1016/j.fuel.2016.11.016.
- Meeyoo, V., D. L. Trimm, and N. W. Cant. 1997. Adsorption-reaction processes for the removal of hydrogen sulphide from gas streams. J. Chem. Technol. Biotechnol. 68 (4):411–416. doi:10.1002/(SICI)1097-4660(199704)68:4<411::AID-JCTB644>3.0.CO;2-9.
- Mohamad Nor, N., L. C. Lau, K. T. Lee, and A. R. Mohamed. 2013. Synthesis of activated carbon from lignocellulosic biomass and its applications in air pollution control—A review. J. Environ. Chem. Eng. 1 (4):658–666. Elsevier B.V. doi:10.1016/j.jece.2013.09.017.
- Mora, R. L. 2000. Sulphur condensation influence in claus catalyst performance. J. Hazard. Mater. 79 (1–2):103–115. doi:10.1016/S0304-3894(00)00193-X.
- Mustafa Arslan, M. B. 1993. The interaction of orthophosphoric acid and fly ash. Resour. Conserv. Recycl. 9:295–310. doi:10.1016/0921-3449(93)90010-D.
- Musyoka, N. M., L. F. Petrik, G. Balfour, W. M. Gitari, and E. Hums. 2011. Synthesis of hydroxy sodalite from coal fly ash using waste industrial brine solution. J. Environ. Sci. Health A Tox. Hazard. Subst. Environ. Eng. 46 (14):1699–1707. doi:10.1080/10934529.2011.623961.
- Musyoka, N. M., L. F. Petrik, G. Balfour, P. Ndungu, W. M. Gitari, and E. Hums. 2012. Synthesis of zeolites from coal fly ash: Application of a statistical experimental design. Res. Chem. Intermediates 38 (2):471–486. doi:10.1007/s11164-011-0364-1.
- Przepiorski, J., S. Yoshida, and A. Oya. 1999. Structure of K2Co3 -loaded activated carbon fiber and its deodorization ability against H2S gas. Carbon 37:1881–1890.
- Salehin, S., A. S. Aburizaiza, and M. A. Barakat. 2016. Activated carbon from residual oil fly ash for heavy metals removal from aqueous solution. Desalin. Water Treat. 57 (1):278–287. doi:10.1080/19443994.2015.1006824.
- Sethupathi, S., M. Zhang, A. U. Rajapaksha, S. R. Lee, N. M. Nor, A. R. Mohamed, M. Al-Wabel, S. S. Lee, and Y. S. Ok. 2017. Biochars as potential adsorbers of CH4, CO2 and H2S. Sustainability 9 (1):1–10. doi:10.3390/su9010121.
- Shafeeyan, M. S., W. M. A. W. Daud, A. Houshmand, and A. Shamiri. 2010. A review on surface modification of activated carbon for carbon dioxide adsorption. J. Anal. Appl. Pyrolysis 89 (2):143–151. Elsevier B.V. doi:10.1016/j.jaap.2010.07.006.
- Shang, G., Q. Li, L. Liu, P. Chen, and X. Huang. 2016. Adsorption of hydrogen sulfide by biochars derived from pyrolysis of different agricultural/forestry wastes. J. Air Waste Manag. Assoc. 66 (1):8–16. doi:10.1080/10962247.2015.1094429.
- Shawabkeh, R., M. J. Khan, A. A. Al-Juhani, H. I. Al-Abdul Wahhab, and I. A. Hussein. 2011. Enhancement of surface properties of oil fly ash by chemical treatment. Appl. Surf. Sci. 258 (5):1643–1650. doi:10.1016/j.apsusc.2011.07.136.
- Shawabkeh, R. A. 2004. Synthesis and characterization of activated carbo-aluminosilicate material from oil shale. Micropor. Mesopor. Mat. 75 (1–2):107–114. doi:10.1016/j.micromeso.2004.07.020.
- Soroushian, F., Y. Shang, E. J. Whitman, G. Garza, and Z. Zhang. 2006. Development and application of biological H2S scrubbers for treatment of digester gas. Water Environ. Found.Proceedings of the Water Environment Federation, WEFTEC 2006: Session 41 through Session 50, pp. 3541–3547.
- Su, H., S. Wang, H. Niu, L. Pan, A. Wang, and Y. Hu. 2010. Mass transfer characteristics of H2S absorption from gaseous mixture into methyldiethanolamine solution in a T-Junction Microchannel. Separation Purif. Technol. 72 (3):326–334. Elsevier B.V. doi:10.1016/j.seppur.2010.02.024.
- Tangjuank, S., N. Insuk, V. Udeye, and J. Tontrakoon. 2009. Chromium (III) sorption from aqueous solutions using activated carbon prepared from cashew nut shells. Int. J. Phys. Sci. 4 (8):412–417.
- Travert, A., O. V. Manoilova, A. A. Tsyganenko, and F. Mauge. 2002. Effect of hydrogen sulfide and methanethiol adsorption on acidic properties of metal oxides : An infrared study. J. Phys. Chem. B 106 (6):1350–1362. doi:10.1021/jp0126762.
- Wang, N. 2010. An investigation of H2S adsorption mechanisms on tire derived rubber particles., (TDRPTM)". Graduate Theses and Dissertations. 11550. Iowa State University,USA.https://lib.dr.iastate.edu/etd/11550
- Wang, Y., A. B. Mohammed Saad, O. Saur, J. C. Lavalley, and B. A. Morrow. 1998. FTIR study of adsorption and reaction of SO2 and H2S on Na/SiO2. Appl. Catal. B 16:279–290. doi:10.1016/S0926-3373(97)00084-2.
- Wee, J.-H. 2013. A review on carbon dioxide capture and storage technology using coal fly ash. Appl. Energy 106 (June):143–151. doi:10.1016/j.apenergy.2013.01.062.
- Wiheeb, A. D., I. K. Shamsudin, M. A. Ahmad, M. N. Murat, J. Kim, and M. R. Othman. 2013. Present technologies for hydrogen sulfide removal from gaseous mixtures. Rev. Chem. Eng. 29 (6):449–470. doi:10.1515/revce-2013-0017.
- Xiao, Y., S. Wang, D. Wu, and Q. Yuan. 2008. Experimental and simulation study of hydrogen sulfide adsorption on impregnated activated carbon under anaerobic conditions. J. Hazard. Mater. 153 (3):1193–1200. doi:10.1016/j.jhazmat.2007.09.081.
- Yaumi, A. L., I. A. Hussien, and R. A. Shawabkeh. 2013. Surface modification of oil fly ash and its application in selective capturing of carbon dioxide. Appl. Surf. Sci. 266 (February):118–125. doi:10.1016/j.apsusc.2012.11.109.