
 ?Mathematical formulae have been encoded as MathML and are displayed in this HTML version using MathJax in order to improve their display. Uncheck the box to turn MathJax off. This feature requires Javascript. Click on a formula to zoom.
ABSTRACT
The United States Environmental Protection Agency (US EPA) flare pseudo-source parameters are over 30 years old and few dispersion modellers understand their basis and underlying assumptions. The calculation of plume rise from the user inputs of pseudo-stack diameter, temperature and velocity have the most influence on air dispersion model predictions of ground-level concentrations. Regulatory jurisdictions across Canada, the United States and around the world have adopted their own approach to pseudo-source parameters for flares; all relate buoyancy flux to the heat release rate, none consider momentum flux and flare tip downwash as adopted by the Alberta Energy Regulator (AER). This paper derives the plume buoyancy flux for flares burning a gas in terms of combustion variables readily known or calculated without simplifying assumptions. Dispersion model prediction sensitivity to flared gas composition, temperature and velocity, and ambient conditions are now correctly handled by the AER approach. The AER flare pseudo-source parameters are based on both the buoyancy and momentum flux, thus conserving energy and momentum. The AER approach to calculate the effective source height for flares during varying wind speeds is compared to the US EPA approach. Instead of a constant source for all meteorological conditions, multiple co-located sources with varying effective stack height and diameter are used. AERMOD is run with the no stack tip downwash option as flare stack tip downwash is accounted for in the effective stack height rather than the AERMOD model calculating the downwash incorrectly using the pseudo-source parameters. The modelling approaches are compared for an example flare. Maximum ground level predictions change, generally increasing near the source and decreasing further away, with the AER flare pseudo-source parameters. It's time to update how we model flares.
Implications: What are the implications of continuing to model flare source parameters using the overly simplified US EPA approach? First, the regulators perpetuate the myths that the flare source height, temperature, diameter and velocity are constant for all wind speeds and ambient temperatures. Second, that it is acceptable to make simplifying assumptions that violate the conservation of momentum and energy principles for the sake of convenience. Finally, regulatory decisions based on simplified source modelling result in predictions that are not conservative (or realistic). The AER regulatory approach for flare source parameters overcomes all of these shortcomings. AERflare is a publicly available spreadsheet that provides the “correct” inputs to AERMOD.
Introduction
The Alberta Energy Regulator (AER) regulates Alberta’s oil and gas industry and has done extensive development of un-combusted and combusted sour gas release dispersion models with spreadsheet interfaces. Sour gas contains hydrogen sulfide (H2S) that is converted to sulfur dioxide (SO2) during combustion. The Energy Resources Conservation Board (ERCB), the predecessor of the AER, developed ERCBH2S to calculate emergency response and planning zones for accidental, un-combusted releases of H2S (ERCB Citation2010) using SLAB. AERflare-incin is a regulatory tool for permitting routine and non-routine operations of sour gas flares and incinerators (AER Citation2014) using the atmospheric dispersion modeling system known as AERMOD developed by the American Meteorological Society and United States Environmental Protection Agency (US EPA) Regulatory Model Improvement Committee.
Flaring of sour gas is associated with sour oil and gas well tests, production, and processing; and upgrading of bitumen and the refining of oil. Sour gas is found in the foothills of the Rocky Mountains and flaring often resulted in predicted exceedances of air quality objectives on the elevated terrain using regulatory modeling approaches adopted from the US EPA. AER required operators to implement an air quality management plan that involved mobile and fixed monitoring in areas of predicted exceedances. Elevated concentrations of SO2 were seldom measured during flare monitoring. Were they monitoring in the right locations based on the meteorology and dispersion modeling? Field observations of flare flame angles and heights during varying wind speeds and flaring rates lead the AER to question the validity of source modeling based on a constant effective source height. Flame models developed for assessing ground-level thermal radiation from flares were initially used to estimate the effective stack height at average wind speed and ambient temperature conditions for input into screening dispersion models. The AERMOD model allows for both multiple sources and time-varying emissions, thus allowing variations in physical heights and diameters and emissions parameters. The effective stack height depends on the flared gas momentum relative to the momentum of the wind and will be higher at low wind speeds and lower at high wind speeds. The AER effective stack height changes result in more realistic flare source modeling.
Regulatory jurisdictions across Canada, the United States, and around the world have adopted their own approach to pseudo-source parameters for flares; all relate buoyancy flux to the heat release rate, and none consider momentum flux and flare tip downwash as adopted by the AER. This article examines the inputs to dispersion models starting with the buoyancy and momentum flux and the assumptions made to simplify the calculations. It then discusses the effective stack height and pseudo-source parameters for flares that allow for combustion as the gas exits the flare tip. Implementing multiple pseudo-sources for a flare is described. A comparison is then made between the current US EPA and the AER approach on pseudo-source inputs and predicted concentrations using AERMOD Version 18081.
Source buoyancy flux
Briggs (Citation1984) developed the volume flux of buoyant acceleration Fbs for a density difference at the source:
where Fbs (m4/sec3) is the source buoyancy flux, g (9.806 m/sec2) is the gravitational constant, ρa (kg/m3) is the ambient air density, ρs (kg/m3) is the source gas density, Qs (m3/sec) is the source volume flow rate, Ta (K) is the ambient temperature, Ts (K) is the source temperature, Ms (kg/kmol) is the source molar mass, Ma (kg/kmol) is the air molar mass, Ds (m) is the source diameter, and Vs (m/sec) is the source velocity---all at flowing conditions. The assumption made in the approximate equation used within AERMOD (US EPA Citation2017) is that Ms = Ma, which may be a reasonable approximation for hot stack gases with excess air.
For flares, the flowing conditions are at Ts and Ps (kPa), with Ps = Pa the atmospheric pressure. Fbs does not change with Pa since it cancels out of the density ratio, but it is sensitive to the temperature ratio. Note that Vs is referenced to Pa. By definition, this is the buoyancy flux at the source that will change as air is entrained, as shown later.
For a flare, the temperature, velocity and diameter of the combusted gases are not readily available. However, we know the energy of the hot plume, as shown by Briggs (Citation1969) and Beychok (Citation2005):
where the new variables are: Ha (J/sec) is the source enthalpy rate of the combusted flare gas relative to the air temperature, ṁs (kg/sec) is the source mass flow rate, and Cps (J/(kg∙K)) is the source average specific heat from Ts to Ta on a mass basis. The heat of the plume is approximated using the product of ṁf (kg/sec) the un-combusted flare gas mass flow rate, NHV°f (J/kg) the net heating value on a mass basis of the flare gas relative to reference conditions (15°C and 101.325 kPa in the oil and gas industry), and ηplume the fraction of heat released to the plume. Note that ηplume is equal to the (combustion efficiency*(1-radiation heat loss)). The US EPA (Citation1986) uses a value of 45% (55% of the heat that could be released is lost due to incomplete combustion and radiation losses) based on a study done in Alberta where oil was injected into a sour gas flare to make the black smoky plume visible to measure the plume rise (Leahey and Davies Citation1984). Further manipulation of Equations 1 and 2 and introducing the ideal gas law leads to the equation used by US EPA (Citation1986) for modeling flares:
where the new variable is Ru (8.3145 (kPa m3)/(K∙kmol)) the universal gas constant. The simplifying assumptions made are that Ms = Ma, Cps = Cpa and that NHV°f is used to approximate the plume enthalpy relative to ambient conditions. At ambient temperature, Cps ≈ Cpa, but the average Cps increases with temperature. Fbs now changes with Pa, but it is not too sensitive to Ta, as will be shown later. Note the ambient pressure affects the buoyancy but is set to the reference pressure in the US EPA approach, probably to match NHV°f, which is at reference conditions. Since buoyancy is on a volume basis, Fbs will increase as the atmospheric pressure decreases. When used with Equation 1 for Fbs in the dispersion model, Ta is allowed to vary hour-by-hour, which changes buoyancy flux and thus the rise. To define Ha without simplifying assumptions, a combustion energy balance must be done.
Plume buoyancy flux
In the earlier AER work on un-combusted H2S dispersion, the plume buoyancy flux equation was derived from the conservation principles to determine the buoyancy flux of cold, high-velocity releases from sour gas well blow-outs and pipeline ruptures that contain aerosols (Wilson Citation2010). In the limit, as infinite ambient air is added to the source, the plume buoyancy flux is
where the new variable is Fbp (m4/sec3) the plume buoyancy flux. The source mass flow rate includes excess air if this was a traditional stack exit or the end of a flame. Average specific heats between Ts and Ta must be used. Ts is the effective stagnation source temperature (static temperature plus temperature increase due to kinetic energy minus temperature reduction for vaporizing the aerosol fraction). This equation can be shown to be equivalent to Briggs (Citation1975) early work where Ts is defined as the total temperature (which includes the kinetic energy). If it is assumed that Ms = Ma and Cps = Cpa, then the plume buoyancy (Equation 4) reduces to the source buoyancy (Equation 1). It can be shown that buoyancy flux does change from the source to downwind in the plume, but only by a few percentage points.
The following expression for Fbp was derived by the lead author starting from Equation 4 to eliminate Ts by doing an energy balance (AER Citation2011). It is dependent on the flare flow rate divided by the site atmospheric pressure times a constant and the sum of five terms:
where the new variables are: Cpf (J/(kg∙K)) is the mass-specific heat of the flare gas, Rs/f is the stoichiometric exhaust to fuel mass ratio, Mstoich (kg/kmol) is the stoichiometric molar mass of the exhaust products, Cpstoich (J/(kg∙K)) is the stoichiometric mass specific heat of the exhaust products, and T0 (K) is the reference temperature for the net heating value.
This solution for the buoyancy flux of a combustion source is applicable to a flare or a stack exit. Notice that Fbp is independent of the excess air and only the stoichiometric combustion properties are required. This equation confirms that one cannot increase the buoyancy of a hot stream relative to the ambient air by adding excess air through entrainment. Equations 4 and 5 give the same result for Fbp if the calculations are done correctly.
The first term in the bracket is Fbs given by Equation 3 when multiplied by the common unit term. It represents the energy released to the plume by the fuel relative to reference conditions with the process and radiation losses accounted for. The AER sets ηplume for a flare based on a literature review that recommended 25% radiation losses for flare dispersion modeling (AENV Citation2000) in Alberta, but the user can override the default. AERflare also includes the flare combustion efficiency due to incomplete conversion (Kostiuk, Johnson, and Thomas Citation2004). The first term is the dominant contributor to buoyancy. Four of the five terms are relative to T0 used to define NHV°f. The last four terms change Fbp about 1% from Fbs for typical methane flare exhaust products but should not be ignored, because of their dependence on Ta.
The second term represents the sensible energy due to the fuel. This term is zero when Tf = T0. The AER default value for Tf is Ta, but Tf can be set by the user. The third term allows for the difference in molar mass of the stoichiometric exhaust stream and the air. For methane combustion, Rs/f is about 18.2 and (Ma/Mstoich – 1) is about 0.044 so the product is about 0.81, which is then multiplied by Ta. For extremely sour gas or acid gas flaring, the buoyancy can be reduced by this term if the sulfur dioxide and/or carbon dioxide concentration are high enough such that Mstoich > Ma. The fourth term allows for the difference in specific heats between T0 and Ta. Average specific heats on a mass basis between Tstoich and T0 for the source and between Ta and T0 for the air must be used. For methane combustion, Rs/f is about 18.2 and (Cpstoich/Cpa – 1) is about 0.22, so the product is about 3.9, which is then multiplied by (Ta – T0). The fifth term is the difference in temperature between Ta and T0 and if they are equal it is zero.
For a flare or other combustion device that uses ambient air, we can see that by assuming Ma = Mstoich, Cpa = Cpstoich, and Tf = T0, Fbp is a very weak function of ambient temperature Ta given by the fifth term as the first term is very much larger and only changes slightly with Cpa. With Ta = T0, Equation 5 for Fbp is the same as Equation 4 for Fbs.
To illustrate using the AERflare spreadsheet, say Fb is 100 for a reference and ambient temperature of 15°C for the combustion of methane with 55% heat loss. The simplified US EPA approach yields an Fbs of 105.2 at −40°C ambient and 97.6 at 40°C ambient with constant Ts of 1000°C. The refined approach yields Fbp of 100.5 at −40°C ambient with a calculated Ts of 538°C and Fbp of 99.7 at 40°C ambient with a calculated Ts of 608°C. Fbp is essentially constant with ambient temperature for the refined approach. Also note the difference in temperatures between the source and ambient varies only 10°C from 578 to 568°C using the refined approach compared to 80°C from 1,040 to 960°C for the simplified approach for ambient temperatures of −40 to 40°C, respectively. The energy balance confirms that a flare ingesting air at −40°C will not be as hot as one ingesting air at 40°C, assuming a constant heat loss fraction.
First, the US EPA assumed source temperature of 1,000°C is too high for a methane flare with such high heat losses. Ts is estimated for any flared gas composition assuming constant air properties in the AERflare spreadsheet (635°C in this example) as a starting guess for the iterative solution of the temperature. Second, for flares or other combustion device that consume ambient air and do not have an exit temperature controller, the modeled source temperature should not be held constant as the ambient temperature changes. As demonstrated in the previous paragraph, a better approximation is holding the difference between the source and ambient temperature constant, rather than the source temperature constant.
Source momentum flux
Briggs (Citation1969) defines Fms (m4/sec2) as the source momentum flux:
where the variables have been previously defined. The last term of Equation 6 is an approximation assuming Ms = Ma and is used within AERMOD (US EPA Citation2017). Note that Fms varies directly with the temperature ratio.
The momentum of a flare starts with the un-combusted source gas exiting the flare tip. As air is entrained the mixture velocity decreases to conserve momentum, flare gas burns and the density of the mixture of combustion products and un-combusted flare gas decreases as the temperature increases until all of the flared gas is burned. To be conservative, this increase in momentum due to the hot gases is ignored in the current AER approach and the flare gas momentum is conserved from the flare tip to the end of the combustion zone. The flare gas momentum flux Fmf (m4/sec2) is
where the new variables are: Vf (m/sec) is the flare gas exit velocity, Qf (m3/sec) is the flare volume flow rate, ρf (kg/m3) is the flare gas density all at flowing conditions, ρa (kg/m3) is the density of the ambient air, Mf (kg/kmol) is the flare gas molar mass, and Df (m) is the flare tip diameter. Note that Fmf varies directly with the temperature ratio which is set by the user. With the AER default of Tf = Ta the ratio is one.
Flare pseudo-source parameters
Dispersion models require the input of the stack source Ts, Vs, Ds, and the height hs. For a flare, pseudo-source parameters (Vs*, Ds*, Ts*, and hs*) are used. AERMOD calculates the buoyancy flux using Equation 1 and the momentum flux using Equation 6 based on the input Vs*, Ds*, and Ts* along with hs* to determine the initial plume trajectory and the final plume rise. Ta is known and varies hourly. Pseudo-parameters should not be used for stack tip downwash adjustments.
The US EPA approach for flares uses the buoyancy flux Fbs defined by Equation 3. With one equation and three unknown variables, two of the variables must be specified, and then the third one can be solved. The US EPA (Citation1986) assumes Ts* of 1,273 K and Vs* of 20 m/sec, then calculates Ds* based on Equation 1 from:
Since momentum flux is not considered by the US EPA approach, it is not conserved. With older US EPA dispersion models, this did not matter as the plume was placed at the final rise which was the maximum plume rise due to buoyancy or momentum, and buoyancy rise dominates for flares.
The AER approach considers both buoyancy flux using Fbp defined by Equation 5 and momentum flux Fmf defined by Equation 7. With these two equations and three unknown variables, one of the variables must be specified and then the other two can be solved for. The AER calculates Ts* for each Ta, then calculates Vs* from:
Notice that both momentum and buoyancy are considered. Similar to Equation 8, Ds* is then calculated from:
To illustrate momentum conservation, flaring pure methane results in an exhaust to fuel mass ratio of about 35 that is about 3 times hotter than the ambient temperature. To conserve momentum as the plume mass increases and heats up due to combustion, the stack velocity Vs* decreases to about (Vf/35) x 3, or about 1/10 of the flare tip exit velocity Vf. With Vs* being 10% of the flare tip velocity, the required diameter Ds* is very large to allow for the entrained air but conserves mass, momentum and energy.
The AER is often asked by modelers how realistic these inputs are in comparison to the US EPA inputs? First, the US EPA inputs are assumed to have some real physical meaning, but they too are pseudo-parameters! AER pseudo-parameters are calculated from energy and momentum balances for the sole purpose of calculating Fb and Fm correctly within the dispersion model. These are not real values, they are pseudo-source parameters that the dispersion model needs to conserve buoyancy and momentum: picture them as a horizontal slice across a flame tip to represent a vertical stack exit. Ideally, regulators should modify the dispersion model to allow flare sources at random angles to the horizontal with much smaller diameters and larger velocities representing reality, to avoid the need of using pseudo-parameters.
Effective stack height and stack tip downwash
The current flare flame length is based on the total heat released assuming complete combustion and no losses (US EPA Citation1986). The effective height from Beychok (Citation2005) and US EPA (Citation1995) assumes the midpoint of a flame angled at 45 degrees from horizontal and is independent of flare tip exit velocity and wind speed at the flare tip. Stack tip downwash is then calculated based on the ratio of the assumed pseudo-velocity Vs* (20 m/sec) and wind speed Ua at the stack height hs, and the calculated pseudo-diameter Ds*. This stack tip downwash adjustment has no physical basis, but fortunately, it is only invoked when the wind speed exceeds Vs*/1.5 (20/1.5 ~ 13.3 m/sec) and does not approach the maximum correction of 3 times the pseudo-diameter Ds*.
The AER effective height of the flare source is determined by calculating the flame vertical height using the Brzustowski (Citation1974) flame model. As documented in AER (Citation2011), Brzustowski uses a dimensionless lower flammability limit to determine the flame tip position along a dimensionless jet axis and then converts to the vertical and downwind distances using the ratio of flare-tip to cross-wind momentum and the flare tip diameter. The effective height of the flare source hs* (m) is calculated from: the physical height of the flare stack hs; the vertical flame height zL, and the US EPA (Citation2017) stack tip downwash based on the actual flare diameter Df and ratio of Vf and Ua:
Since we are accounting for the flare tip stack downwash outside the model, AERMOD is run with the no stack tip downwash (NOSTD) option in AERflare to prevent false downwash corrections based on the pseudo-diameter and pseudo-velocity.
AERflare multi-source hour-by-hour implementation in AERMOD
The AERflare source calculations cannot be implemented directly within the current version of AERMOD because the variable emission file only varies the emission variables (velocity, temperature, and emissions) and not the physical variables (stack height and diameter). However, AERMOD allows for both multiple sources and time-varying emissions, thus allowing variations in physical heights and diameters and emissions variables. Because meteorology affects both the emission and physical variables leading to flare pseudo-parameters, some simplifications are adopted to implement the AERflare source model in the AERMOD modeling framework.
In principle, the methodology is to represent multiple co-located sources with a single source having an emission for each hour. Instead of trying to model hour-by-hour sources, two simplifications are used. First, the meteorological dataset is reduced by using wind speed increments of 0.5 m/sec and integer temperature increments. This reduces the meteorological variations from 8,760 for a year to a few thousand site-specific unique combinations. Because the spreadsheet is used as the source calculation engine and is relatively slow compared to a coded implementation of the calculations, the reduced meteorological dataset reduces the number of spreadsheet re-calculations. Second, the number of pseudo-sources is reduced by dividing the range of effective stack heights into a convenient number and using the average pseudo-value for each stack height and diameter combination.
The AERflare default number of sources is nine, but it can be changed by the user. The choice of nine sources was determined by observing when the predictions change less while the overall methodology could still be applied relatively computationally quickly.
Comparison of US EPA and AERflare modeling approaches
The effect of the pseudo-source parameters and multiple emission sources is demonstrated in this section. provides the comparison cases that were run through AERflare using the AERSCREEN option. Flat terrain was used in all cases. Land use in the surrounding area is a coniferous forest for the screening meteorology. The elevation was set to sea level to allow the atmospheric pressure to be the reference value (101.325 kPa) in the US EPA approach and to 1,000 m for Alberta (89.877 kPa). Radiation heat loss is set to 55% for the US EPA approach. AERflare predicts the flare conversion efficiency based on the wind speed, flare exit velocity, diameter, and the heating value of the flared gas, and 25% radiation heat loss from the combusted portion to calculate the heat to the plume. The US EPA pseudo-source parameters are based on an ambient temperature of 20°C. The hour-by-hour temperature is used in the dispersion modeling. In Alberta, the screening ambient temperatures vary from −53°C to + 39°C with an average of 5°C.
Table 1. Comparison cases.
The US EPA approach pseudo-parameters are held constant for all hours of meteorology. The delta temperature (DeltaT) mode uses a feature in AERMOD that adjusts the source temperature to a constant delta above the ambient temperature by inputting a negative value (−980) but otherwise use constant pseudo-parameters. The AERflare hour-by-hour mode uses nine different source height and diameter bins that have a null emission rate unless the modeled hour of meteorology is within the bin limits as described in the previous section: then the pollutant emission rate is used with a calculated temperature and pseudo-velocity and pseudo-diameter for that hour of meteorology.
provides the example flaring parameters, dispersion model inputs, and calculated values for the comparison cases. The AERflare default Alberta average wind speed of 3.5 m/sec and ambient temperature of 5°C are used for demonstrating the AER pseudo-parameters in the table. The AER flare temperature is calculated with excess air added so the un-combusted mixture is at the lower flammable limit, which corresponds to the flame model. The US EPA momentum flux is much larger and can be several orders of magnitude larger than reality for flares with exit velocities less than the assumed 20 m/sec.
Table 2. Example flare modeling parameters, inputs, and values for each case.
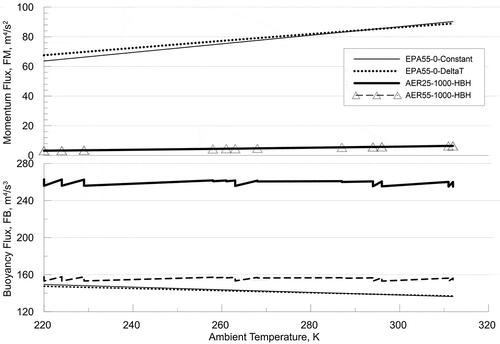
compares how the momentum and buoyancy fluxes for the example flare vary with ambient temperature. The US EPA momentum is arbitrarily set with no regard for conserving momentum while the AER method uses the momentum of the un-combusted gas at the flare tip which is very much less than the US EPA. The EPA55-0-Constant and DeltaT case buoyancy fluxes are about 13% less than the AER55-1000-HBH at 20°C due to the ambient pressure reduction. The buoyancy flux increases in the AER25-1000-HBH case due to the reduced plume heat loss. The irregularities in the AER buoyancy flux lines are due to combustion inefficiency that varies from 99.6% at low wind speeds to 97.5% at high wind speeds. Notice how the EPA fluxes crossover at the assumed reference temperature of 20°C and are sensitive to ambient temperature. The DeltaT approach slightly reduces this sensitivity to the ambient temperature but the high assumed source temperature of 1,273 K dominates the temperature ratios used in the flux calculations.
Figure 1. Comparison of modeled flux changes with ambient temperature.
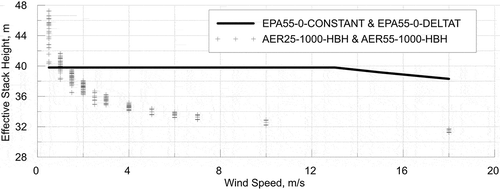
compares how the effective stack height including downwash effects varies with the 10 m reference height wind speed. The 30.5 m high flare stack has a higher, upright flame at low wind speeds and a lower, almost horizontal flame at higher wind speeds. The EPA effective height is constant at 39.8 m until a wind speed of 13.3 m/sec where pseudo-downwash effects are implemented.
Figure 2. Comparison of modeled effective stack heights including stack tip downwash.
compares the maximum predicted ground level concentrations of SO2 as a function of downwind distance from the example flare. The EPA cases predict lower maximum values near field (< 600 m) due to the higher momentum flux than the AER cases, resulting in a more upright initial trajectory. Mid-field (> 600 m and < 3,800 m), the EPA cases predict similar values to the AER55 case even though there is less buoyant rise. The AER25 case has higher buoyancy resulting in lower predictions. Near-field the hour-by-hour approach predicts higher due to lower effective stack heights at high wind speeds and in the mid-field it predicts lower due to higher effective stack heights at low wind speeds. In the far-field (> 3,800 m) the AER55 case predicts lower concentrations due to the higher buoyancy and plume rise but predictions converge due to the common SO2 mass emission rate and thorough mixing in the surface layer. The maximum concentration predictions are used for stack height design and would increase when the AER approach that does not make simplifying assumptions is used.
Figure 3. Comparison of maximum predicted SO2 concentrations.
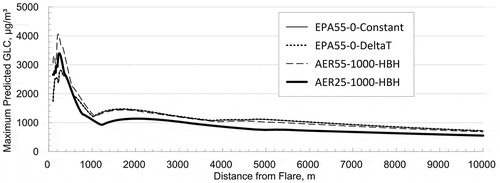
Using the DeltaT source temperature approach with the EPA pseudo-parameters result in almost the same maximum predictions as the constant source temperature approach at elevated ambient temperatures. This is because the assumed source temperature is too high for the assumed heat losses and dominates the temperature ratio, but the colder season predictions did increase.
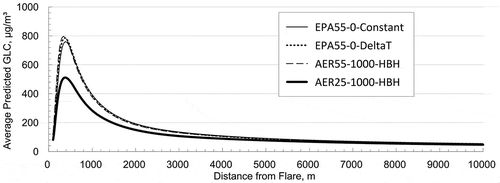
compares the average predicted ground level concentration of SO2 as a function of downwind distance from the example flare. The EPA55-0-Constant case predicts lower average values near field (< 600 m) than the EPA55-0-DeltaT and AER55 case. Beyond 600 m the average predictions are very similar. The AER25 case has higher buoyancy resulting in lower predictions. All predictions converge far downwind due to the common SO2 mass emission rate and thorough mixing in the surface layer. The average concentration predictions are used for long term air quality assessments and increase slightly with the AER55 approach compared to the EPA55-0-Constant approach but are almost the same as the EPA55-0-DeltaT approach.
Figure 4. Comparison of average predicted SO2 concentrations.
Summary
Prediction sensitivity to flared gas composition and temperature, and ambient temperature and pressure are correctly handled by the AER approach. The derived plume buoyancy flux formulation in combustion terms for flares will result in greater flux than simplified source buoyancy flux formulations mainly due to using the atmospheric pressure rather than the reference pressure. The derived formula accounts for the plume energy and molar mass of stoichiometric combustion products. The algorithms reduce to the classical Briggs buoyancy flux used by US EPA when the simplifying assumptions of the plume having the same molar mass and specific heat of the ambient air are made.
The US EPA approach results in the buoyancy and momentum flux calculated in the model being overly sensitive to the ambient temperature. This study shows that for flares or another combustion device that consume ambient air and does not have an exit temperature controller, the modeled source temperature should not be held constant as the ambient temperature changes, rather assuming the difference between the source and ambient temperature is held constant is a better approximation. The US EPA momentum flux needs to be related to the actual flare exit velocity rather than being arbitrarily set.
An attempt was made to adjust the US EPA modeling approach by using a feature in AERMOD that adjusts the source temperature to a constant delta above the ambient temperature by inputting a negative value. This only slightly reduced the buoyancy and momentum flux sensitivity to ambient temperature because the assumed source temperature of 1,273 K is much too high for the assumed heat losses and dominates the ambient to source temperature ratio used in the flux calculations.
The AERflare pseudo parameters are based on conservation of both buoyancy and momentum flux. This approach conserves momentum rather than the US EPA approach of arbitrarily assigning the flare a velocity and thus momentum flux. The effective stack height changes with wind speed based on flare flame models. The AER approach is best applied using an hour-by-hour variation of stack height and stack diameter source parameters and is implemented in AERflare using AERMOD with hourly pseudo-source and emission parameters. The source is characterized by a pseudo-height that takes into account stack tip downwash using the flare tip diameter and exit velocity. AERMOD is, therefore, configured with NOSTD control option when modeling flares using this new method.
Modeling predictions using the AER hour-by-hour method can show increases in predicted ground level maximums near-field due to the more realistic, lower effective stack height at high wind speeds, and lower source momentum that reduces the initial trajectory of the plume, compared to the US EPA approach. AER hour-by-hour mid-field predictions are typically lower than US EPA method predictions because the realistic higher effective stack height at low wind speeds is accounted for. It is time to update the regulatory approach to modeling flares.
The focus of this article is on a flare source model; the authors plan to work on a comparison of predicted to observed flaring concentrations in the near future for publication.
Acknowledgments
This work was done with the support of the Alberta Energy Regulator, Zelt Professional Services Inc. and the Petroleum Technology Alliance Canada--Alberta Upstream Petroleum Research Fund.
Additional information
Notes on contributors
Michael J. Zelensky
Michael J. Zelensky is an air quality advisor in the Science and Evaluation Branch of the Alberta Energy Regulator in Calgary AB, who derived the equations and developed the concepts of the AERflare-incin regulatory tool.
Brian W. Zelt
Brian W. Zelt is the principal of Zelt Professional Services Inc. in Okotoks AB, who coded the equations and calculation routines to run AERMOD and process the output within the AERflare-incin spreadsheet tool.
References
- AENV. 2000. Heat radiation from flares. Guigard, S. E., W. Kindzierski and N. Harper. Edmonton: Alberta Environment.
- AER. 2011. Dispersion modelling exit parameters for flares. Zelensky, M. Calgary: Alberta Energy Regulator.
- AER. 2014. AERflare user guide: A model for temporary flaring permits, non-routine flaring and routine flaring air dispersion modelling for Sour gas facilities version 2.01. Calgary: Alberta Energy Regulator. http://auprf.ptac.org/air/phase-ii-non-routine-flaring-modeling-tool-development Current regulatory version of spreadsheet: http://aer.ca/rules-and-regulations/directives/directive-060. Latest updated version of spreadsheet: http://zeltpsi.com/aertools.html .
- Beychok, M. R. 2005. Fundamentals of stack gas dispersion, 4th ed. Newport Beach: Beychok.
- Briggs, G. A. 1969. Plume rise. USAEC Critical Review Series TID-25075. National Technical Information Service, Springfield.
- Briggs, G. A. 1975. Plume Rise Predictions. In Lectures on air pollution and environmental impact analyses, ed. D. Haugen, 59–111. Boston, MA: American Meteorological Society
- Briggs, G. A. 1984. Plume rise and buoyancy effects. In Atmospheric science and power prediction, Chapter 8, ed. D. Randerson, 317–66. Springfield.
- Brzustowski, T. A. 1974. A model for predicting the shapes and lengths of turbulent diffusion flames over elevated industrial flares. Waterloo: Thermal Engineering Group Department of Mechanical Engineering University of Waterloo.
- ERCB. 2010. ERCBH2S: A model for calculating emergency response and planning zones for sour wells, sour pipelines, and sour production facilities, volume 1: Technical reference document, version 1.20. Calgary: Energy Resources Conservation Board.
- Kostiuk, L., M. Johnson, and G. Thomas. 2004. Flare research project. Final Report, University of Alberta, Edmonton.
- Leahey, D., and M. J. E. Davies. 1984. Observations of plume rise from sour gas flares. Atmos. Environ. 18 (5):917–22. doi:10.1016/0004-6981(84)90067-2.
- US EPA. 1986. Correspondence: Koerber-Wilson: Procedures for Modelling a Flare. https://www3.epa.gov/ttn/scram/guidance/mch/new_mch/R396_KOERBER_6_OCT_86.pdf.
- US EPA. 1995. SCREEN3 model user’s guide EPA-454/B-004. Research Triangle Park: Office of Air Quality Planning and Standards, Air Quality Assessment Division.
- US EPA. 2017. AERMOD model formulation and evaluation EPA-454/R-17-001. Research Triangle Park: Office of Air Quality Planning and Standards, Air Quality Assessment Division.
- Wilson, D. J. 2010. Variation of Buoyancy flux in a high-velocity jet with air entrainment and droplet evaporation. ERCBH2S: A Model for Calculating Emergency Response and Planning Zones for Sour Wells, Sour Pipelines, and Sour Production Facilities Volume 1 Technical Reference Document Version 1.20. Chapter 3 Appendix B. Calgary: Energy Resources Conservation Board.