
ABSTRACT
Dhaka, the capital of Bangladesh, is among the most polluted cities in the world. This research evaluates seasonal patterns, day-of-week patterns, spatial gradients, and trends in PM2.5 (<2.5 µm in aerodynamic diameter), PM10 (<10 µm in aerodynamic diameter), and gaseous pollutants concentrations (SO2, NO2, CO, and O3) monitored in Dhaka from 2013 to 2017. It expands on past work by considering multiple monitoring sites and air pollutants. Except for ozone, the average concentrations of these pollutants showed strong seasonal variation, with maximum during winter and minimum during monsoon, with the pollution concentration of PM2.5 and PM10 being roughly five- to sixfold higher during winter versus monsoon. Our comparisons of the pollutant concentrations with Bangladesh NAAQS and U.S. NAAQS limits analysis indicate particulate matter (PM2.5 and PM10) as the air pollutants of greatest concern, as they frequently exceeded the Bangladesh NAAQS and U.S. NAAQS, especially during nonmonsoon time. In contrast, gaseous pollutants reported far fewer exceedances throughout the study period. During the study period, the highest number of exceedances of NAAQS limits in Dhaka City (Darus-Salam site) were found for PM2.5 (72% of total study days), followed by PM10 (40% of total study days), O3 (1.7% of total study days), SO2 (0.38% of total study days), and CO (0.25% of total study days). The trend analyses results showed statistically significant positive slopes over time for SO2 (5.6 ppb yr−1, 95% confidence interval [CI]: 0.7, 10.5) and CO (0.32 ppm yr−1, 95% CI: 0.01, 0.56), which suggest increase in brick kilns operation and high-sulfur diesel use. Though statistically nonsignificant annual decreasing slopes for PM2.5 (−4.6 µg/m3 yr−1, 95% CI: −12.7, 3.6) and PM10 (−2.7 µg/m3 yr−1, 95% CI: −7.9, 2.5) were observed during this study period, the PM2.5 concentration is still too high (~ 82.0 µg/m3) and can cause severe impact on human health.
Implications: This study revealed key insights into air quality challenges across Dhaka, Bangladesh, indicating particulate matter (PM) as Dhaka’s most serious air pollutant threat to human health. The results of these analyses indicate that there is a need for immediate further investigations, and action based on those investigations, including the conduct local epidemiological PM exposure-human health effects studies for this city, in order to determine the most public health effective interventions.
Introduction
The Dhaka metro area is considered one of the most polluted cities in the world, at 82 µg/m3 annual average PM2.5 concentration from a wide variety of pollution sources (Health Effects Institute Citation2017). According to a World Health Organization (WHO) report on outdoor air pollution, Dhaka ranked as the third most polluted city among the megacities with at least 14 million people (WHO Citation2016). The reason for the upswing in pollution level in Dhaka is due to unplanned urbanization, industrialization, and motorization. Brick kiln operations in and around Dhaka are responsible for a large share of Dhaka’s air pollution, and they have been estimated to account for 58% of total fine particulate matter PM2.5 pollution, followed by motor vehicles (10.4%), road dust (7.70%), fugitive Pb (7.63%), soil dust (7.57%), biomass burning (7.37%), and sea salt (1.33%) (Begum et al. Citation2014). The developed countries in North America and Europe have reduced daily and annual air pollution concentration significantly (Parrish et al. Citation2011), but in the developing countries like Bangladesh still emit high levels of PM2.5 into the atmosphere.
In last 15 years, the Bangladesh government implemented several mitigation strategies, such as introducing cleaner technologies for brick production (VSBK or hybrid Hoffman kilns or zigzag habla kilns) and emissions reduction from vehicles to improve the air quality (ESMAP Citation2011). Lead (Pb), a major pollutant of concern, was phased out from gasoline in 1999 (Biswas et al. Citation2003). In 2003, the Bangladesh government banned two-stroke engines in Dhaka. Before that, traffic contributed more than 50% of PM2.5 in Dhaka, and it was believed that two-stroke engines were the major source of traffic pollution (Begum, Eugene Kim, and Hopke Citation2004). Due to rapid industrial growth and urbanization, the number of brick kilns is skyrocketing, which plays an outsized role (58%) in the spread of air pollution in Dhaka. According to the Bangladesh Brick Makers Owners’ Association, there are around 8,000 registered and unregistered brick kilns in Bangladesh, with around 1,000 brick kilns spread across the greater Dhaka region (Guttikunda, Begum, and Wadud Citation2013). As part of reducing emission from the brick kilns, in 2011, the Bangladesh Department of the Environment (DoE) aimed at upgrading the existing brick-making model to a zigzag kiln design, which is more efficient and could potentially reduce particulate matter emissions vehicles (CASE Citation2011; ESMAP Citation2011).
Based on the country-level populations and pollution data, about 92% of the world’s population lived in areas that exceeded the WHO 10-μg/m3 guideline, and about 86% of populations in China, India, Pakistan, and Bangladesh are exposed to the most extreme level (i.e., above 75 μg/m3) of pollution concentration (Health Effects Institute Citation2017). In Asia, some other major, severely polluted (annual PM2.5 concentration greater than 75 μg/m3) cities in China are Beijing, Shijiazhuang, and Jinan; in India are Delhi, Kanpur, and Patna; and in Pakistan are Karachi, Peshawar, and Lahore (Gorai et al. Citation2018; Sánchez-Triana et al. Citation2014; Zhao et al. Citation2016). These cities have experienced excess particulate matter air pollution due to rapid economic growth driven by combustion of fossil fuels and rapid urbanization.
One previous study reported the trend of air pollution in Dhaka (Begum and Hopke Citation2018), but this study was limited to particulate matter air pollution only. Furthermore, the study considered data from only one sampling site, and the data of this sampling site did not represent the actual pollution scenario in Dhaka, as the reported fine particulate matter concentration is far below that reported elsewhere for Dhaka (e.g., 40 μg/m3 vs. 80 μg/m3) (Department of Environment Citation2016; Health Effects Institute Citation2017; WHO Citation2016). In this new work, we expand the past work to encompass multiple monitoring sites in Dhaka, as well as multiple air pollutants.
The spatiotemporal analysis of air pollution is essential to know the present pollution pattern and to adopt opportune mitigation strategies. In this present study, particulate matter (PM2.5 and PM10) and gaseous pollutants (SO2, NO2, CO, and O3) monitored by Bangladesh Department of the Environment (DoE) from 2013 to 2017 were analyzed to investigate spatiotemporal variations, day of week variation, and trend across the Dhaka metropolitan area. The diurnal cycles were also reported for the first time for the Dhaka Metro area. The diurnal variation of criteria air pollutant is limited to the year 2017, as the hourly pollution concentration data are not available for the 2013 to 2016 period. This study also assesses the correlation between air pollutants at each site. In preparation for health effect analysis, this is the first study in Bangladesh that investigated the exceedances of Bangladesh National Ambient Air Quality Standards (NAAQS) and U.S. NAAQS for each pollutant to identify the pollutants of concern in the Dhaka Metropolitan area.
Dhaka pollution sources
As the capital of Bangladesh, Dhaka is the center of all economic, political, and cultural activities, and has been growing rapidly with the race of global urbanization and modernization. Dhaka City is also the fourth most densely populated city in the world, with a population density of about 28,000/km2 (Bangladesh Bureau of Statistics Citation2014). The Dhaka metropolitan area (Greater Dhaka) incorporates the districts of Dhaka, Gazipur, Narayanganj, and Narsigndi. The major fuel for brick kilns industry in Bangladesh is coal, and wood is used as a secondary fuel (Sajan et al. Citation2017). Heavy-duty vehicles mostly use high-sulfur diesel fuel. The road dust and soil dust are a result of the unplanned construction of the highways, flyover, and building. Brick kilns are one of the seasonal industries in Dhaka that run only in the dry season. The peak time for brick production is November–March. The other reasons for high concentration during winter could be the long-range transport of fine particles and poorer dispersion conditions in the winter. In 2013, brick kilns industries emitted 53,333 tons of PM10 and 59,221 tons of SO2 in Dhaka, which account for 91.1% and 98.3% of the total annual PM10 and SO2 emissions, respectively (Randall et al. Citation2015). This brick kiln industry emission source is seasonal, however, as the kilns largely close during the monsoon season.
The traffic sector is the major source of NOx emissions in Greater Dhaka, accounting for some 58.6% of the total annual NOx emissions, followed by industrial sources, which account for 15.7% of the total annual NOx emissions. The CO emissions in Greater Dhaka are also dominated by mobile sources, which contribute 40.5% of the total CO emissions, followed by fossil fuel (27.1%), and industrial emissions including brick kilns (16.4%) (Randall et al. Citation2015). Dhaka City is congested with a large number of motor vehicles, including local transport buses, long route buses, diesel-run local passenger vans (locally called “Leguna”), passenger cars, commercial vans, private cars, compressed natural gas (CNG)-run auto-rickshaws, and heavy-duty diesel-powered lorry trucks for the shipment of garment products. Most of the vehicles use high-sulfur diesel; other fuels used are gasoline and natural gas. The local city buses are the major mode of mass public transportation in Greater Dhaka. According to the Bangladesh Road and Transport Authority (BRTA), there were 1 million registered motor vehicles in September 2016 in Greater Dhaka. It is estimated that another 400,000 unregistered motor vehicles are also operating on the roads of Dhaka. Most of these motor vehicles are decades old and unfit for the road, polluting the environment severely (Ahmed and Mahmood Citation2011). Poor engine condition of these buses is responsible for high traffic pollution in Dhaka City, as they cannot complete the combustion of fuel properly, which causes them to emit a high concentration of BC, CO, NOX, and SOX.
Monsoon as a factor
In Bangladesh, the climate is subtropical monsoon (summer monsoon), which is characterized by seasonal increases in rainfall, high temperatures, and humidity. Monsoon plays important role in differentiating one season from another in many ways, including with respect to air pollution exposures. Meteorologically, there are four seasons in Bangladesh: pre-monsoon (March–May), monsoon (June–September), postmonsoon (October–November), and winter (December–February) (Salam et al. Citation2003). The winter in Bangladesh is defined as the dry season because of the dry soil conditions, low rainfall, and low relative humidity. During the winter season, there are weak northwesterly prevailing winds in Bangladesh. During the premonsoon season, the rainfall, relative humidity, and wind speed start increasing when the prevailing wind becomes southwesterly. The rainfall, relative humidity, and wind speed decrease in the postmonsoon season, and the wind direction starts to shift back to northeasterly (Begum, Hopke, and Markwitz Citation2013). In Dhaka, the rain associated with the monsoon season is a major meteorological influence on the air pollution levels. Weather conditions are known to be one of the major driving forces of varying the concentration of air pollution (Jacob and Winnerb Citation2009). The emissions, dilution, transport, chemical transformation, and the deposition of atmospheric air pollutants are all influenced by meteorological variables, including temperature, humidity, precipitation, wind speed and direction, and mixing height (Kinney Citation2008). For example, rain washes out water-soluble air pollutants and airborne particulate matter. Moreover, temperature also has an impact on forming and dissipating secondary air pollutants in the atmosphere, such as when higher temperatures expedite chemical reactions in the air. It is very well known that the temperature varies with locations and season. The concentration of PM also varies with region and season. Often, seasonal variations of PM10 and PM2.5 have been observed to reach maximums during winter months, though the seasonal variations vary across the regions, depending on variation weather patterns. For example, the variation of PM10 concentration has been found to have a strong seasonal pattern (with peak in summer) in 100 U.S. cities (Peng et al. Citation2005), whereas the PM concentration has been found to be 1.5- to 5-fold increased during winter in Asian countries such as China, India, Bangladesh, and Nepal (Fares Citation2013; He et al. Citation2001; Pant, Guttikunda, and Peltier Citation2016). These variations in seasonal patterns are likely largely due to differences in the extent to which particulate matter is formed by primary (largely winter) or secondary (largely summer) processes.
Description of air monitoring sites
The Department of Environment (DoE) of Bangladesh has set up monitoring to support the nation’s National Ambient Air Quality Standards (BNAAQS) of 65 ug/m3 (24-hr average) for PM2.5, and 150 µg/m3 (24-hr average) for PM10 (Department of Environment Citation2016). Among the three Dhaka metro area continuous air monitoring sites (CAMS) shown in , the Darus-Salam is basically a traffic hotspot, as this CAM is located 100–120 m away from the main busy road (called Mirpur road) inside Dhaka City. Moreover, Darus-Salam station is located near the major long route bus terminals named “Technical,” “Kallyanpur,” and “Gabtoli,” which are the entry points into Dhaka City from the northern part of the country, and is also located at downwind of another traffic hotspot called “Farmgate.” Thus, it is expected that the O3 and NO2 concentrations will be higher in Darus-Salam CAMS than at other monitoring stations.
Figure 1. Locations of continuous air monitoring stations (red dots) in the greater Dhaka metropolitan area.
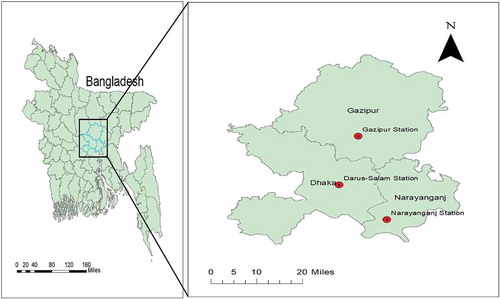
Narayanganj and Gazipur both are characterized as the major industrial zone around the Dhaka. Two rivers run through the Narayanganj district, which facilitates the transportation of industrial raw materials and finished products by waterways. Thus, along with heavy diesel trucks for industrial shipment, brick kilns, long-route buses, and industrial dusts, diesel-run water vessels would have a significance influence on pollution concentration measured at the Narayanganj site. Gazipur station is located at latitude 23º99’N and longitude 90º42’E, inside the Gazipur City corporation graveyard premises. The highest number of brick kilns is located in Gazipur district, followed by Narayanganj and Dhaka (Guttikunda, Begum, and Wadud Citation2013), so the brick kilns would make a significant contribution of PM2.5, SO2, and CO emissions in this district.
Research materials and methods
Air pollution and meteorological data
Particulate matter and gaseous pollutants daily concentrations data for 2013–2017 in Dhaka Metropolitan region were obtained from the Department of Environment (DoE/CASE Project), Bangladesh. Bangladesh Department of Environment (DoE) has started regulating air quality from 2005 through Bangladesh National Ambient Air Quality Standards (BNAAQS) for criteria air pollutants, including particulate matter (PM2.5 and PM10), SO2, NO2, CO, O3, and Pb (Table S5). The continuous air monitoring stations in Dhaka measure the hourly concentration of gaseous pollutants (such as SO2, NO2, CO, and O3) using the principle of multiple on-line gas sensors and measure the particulate matter (PM2.5 and PM10) hourly concentration using beta gauge monitors. The operating principles used for measuring each of these air pollutants are summarized in Table S6. Five continuous air monitoring stations are in operation at Dhaka metropolitan area, including three in Dhaka City, one in Gazipur, and one in Narayanganj. Among three monitoring sites in the Dhaka City area, only the Darus-Salam station has good temporal data coverage (>90%); the temporal data coverage of the other two stations (Farmgate and Sangshad Bhaban) is very low (<50%), and these data are not included in this analysis. The air pollution data of three stations (Darus-Salam site located in Dhaka district, Narayanganj site located in Narayanganj district, and Gazipur site located in Gazipur district) were used for this study. The meteorological data (temperature, humidity, and precipitation) used in this analysis were procured from the Bangladesh Meteorology Department.
Data analyses methods
To investigate the seasonal effect on pollution concentration, the data were considered in four distinct seasons, namely, winter (December–February), premonsoon (March–May), monsoon (June–September), and postmonsoon (October–November). A Student’s t-test was done to test for a significant difference in concentration between monsoon and winter seasons, and significance was defined as p < 0.01. Pearson correlation coefficients were calculated to elucidate the relationships among all monitored parameters, such as air pollutants and weather variables (temperature, humidity, and precipitation), and statistical significance was defined as p < 0.01.
For analyzing the spatial variations of pollution concentration in the Dhaka Metropolitan area in 2013–2017, the inverse distance weighting (IDW) principle was applied for spatial interpolation of the pollutants’ concentration distributions, using the annual and seasonal averages of pollution concentration. In IDW, it is assumed that every point has local influence, which decreases with increasing distance, and the weight of a point differs with the inverse square of the distance (i.e., 1/distance2). However, IDW has a potential shortcoming in that it needs a denser and close network for better results.
As suggested by Hess, Iyer, and Malm (Citation2001) and Hidy et al. (Citation2014), a parametric test (e.g., linear regression) was applied for trend analysis using the annual average concentration of each pollutant as a response variable. A parametric test can be more powerful than a nonparametric test, and can quantify the magnitude of the trend more accurately (McLeod et al. Citation1991). Time-series air quality data often have autocorrelation and a nonnormal distribution (Ott Citation1995). It is more likely that an assumption of independence and normality might not be met by linear trend (parametric) analysis of environmental data (Hess, Iyer, and Malm Citation2001), suggesting that if the annual average is used as the response variable in the regression analysis, the assumptions (normality and independence) could be satisfied. This approach is employed in this study, such that the response variables used for trend analysis are annual and seasonal (i.e., winter, premonsoon, monsoon, and postmonsoon) average concentration for each calendar year.
Results and discussion
Average pollution concentrations, seasonal variation, and exceedances of National Air Quality Standards (NAAQS) in Dhaka Metropolitan area
Particulate matter (PM2.5 and PM10)
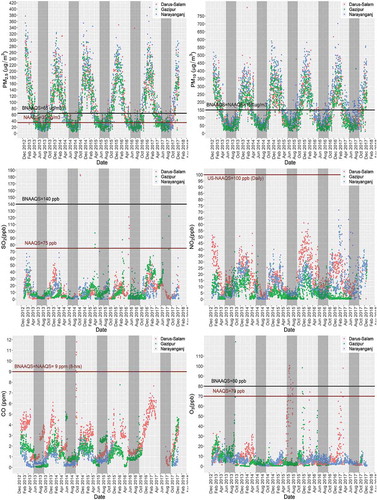
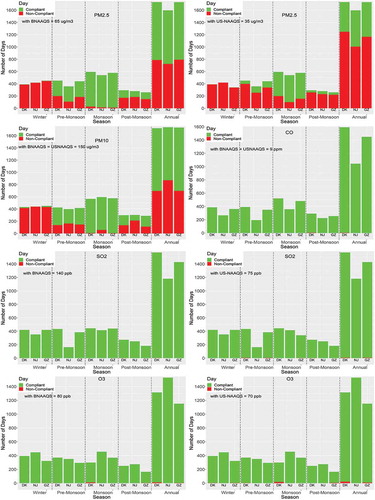
Except during monsoon, the average concentrations of particulate matter (PM2.5 and PM10) in the three monitoring sites exceeded the relatively lax Bangladesh National Ambient Air Quality Standards (150 µg/m3 for PM10 and 65 µg/m3 for PM2.5) in all seasons ( and ). The highest numbers of exceedances of PM2.5 NAAQS limit were found at the Darus-Salam neighborhood (72% of total observations), followed by Gazipur District (67% of total observations) and Narayanganj District (63% of total observations). The highest number of exceedances for PM2.5 in Darus-Salam (Dhaka City) could result from local traffic emissions in all seasons in Dhaka City. The maximum exceedances of PM10 NAAQS limit were observed at Narayanganj (50% of total observations), followed by Darus-Salam District (40.3% of total observations) and Gazipur District (40.2% of total observations). In every day during winter season, particulate matter (PM2.5 and PM10) exceeded both the BNAAQS and NAAQS limits (). The road dust, sand dust, and textile industrial dust could be accounted for highest exceedances for PM10 in Narayanganj. The results from the preceding analysis reveals that PM2.5 is the most major concern among pollutants in Darus-Salam, whereas PM10 is the pollutant of concern in Narayanganj.
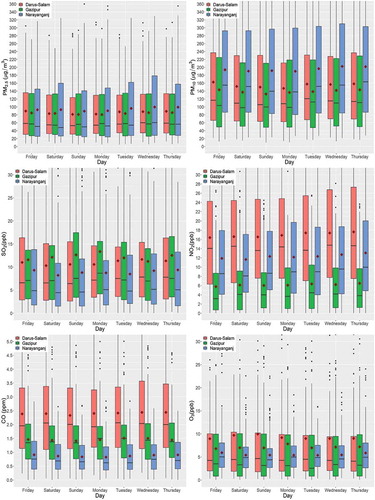
Figure 2. Average annual and seasonal concentrations of pollutants in three sites. The ends of each box are the first and third quartiles. Horizontal line inside the box denotes the median. The diamond red point denotes the mean.
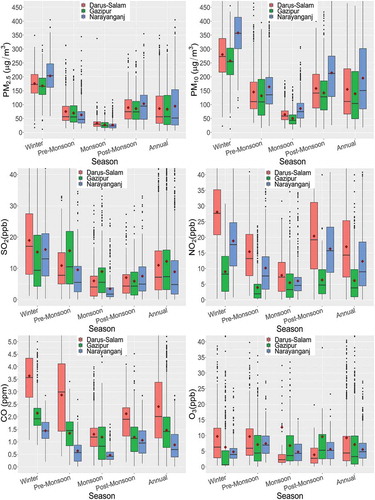
Figure 3. Temporal variation of pollutants concentration with respect to exceedances of BNAAQS and NAAQS limits for each pollutant. The shaded area represents the monsoon season.
During this study period, the annual mean ± SE concentrations of PM2.5 and PM10 were 85.8 ± 1.59 µg/m3 and 154.9 ± 2.59 µg/m3 at Darus-Salam station, 94.4 ± 2.00 µg/m3 and 195.3 ± 3.13 µg/m3 at Narayanganj station, and 83.4 ± 1.56 µg/m3 and 139.1 ± 2.41 µg/m3 at Gazipur station (). Strong seasonal patterns were detected across all three CAMS and the maximum concentration of PM2.5 and PM10 found during wintertime, which reaches as high as two- to threefold compared to BNAAQS. Statistically significant differences in PM pollution concentrations between winter and monsoon were identified at all three sites. The mean ± SE concentrations of PM2.5 during the winter versus monsoon season were much higher in winter than during the monsoon season (175.8 ± 2.44 µg/m3 vs. 32.8 ± 0.79 µg/m3 at Darus-Salam, 203.2 ± 2.92 µg/m3 vs. 26.3 ± 0.61 µg/m3 at Narayanganj, 167.5 ± 1.56 µg/m3 vs. 27.4 ± 0.60 µg/m3 at Gazipur) (). During winter, the lower mixing layer height, including thermal inversions, and the high emissions from brick kiln industries are thought to contribute to the increased PM concentrations. Winter in Bangladesh is considered a dry season with low relative humidity, low wind speed, low temperature, and scant rainfall (Figure S8). Thus, the resuspended road dust and soil dust also amplify the PM concentration during winter.
Table 1. Annual and seasonal mean ± SE (standard error) concentration of air pollutants at three sites in the Dhaka metropolitan area during 2013–2017.
Sulfur dioxide (SO2)
The major source of SO2 in the atmosphere is the burning of fossil fuels, especially at local brick kilns, where coal burning is the main contributor to high SO2 emissions (Randall et al. Citation2015). The diesel fuel used in mobile sources in Bangladesh contains about 3000 ppm sulfur (Begum et al. Citation2014). Thus, the other significant anthropogenic source is the burning of high-sulfur-content diesel fuels in vehicles and power plants. SO2 concentration was not as significant as PM. During the study period, most of the year SO2 concentration was complaint with BNAAQS (140 ppb 24-hr average for SO2). There were only two exceedances of SO2 BNAAQS limit found at Darus-Salam (). Annual SO2 mean ± SE concentrations are fairly low and homogeneous spatially during the study period, as presented in . However, like particulate matter, SO2 concentration showed significant seasonal variation in all three sites (), with the highest levels in winter. The brick kilns are one of the seasonal industries in Bangladesh, running their brick production only in the dry season, as rain interrupts the brick making, brick drying, and brick firing processes, so the brick making operation is carried out primarily during November to June, and not during monsoon season (Sajan et al. Citation2017). Dhaka City is also surrounded by thousands of textile industries. As a result, there is a regular movement of heavy-diesel-fuel lorry trucks for the shipment of garment products ((ICA Citation2011), and most of the heavy-duty vehicles use high-sulfur diesel fuel, which makes a significant contribution to SO2 emissions in the Dhaka metro area.
Figure 4. The number exceedances of BNAAQS and U.S. NAAQS limits for each pollution during 2013–2017. NO2 is not presented in this figure as the annual NO2 concentrations never cross the NAAQS limits. DK, NJ, and GZ stand for Darus-Salam, Narayanganj, and Gazipur monitoring stations, respectively.
Nitrogen dioxide (NO2)
The major source of NO2 pollution in very urban cities such as Dhaka is often motor vehicle exhaust. Other sources may include coal and oil burning in power plants, metal refining industries, and other manufacturing and food processing industries (Department of the Environment and Heritage Citation2005). A high temperature is required for the reaction between nitrogen and oxygen to form NO, and this conditions is found in the combustion of coal and oil at electric power plants, and also during the combustion of fuel oils in automobiles. During the study period, significant seasonal patterns were detected with highest concentration during wintertime and lowest concentration during monsoon time (28.1 ppb vs. 7.8 ppb). In the other two seasons nonsignificant variation in NO2 concentrations was observed (15.4 ppb during premonsoon vs. 20.3 ppb during postmonsoon) ( and ). The distinct difference in NO2 concentration between winter and monsoon season reveals that along with traffic, brick operation during the winter time is also a major contributor to NO2 pollution in Dhaka.
There is no 24-hr average BNAAQS level for NO2. As shown in , the annual NO2 concentrations in all three stations during 2013–2017 did not exceed the U.S. NAAQS level (24-hr average 100 ppb for NO2), which provides a clear message that the NO2 pollution in Dhaka is not as significant as particulate matter pollution.
Carbon monoxide (CO)
The greatest source of ambient CO emissions in Dhaka is the burning of fossil fuels, derived mainly from automobiles, trucks and other vehicles, and oil or coal-fired plants (Randall et al. Citation2015). Significant seasonal variation in concentrations was detected between winter versus monsoon, with peaks in the winter season (). CO was found nonsignificant during the study period. With only four exceedances at Darus-Salam sites, the 8-hr average CO concentration was almost compliant with the BNAAQS value (8-hr average 9 ppm for CO) at all three stations throughout the study time (). Lack of emission control regulations, and also allowing old and unfit vehicles on road, using solid fuels in household cooking, and using coal in brick kilns industries are responsible for increasing CO emissions in Dhaka City. In the case of older vehicles, poor engine conditioning inhibits proper combustion inside the engine cylinder, which emits a high concentration of CO (Reşitoʇlu, Altinişik, and Keskin Citation2015).
Ozone (O3)
Ozone is one of the secondary pollutants, and it is formed when NOx and volatile organic compounds (VOC) emitted by the vehicles, power plants, refineries, boilers, and other sources react chemically in presence of sunlight (Guo Citation2012). The annual mean ± SE ozone concentrations during the study period at Darus-Salam, Narayanganj, and Gazipur CAMS locations were generally very low (9.2 ± 0.34 ppb, 5.5 ± 0.09 ppb, and 7.1 ± 0.26 ppb, respectively). In Bangladesh, the national air quality standard for O3 is 80 ppb (8-hr average). The highest number of exceedances of O3 NAAQS limit was observed at the Darus-Salam site. At Darus-Salam, 12 exceedances of the O3 BNAAQS limit and 22 exceedances of the O3 NAAQS limit were found during this study period. The Narayanganj site was compliant with both BNAAQS and NAAQS limits. Three exceedances of O3 BNAAQS limit and 9 exceedances of O3 NAAQS limit were found at the Gazipur site. In this study period, the O3 pollution in the Dhaka metropolitan area was not therefore indicated to represent as much of a health threat as other pollutants.
Day-of-week and diurnal variation
In the day-of-week analysis, the pollution levels generally follow a common pattern for each day of the week. No particular weekend effect has been identified by this analysis. Fine particulate matter (PM2.5) concentrations were maximum on Friday and coarse particulate matter (PM10) concentrations were maximum on Wednesday (), but these day-to-day variations were not statistically significant (p < 0.05). Similar to particulate matter, a nonsignificant daily variation was found for gaseous pollutants. Very little variation of gaseous pollutants concentration on the day of week could be attributed to the variation of traffic flows in Dhaka City. The “weekend effect,” the main cause of which is the reduction of traffic during the weekends in other parts of the world, was not significant in Dhaka City. While it is expected that local transport services could be reduced on the weekend (Friday and Saturday), the textile shipment delivery trailer trucks were reported to be at a maximum on Friday (Hoque and Ullah Citation2013; Mahmud Khan and Hoque Citation2013), which could compensate for expected reductions in local commuter emissions on Friday, which is a religious observance day of the week in Dhaka.
Figure 5. Day-of-week pollution variation in the Dhaka metropolitan area. The ends of each box are the first and third quartiles. Horizontal line inside the box denotes the median. The diamond red point denotes the mean.
The diurnal patterns of pollution concentration were analyzed in this study based on 2017 data only, as we have no hourly data available for 2013–2016. A strong diurnal pattern was detected at all three sites (, Figure S1, and Figure S2). Other than ozone, pollutants (PM2.5, PM10, SO2, NO2, NOx, NO, and CO) monitored at three sites followed the same diurnal pattern, in which the peak pollution concentrations were observed at night, between 10 p.m. and 9 a.m. The peak ozone pollutant concentrations were found between 2 p.m. and 8 p.m. This is consistent with other studies, because ozone formation is instead usually at a maximum in the middle of the day, when the sunlight is most direct (Masiol et al. Citation2017). Diurnal variations are governed by interplays among the pollution sources, photochemical processes, and weather factors. The diurnal variation of wind in Figure S9 shows that wind speed is way higher during the daytime between 9 a.m. and 6 p.m., with peak at 3 p.m., and lowest at 12 a.m. High pollution concentrations measured between 10 p.m. and 9 a.m. could result from the local rules on traffic flow in Dhaka (as the diesel-powered buses and freight trucks can use the Dhaka City route only at night, between 8 p.m. and 6 a.m.), low mixing height during the night (Geiß et al. Citation2017), and low wind speed during this time span (Figure S9). Long-route buses and any kind of heavy-duty diesel trucks are barred from using any highway inside Dhaka during the daytime (Transport and Board Citation2011).
Figure 6. Diurnal variations of levels of measured pollutants computed over the hourly averaged data in 2017 in Dhaka City (Darus-Salam site).
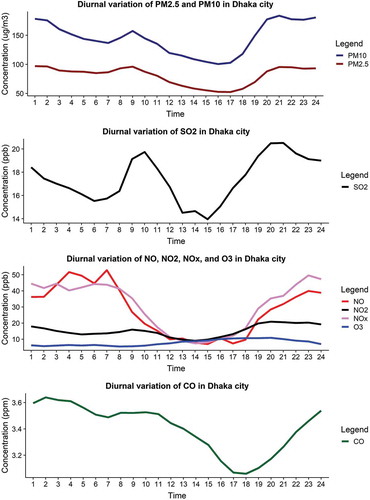
Thus, the diurnal variations in road traffic emissions especially from long-route buses and heavy-duty diesel-run freight trucks are the key factor in emitting high SO2, NO, CO, PM2.5, and PM10 between 10 p.m. and 9 a.m. in Dhaka.
Intrasite correlations among air pollutants
The correlations among air pollutants vary with seasons, as the emissions fluctuated, depending on their seasonal sources. Correlations among air pollutant concentrations during monsoon time are the most different from other seasons. , Figure S3, and Figure S4 show the annual and seasonal correlation among air pollutants and weather variables monitored at Darus-Salam, Narayanganj, and Gazipur sites. In this section, we describe the correlations of other pollutants with only PM2.5, but not with PM10, because PM2.5 is very highly correlated (correlation coefficient > .93) with PM10 (, Figure S3, and Figure S4). Thus, their correlations with other pollutants are almost the same.
Figure 7. Correlation plot by season for air pollutants and weather variables over the study period in Dhaka City (Darus-Salam site). Significance level of correlation between two variables shown at ***p < 0.001, **p < 0.01, and *p < 0.05, respectively.
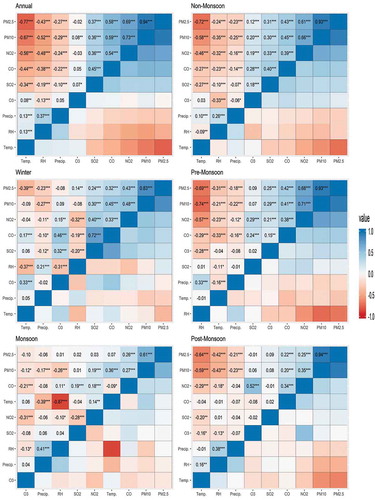
The interpollutant correlations for Dhaka City are shown in . In Dhaka City, PM2.5 was significantly (p value < .001) correlated with PM10, CO, NO2, and SO2 during the monsoon time of the year, whereas during monsoon time PM2.5 was significantly associated only with CO during monsoon time. The on-road traffic could be the same source of both PM2.5 and CO pollution during monsoon time. During nonmonsoon time, the SO2 is highly correlated with NO2 emissions (correlation coefficient equals 0.33), as expected. During nonmonsoon time, traffic was not the only source of NO2 emissions, but rather a significant amount of NO2 was emitted to the atmosphere from the main source of SO2 emissions. The main source of SO2 emissions in Dhaka is brick kilns. Nonconsistent correlations of O3 with other pollutants were observed during 2013–2017. However, during monsoon season a significant negative correlation was observed between these two pollutants (correlation coefficient equals −0.28), suggesting different sources of origin at that time. These results suggest that the traffic emissions dominate pollution during the monsoon season, but the kilns are more dominant in the rest of the year, when they are operating.
Figure S3 presents the correlation between air pollutants at the Narayanganj site, where PM2.5 was highly correlated with CO (correlation coefficient equals 0.74), followed by NO2 (correlation coefficient equals 0.44) and SO2 (correlation coefficient equals 0.40) during the nonmonsoon time. On the other hand, during monsoon season, a statistically significant correlation was found between PM2.5 and CO (correlation coefficient equals 0.57) and NO2 (correlation coefficient equals 0.41), but no correlation was observed between PM2.5 and SO2, as the brick kilns are not in operation during duirng monsoon time. As at Darus-Salam site, the SO2 was found significantly correlated with NO2 (correlation coefficient equals 0.24) during the nonmonsoon time at this site, but no correlation was found during monsoon season. Again, these results suggest that the traffic emissions dominate pollution during the monsoon season, but the kilns are more dominant when they are operating during the rest of the year.
Figure S4 presents the correlation between air pollutants monitored at the Gazipur CAMS. The correlations between air pollutants monitored at the Gazipur site were significantly different from the other two sites, as there was less influence of local sources pollution at this site. During this study time, nonconsistent correlations between SO2 with PM2.5 were observed. In the nonmonsoon time of the year PM2.5 significantly correlated with NO2 (correlation coefficient equals 0.36), and CO (correlation coefficient equals 0.58). As at the other two stations, CO was also significantly correlated with PM2.5 during monsoon season (correlation coefficient equals 0.19). However, no statistically significant correlation was found between SO2 and NO2 in any seasons during this period, suggesting different sources of origin (i.e., industrial vs. traffic).
Effect of the monsoon season on pollutant concentration
The weather conditions are one of the major driving forces varying the concentrations of air pollution over time (Jacob and Winnerb Citation2009). The weather in Bangladesh is dominated by the rainy monsoon season. The results from correlation analysis between air pollutants and weather parameters in all three sites showed temperature negatively correlated with PM2.5, PM10, SO2, NO2, and CO during the nonmonsoon time of the year, whereas during monsoon season the particulate matter concentration significantly increases with increasing temperature (, Figure S3, and Figure S4). The positive significant correlation during monsoon time suggests an increase of road dust with increasing temperature. The effect of temperature on particulate matter may be due to the fact that more favorable atmospheric dispersion conditions occurred under warm air than cold air masses. Moreover, high temperature expedites photochemical reactions in the atmosphere, leading to the formation of secondary particulate matter. O3 showed nonconsistent correlation with temperature throughout the year.
Relative humidity showed a significant (p value < .001) negative correlation with particulate matter (PM2.5 and PM10) in all seasons (, Figure S3, and Figure S4). This result is very consistent with previous studies that showed that high relative humidity (>70%) played a significant role in reducing particulate matter concentration (Li, Feng, and Liang Citation2017; Lou et al. Citation2017). The hygroscopic nature of particles could be another reason for negative correlation of coarse particles with relative humidity (RH) in all seasons. Humidity decreases the possibility of resuspended soil particulate by making the soil humid, hence decreasing the mass concentration of the atmospheric particulate (Owoade et al. Citation2012). Due the hygroscopic nature of fine particles (PM2.5), PM2.5 concentration increases when the relative humidity is low. On the other hand, when relative humidity is too high (80%) fine particles grow very rapidly and become heavy particles. When the dry deposition occurs, heavy particle fall to the ground, and hence PM2.5 concentrations decreases (Wang and Ogawa Citation2015).
Study showed that the washing out effect of rain on particulate matter (PM2.5 and PM10) reduces their concentration in the atmosphere (Ouyang et al. Citation2015). As expected, rain showed a significant (p value <.05) negative correlation with PM2.5, PM10, SO2, NO2, and CO. The negative correlation likely results in large part from shutting down the biggest sources of pollution, such as brick kilns, during the monsoon to avoid rainfall.
Intersite correlations
The coefficients of determinations (r-squared) were calculated for each pollutant to explain the intersite correlations (). With the highest between Darus-Salam and Gazipur (r2 = 0.90), significant high correlations (r2 ≥ 0.84) of PM2.5 were observed among the Darus-Salam, Narayanganj, and Gazipur sites. Like PM2.5, coarse particles (PM10) showed a significant high correlation (r2 = ~0.80) between the three sites. These results suggest that particulate matter distribution in the Dhaka metropolitan area is almost homogeneous. The small variation of particulate matter concentration could be attributed to local sources of pollution and variation of traffic patterns within the regions.
Figure 8. Intersites correlations of air pollutants in Dhaka metropolitan area.
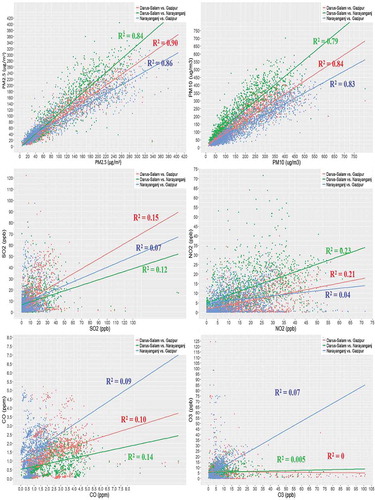
The SO2 and O3 pollution showed many nonhomogeneous spatial distribution patterns, with no site-to-site correlations (). Ozone generally forms downwind of a traffic hotspot area, so wind direction is another factor that has a significant influence on the spatial distribution of ozone concentrations. The SO2 pollution is very much driven by the local sources, such as brick kilns and diesel heavy-duty trucks.
NO2 and CO follow a nonsimilar spatial distribution pattern as the intrasite correlation is not high. Among the three sites, the highest correlation for NO2 was observed between Darus-Salam and Narayanganj (r2 = 0.23), followed by Darus-Salam and Gazipur (r2 = 0.21), and Gazipur and Narayanganj (r2 = 0.04) (). The intrasite correlation for CO was maximum for Darus-Salam and Narayanganj (r2 = 0.14) (). As traffic is considered a major source of NO2 and CO emissions in the urban area and hundreds of local buses, long-route buses, and freight trucks use the same Dhaka (Darus-Salam)–Narayanganj route, the high correlations for both NO2 and CO pollution between Darus-Salam and Narayanganj can be attributed to shared traffic emission patterns.
Spatial variation of pollution concentrations in the Dhaka metropolitan area
As shown in , spatial differences in anthropogenic sources of pollutant emissions were found to be reflected in the distribution of the various pollutant concentrations across the Dhaka metropolitan area. During monsoon season, PM2.5 concentration was highest at the Darus-Salam site, while in the winter season, PM2.5 concentration was highest at the Narayanganj site (). Traffic emits ultrafine and fine particles, which are less likely affected by rain during the monsoon and premonsoon seasons. During 2013–2017, the PM2.5 concentration was highest at Narayanganj (94.4 ± 2.00 µg/m3), followed by Darus-salam (85.8 ± 1.59 µg/m3) and Gazipur (83.4 ± 1.56 µg/m3). The Darus-Salam site represents traffic pollution in the Dhaka main city, as it is located near the main busy road.
Figure 9. Spatial interpolation of PM2.5, PM10, SO2, NO2, CO, and O3 concentrations in three monitoring sites in the Dhaka metropolitan area.
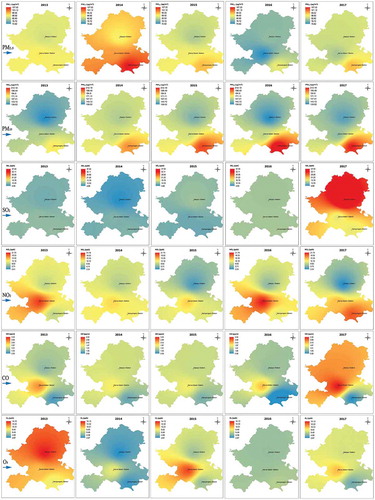
The spatiotemporal variations of all monitored air pollutants (i.e., PM2.5, PM10, SO2, NO2, CO, and O3) are shown in . With the highest at the Gazipur site (12.2 ± 0.32 ppb), a nonsignificant variation of SO2 concentration was found, resulting from the variation of local sources and their operational time. The major sources of SO2 emissions are brick kilns and high-sulfur diesel fuel. As described previously, hundreds of brick kilns around the Gazipur station and industrial heavy-duty diesel trucks have a significant influence on measuring high SO2 concentration at this site.
The NO2 and CO follow a common pattern in all three sites during the study period. The major source of NO2 and CO emissions in the Dhaka metropolitan area is traffic. Both NO2 and CO were found highest at the Darus-Salam site (16.9 ± 0.29 ppb and 2.4 ± 0.036 ppm, respectively) (). As described before, this station is located near the busy road inside Dhaka City and captures the actual traffic pollution scenario in Dhaka City. Most of the motor vehicles in Dhaka City are decades old and unfit for the road, polluting the environment severely. Their poor engine condition is one of the major causes of CO emissions from traffic. Like NO2 and CO, O3 was also found highest at the Darus-Salam site (9.2 ± 0.34 ppb), followed by Gazipur (7.1 ± 0.26 ppb) and Narayanganj (5.5 ± 0.09 ppb). Darus-Salam station is characterized as a traffic hotspot. The NO and VOC emissions from vehicles react at the downwind part of the urban area to form O3. Wind direction is also an important factor that could change the concentration measured at an individual site, as ozone mostly formed at 20–30 km downwind of a big city. The ratio of VOC/NOx plays an important role in formation of ozone in the downwind or upwind of a city (the source of emission). Generally, VOC/NOx ratio increases as air moves downwind from a major city. NOx is removed preferentially as it reacts more rapidly than VOCs in air masses. Lowering NOx at constant VOC especially occurs downwind of a city and results in maximum accumulation of ozone (National Research Council Citation1991).
Variations in fine/coarse PM ratio
Table S4 shows that PM2.5/PM10 ratios at the Darus-Salam and Gazipur sites were distinctly different from that at the Narayanganj site, which is related to the fact that the coarse particles (PM10) concentration was highest at Narayanganj in all seasons (). The PM2.5/PM10 ratio was found low for all four seasons at the Narayanganj site, which reveals that the particulates matter mass at this site is dominated by the coarse particles. The reason for this may be that this site is surrounded by hundreds of textile industries. The industrial dust particles that originated especially from spinning mills could be the major source of coarse particles. Moreover, a number of sand damps are situated near this location, based on the river flowing beside this station. These sand damps could be another source of coarse particles at this site. The pollution at the Darus-Salam site is influenced by traffic and brick kilns, which both emit mostly fine particles. Gazipur station is located inside the Gazipur city corporation graveyard premises, far away from any local sources of pollution, so the pollution at this site is barely affected by the local sources. But there are hundreds of brick kilns located within a 4-km radial distance from this station that might make a significant contribution to elevating the PM2.5/PM10 ratio at this site. Due to less gravity action, fine particles can transport for greater distances than coarse particles. In three stations, fine particles dominated in the total PM mass during the winter season, while coarse particles dominated in the total PM mass during monsoon (Table S4 and ). One previous study reported that brick kilns have a big share (>57%) of particulate matter pollution in Dhaka City (Begum et al. Citation2014). Brick kilns cannot run their production during monsoon, as most of the brickfields flood during this time. The elimination of the biggest source (i.e., brick kilns) during monsoon reduces the fine particles emission to a large extent, which apparently leads to an increase in the PM2.5/PM10 ratio in monitoring stations in the Dhaka metropolitan area. The high relative humidity during the monsoon season could also have an influence on the low PM2.5/PM10 ratio. Hygroscopic materials in the particles attract water, causing particles to grow two- to threefold in diameter (Hoopes Citation1974; Howell et al. Citation2006).
Time trend analyses
The summary of the pollution concentration trend for each air pollutant at each site (Darus-Salam, Narayanganj, and Gazipur) for the period of 2013–2017 is presented in , S8, and S9, respectively. The annual 5-yr trends are presented in Figure S6. The only 5-yr data set is considered too short to offer a meaningful understanding of concentration trends. The detection of long-term linear trend depends on many factors, such as number of years of data, autocorrelation of noise, and the magnitude of variability. To overcome the inherent noise in data, it is recommended to have several decades (more than two decades) of environmental data in order to detect long-term trends likely to occur in nature (Weatherhead and Reinsel Citation1998). In order to indicate the statistical significance of the slope estimation the trend of each pollutant was expressed as per year, along with the upper and lower 95th confidence intervals in the trend and the p value.
Table 2. Summary of trend for seasonal concentrations for air pollutants at Dhaka City during 2013–2017.
Nonsignificant decreases in annual PM2.5 concentrations were identified as −5.0 yr−1 at Darus-Salam, −1.1 yr−1 at Gazipur, and no trend at Narayanganj. The interannual trend of PM2.5 and PM10 ( and Figure S6) showed the highest concentration in 2014, resulting from the low wind speed, high barometric pressure, and low precipitation during this year (Figure S7 and Figure S8). There was no increase of SO2, NO2, and CO concentrations observed in 2014, which suggests that the significant increase of particulate matter concentration during this year was highly influenced by the metrological parameters (i.e., wind speed, barometric pressure, and precipitation), rather than the anthropogenic sources of pollution. The major source of SO2 is the brick kilns in Bangladesh, as they use coal as their primary fuel. The NO2 and CO are usually considered an indicator of traffic pollution.
The winter trend showed a nonsignificant decrease in all three sites, with the highest at Darus-Salam (−3.8 yr−1). With a significant negative slope (−4.7 yr−1) at Gazipur, the average decreasing trends were observed in the other two sites during the premonsoon season. Nonconsistent monsoon trends were found in three sites. A positive slope (8.1 yr−1) was observed at the Gazipur site during the postmonsoon, suggesting the increase in brick kilns in operation during that time. The variability of the trends across the Dhaka metropolitan area results from the variation of intensity and operation time of local anthropogenic sources of pollution such as brick kilns, industries, and traffic.
Annually, nonconsistent PM10 trends were identified in the Dhaka metropolitan area with negative slope (−2.7 yr−1) at Darus-Salam, positive slope (7.8 yr−1) at Narayanganj, and no trend at Gazipur. During the winter season, a significant positive slope (11.6 yr−1) of PM10 was observed at Narayanganj, followed by 2.7 yr−1 at Dhaka (nonsignificant) and no trend at Gazipur. The increase in road dust and soil dust during the dry season could be the reason for the increasing trend during winter. During the premonsoon time, nonsignificant decreasing trends were found at Darus-Salam (−10.6 yr−1) and at Gazipur (−7.4 yr−1), and no trend was found at the Narayanganj site. Among the three sites, a substantial increasing in coarse particle concentration was evident at Narayanganj.
The increasing trend of SO2 concentration was very much obvious in the Dhaka metropolitan area, though a slight annual decreasing trend was identified in Narayanganj. Except for the postmonsoon season, in all other seasons, the positive slopes were estimated for all three sites. During the premonsoon season, significant positive slopes were observed at both Darus-Salam (3.4 yr−1) and Gazipur (5.6 yr−1), suggesting an increase in brick kilns operation and high-sulfur diesel use.
An obvious variability was identified for NO2 trend across the Dhaka metropolitan area (DMA). Dhaka City (Darus-Salam site) showed no trend in all seasons, Narayanganj showed nonsignificant positive trends in all seasons, ranging from 2.6 yr−1 (during premonsoon) to 2.1 yr−1 (during monsoon), and Gazipur showed nonsignificant negative slopes in all seasons, ranging from −2.2 yr−1(during postmonsoon) to −2.0 yr−1 (during monsoon). The spatial variation of NO2 trends in DMA could result from the change in traffic patterns, as NO2 is considered as a major indicator of traffic pollution.
Except for monsoon season, CO showed nonsignificant increasing trends at Darus-Salam, ranging from 0.60 yr−1 (during premonsoon) to 0.27 yr−1 (during winter), which is consistent with SO2 at this site. Annually, no trend was detected for CO at the Narayanganj site. With nonsignificant annual increasing slope (0.25 yr−1) at Gazipur, CO showed a significant negative slope (−0.32 yr−1) during the premonsoon season and significant positive slope (0.29 yr−1) during the postmonsoon season. The fluctuation of CO trends is attributed to brick kilns and traffic operation time.
The ozone concentration in the Dhaka metropolitan area is not as significant as PM. With a slight increase (2.0 yr−1) during winter, no trends were identified for other seasons at Dhaka City (Darus-Salam site). At the Narayanganj site, O3 showed a nonsignificant negative trend during winter (−0.92 yr−1) and premonsoon (−0.76 yr−1); no trends were detected for other seasons. Except for the premonsoon season, O3 showed nonsignificant decreasing trends at the Gazipur site, ranging from −2.3 yr−1 (during monsoon) to 1.1 yr−1 (annual).
Health implications
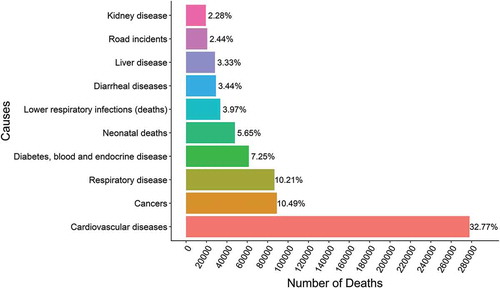
The excessive levels of air pollution we report, especially of particulate matter, can be expected to be causing serious health problems in the Dhaka metropolitan area. The most common diseases attributed to air pollution are cardiovascular disease (CVD), asthma, stroke, chronic obstructive pulmonary disease (COPD), acute lower respiratory infections in children, and lung cancer (WHO Citation2014). The leading cause of mortality in Bangladesh is from cardiovascular disease, followed by cancers, respiratory disease, and diabetes ().
Figure 10. Annual number of deaths by 10 major causes, Bangladesh, 2016. Source: Roser (Citation2018).
Studies in the published literature indicate that increased mortality from CVD and respiratory diseases in Bangladesh are likely resulting from these high air pollution exposures (Massey, Kulshrestha, and Taneja Citation2013). Indeed, numerous epidemiologic studies around the world have documented a notably robust associations between exposure to fine particulate matter mass and increased CVD and respiratory mortality, hospitalization, and emergency department visits (Brook, Rajagopalan, and Pope Citation2010; Dockery et al. Citation1993; Hsu et al. Citation2017; Ito et al. Citation2011; Özkaynak and Thurston Citation1987; Pope et al. Citation2002; Shah et al. Citation2015; Thurston, Burnett, and Turner Citation2016). The other causes of these diseases in Bangladesh are increased tobacco smoking, change in dietary habits and lifestyle, popularity of fast food items and beverages, increase in buying capacity, and decrease in the levels of physical activity (Mamun et al. Citation2015).
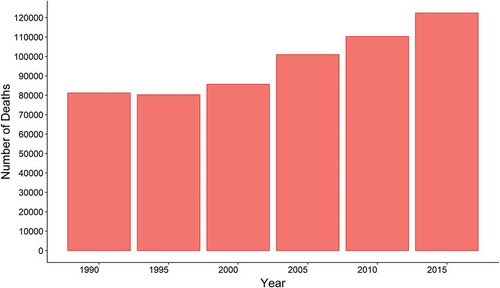
Outdoor air pollution ranked third among the all risk factors of mortality in Bangladesh, high blood pressure ranked first, and smoking ranked second (IHME Citation2018; Roser Citation2018) According to a global state of air report, the number of annual deaths attributed to the exposure to PM2.5 was 122,400 in Bangladesh in 2015 (Health Effects Institute Citation2017). In the last two decades, the mortality attributed to air pollution has been estimated to increase by 52% in Bangladesh (). One recent study reported that the total number of premature death attributed to PM2.5 exposure was 9051 (95% CI: 4596–12,025), including 4435 (95% CI: 1721–5304) for ischemic heart disease (IHD), 2669 (95% CI: 1850–4135) for stroke, 1246 (95% CI: 684–1689) for chronic obstructive pulmonary disease (COPD), 500 (95% CI: 204–649) for lung cancer (LC), and 201 (95% CI: 137–248) for acute lower respiratory infection (ALRI) in Dhaka in 2016 (Maji, Arora, and Dikshit Citation2018). The estimated total 9051 premature deaths was 6.62% of the total reported deaths in Dhaka in 2016. The increase in mortality resulting from the increase in exposure, population growth, limited access to proper diagnosis, and limited subsequent treatment. The emerging burden of CVD and respiratory disease is the major health concern in Bangladesh, and could be kept in control by adopting a clean air policy. As an example, the United States adopted the Clean Air Act in 1970, which helps in reducing health-related problems and premature mortality, and improving the health and productivity of work force. The U.S. EPA estimated that the Clean Air Act Amendments taken in 1990 will prevent more than 230,000 early deaths in 2020 (US EPA Citation2011). However, further local studies are needed to assess the exact human air pollution exposures and their associated health effects, in order to optimally guide future interventions to mitigate this public health problem.
Figure 11. Numbers of deaths attributable to PM2.5 exposure in Bangladesh for all ages and sexes. Source: Health Effects Institute (Citation2017).
Conclusion
Seasonal variation, day-of-week analysis, spatial gradients, and trends of PM2.5, PM10, SO2, NO2, CO, and O3 were investigated for the Dhaka metropolitan area for the period of 2013 to 2017. The diurnal cycles investigation was limited to only 2017 due to lack of availability of hourly data from 2013–2016. Ozone in Dhaka showed seasonal patterns different from those of other pollutants, which all showed distinct seasonal variation with a maximum during winter and a minimum during monsoon. The pollution concentration of PM2.5 and PM10 was increased about five- to sixfold during winter versus monsoon, while SO2, NO2, and CO concentrations were roughly two- to threefold increased during winter versus monsoon. Particulate matter (PM2.5 and PM10) showed nonattainment of BNAAQS during the nonmonsoon time of the year, whereas gaseous pollutants experienced a minimal number of BNAAQS exceedances throughout the study period, suggesting that gaseous pollutants in Dhaka are not as significant a health threat as PM. In the three Dhaka metropolitan area stations considered, fine particles dominated variations in the total PM mass during the winter season, while coarse particles dominated variations in the total PM mass during monsoons, likely due to reductions in the kiln emissions of fine PM2.5 during the monsoon. Unlike many other major cities in the world, day-of-week pollution patterns were not significant in Dhaka. The results of diurnal cycle analysis indicated that maximum pollution concentrations were observed at night, between 10 p.m. and 9 a.m., which is governed by long-route bus and heavy-duty truck flow during that time, as well as the reduced dispersive capabilities of the atmosphere at night (due to generally lower wind speeds and mixing heights at night). Homogeneous spatial distributions of PM were found across the Dhaka metropolitan area, while other pollutants showed nonhomogeneous patterns. Spatiotemporal variability of pollution concentrations was apparently a result of spatial and time variations in the major local anthropogenic sources of pollutions (i.e., brick kilns, industries, traffic) and their operation times.
The air pollution mitigation interventions taken by the Bangladesh government for reducing emissions from brick kilns were not found to make a significant contribution toward reducing pollution concentration in Dhaka, because PM2.5 concentrations only declined slightly (statistically nonsignificant negative slope), while the PM10 and SO2 actually showed a significant positive time trend over these years during the nonmonsoon time of the year (when the brick kilns are in operation). Due to lower level corruption and lack of infrastructure and resources, thousands of unregistered and conventional brick kilns are still in operation in Dhaka, as well as in Bangladesh as a whole. On the other hand, the construction dust resulting from unplanned urbanization accounted for the increased PM10 concentration in Dhaka City. The extreme high particulate matter concentration especially during the nonmonsoon time necessitates that the Bangladesh government adopt season-based mitigation strategies.
Despite a slight (statistically nonsignificant) decrease in annual average PM2.5 concentration in Dhaka from 2013 to 2017, the fine particulate pollution concentrations remain too high, and likely still harm human health. According to Maji, Arora, and Dikshit (Citation2018), the number of premature deaths attributed to PM2.5 exposure was 9051 in Dhaka in 2016. They calculated the premature deaths assuming thaty the toxicity of PM2.5 depends only on the level of concentration, but not on the sources, which might lead to a major error in their estimation. Particulate matter differs in toxicity according to its sources and chemical composition; for example, particles from coal burning and vehicular emission are more toxic than dust particles (Thurston, Burnett, and Turner Citation2016). Thus, the local epidemiology study is very necessary both to get more accurate estimates, and to convince local decision makers that the health effects of air pollution are real. To this point, only one very limited (1-yr) air pollution epidemiology study has been performed in Bangladesh to investigate the effect of air pollution on human health. Thus, it is high time for more extensive such studies to be conducted, so that, based on such local air pollution epidemiology studies on human health effects, the Bangladesh government can review and most effectively revise the air quality standards to maximize their public health benefits, especially for particulate matter.
Supplemental Material
Download MS Word (3.3 MB)Acknowledgment
The authors gratefully acknowledge Department of Environment, Bangladesh for providing the air pollution data.
Supplemental data
Supplemental data for this paper can be accessed on the publisher’s website.
Additional information
Funding
Notes on contributors
Md Mostafijur Rahman
Md Mostafijur Rahman is a doctoral student in the Department of Environmental Medicine, New York University School of Medicine, New York, NY, USA.
Shakil Mahamud
Shakil Mahamud is an undergraduate student in the Department of Forestry and Environmental Science, Shahjalal University of Science and Technology, Bangladesh.
George D. Thurston
George D. Thurston is a professor in the Department of Environmental Medicine, New York University School of Medicine, New York, NY, USA.
References
- Ahmed, S., and I. Mahmood. 2011. Air pollution kills 15,000 Bangladeshis each year: The role of public administration and governments integrity. J. Public Administration Policy Res. 3 (4):129–40. https://academicjournals.org/journal/JPAPR/article-abstract/059293E10041.
- Bangladesh Bureau of Statistics. 2014. Population & housing Census-2011, Vol. 2. Dhaka.
- Begum, B., M. Nasiruddin, S. Randal, B. Sivertsen, and P. Hopke. 2014. Identification and apportionment of sources from air particulate matter at urban environments in Bangladesh. Br. J. Appl. Sci. Technol. 4 (27):3930–55. doi:10.9734/BJAST/2014/11247.
- Begum, B. A., S. K. B. Eugene Kim, and P. K. Hopke. 2004. Investigation of sources of atmospheric aerosol at urban and semi-urban areas in Bangladesh. Atmos. Environ. 38 (19):3025–38. doi:10.1016/j.atmosenv.2004.02.042.
- Begum, B. A., and P. K. Hopke. 2018. Ambient air quality in Dhaka Bangladesh over two decades : Impacts of policy on air quality. 1910–20. doi:10.4209/aaqr.2017.11.0465.
- Begum, B. A., P. K. Hopke, and A. Markwitz. 2013. Air pollution by fine particulate matter in Bangladesh. Atmos. Pollut. Res. 4 (1):Elsevier:75–86. doi:10.5094/APR.2013.008.
- Biswas, S. K., H. Tervahattu, K. Kupiainen, and M. Khaliquzzaman. 2003. Impact of unleaded gasoline introduction on the concentration of lead in the air of Dhaka, Bangladesh. J. Air Waste Manage. Assoc. 53 (11):1355–62. doi:10.1080/10473289.2003.10466299.
- Brook, R. D., S. Rajagopalan, and C. A. Pope. 2010. Particulate matter air pollution and cardiovascular disease: An update to the scientific statement from the American Heart Association. Circulation 121 (21):2331–78. doi:10.1161/CIR.0b013e3181dbece1.
- CASE. 2011. CASE component I: Environment. CASE Project. http://case.doe.gov.bd/index.php?option=com_content&view=article&id=3&Itemid=18.
- Department of Environment, Bangladesh. 2016. Air quality status and trends?: 2013–2015. Dhaka.
- Department of the Environment and Heritage,Australian Government. 2005. Air quality fact sheet. http://www.environment.gov.au/protection/publications/factsheet-nitrogen-dioxide-no2.
- Douglas W.Dockery, C. A. Pope, and X. Xu. 1993. An association between air pollution and mortality in six U.S. cities. N. Engl. J. Med. 329 (24):1753–59. doi:10.1056/NEJM199312093292401.
- ESMAP. 2011. Introducing energy-efficient clean technologies in the brick sector of Bangladesh. Washington, USA. Accessed January 21, 2016. http://siteresources.worldbank.org/BANGLADESHEXTN/Images/295758-1298666789983/7759876-1323201118313/BDBrickFINAL.pdf.
- Fares, A. 2013. Winter cardiovascular diseases phenomenon. N Am J Med Sci 5 (4):266–79. doi:10.4103/1947-2714.110430.
- Geiß, A., M. Wiegner, B. Bonn, K. Schäfer, R. Forkel, and E. Von Schneidemesser. 2017. Mixing layer height as an indicator for urban air quality? Atmos. Measur. Techniq. 2969–88.
- Gorai, A. K., P. B. Tchounwou, S. S. Biswal, and F. Tuluri. 2018. Spatio-temporal variation of particulate matter (PM 2. 5) concentrations and its health impacts in a Mega City, Delhi in India. doi:10.1177/1178630218792861.
- Guo, J. 2012. The Relationship Between Surface Level Ozone (O3) and Fine Particulate Matter (PM 2. 5) in the United States Top Two U. S. Air Pollutants with Major Health Consequences. New York, NY: Columbia University.
- Guttikunda, S. K., B. A. Begum, and Z. Wadud. 2013. Particulate pollution from brick kiln clusters in the Greater Dhaka Region, Bangladesh. Air Qual. Atmos. Health 6 (2):357–65. doi:10.1007/s11869-012-0187-2.
- He, K., F. Yang, M. Yongliang, Q. Zhang, X. Yao, C. K. Chan, S. Cadle, T. Chan, and P. Mulawa. 2001. The characteristics of PM2.5 in Beijing, China. Atmos. Environ. 35 (29):4959–70. doi:10.1016/S1352-2310(01)00301-6.
- Health Effects Institute. 2017. State of Global Air 2017, 15. Health Effects Institute. Accessed August 14, 2017. www.stateofglobalair.org.
- Hess, A., H. Iyer, and W. Malm. 2001. Linear trend analysis: A comparison of methods. Atmos. Environ. 35 (30):5211–22. doi:10.1016/S1352-2310(01)00342-9.
- Hidy, G. M., C. L. Blanchard, K. Baumann, E. Edgerton, S. Tanenbaum, S. Shaw, E. Knipping, I. Tombach, J. Jansen, and J. Walters. 2014. Chemical climatology of the southeastern United States, 1999-2013. Atmos. Chem. Phys. 14 (21):11893–914. doi:10.5194/acp-14-11893-2014.
- Hoopes, S. 1974. Effect of relative size of atmospheric humidity on the aerosol particles, Atmos. Environ. 1111–17.
- Hoque, S., M. A. Ullah, and H. Nikraz. 2013. Investigation of traffic flow characteristics of Dhaka-. Int. J. Civil Eng. Technol. 4 (4):55–65.
- Howell, S. G., A. D. Clarke, Y. Shinozuka, V. Kapustin, C. S. McNaughton, B. J. Huebert, S. J. Doherty, and T. L. Anderson. 2006. Influence of relative humidity upon pollution and dust during ACE-Asia: Size distributions and implications for optical properties. J. Geophys. Res. Atmos. 111 (D6):1–11. doi:10.1029/2004JD005759.
- Hsu, W. H., S. A. Hwang, P. L. Kinney, and S. Lin. 2017. Seasonal and temperature modifications of the association between fine particulate air pollution and cardiovascular hospitalization in New York State. Sci. Total Environ. 578:Elsevier B.V.:626–32. doi:10.1016/j.scitotenv.2016.11.008.
- IHME. 2018. Global Burden of Disease Study 2016 (GBD 2016) data resources. http://ghdx.healthdata.org/gbd-2016.
- Ito, K., R. Mathes, Z. Ross, A. Nádas, G. Thurston, and T. Matte. 2011. Fine particulate matter constituents associated with cardiovascular hospitalizations and mortality in New York City. Environ. Health Perspect 119 (4):467–73. doi:10.1289/ehp.1002667.
- Jacob, D. J., and D. A. Winnerb. 2009. Effect of climate change on air quality. Atmos. Environ. 43 Elsevier Ltd:51–63. doi:10.1016/j.atmosenv.2008.09.051.
- ICA. 2011. Dhaka urban transport network development study; APPENDIX 8 : TFREIGHT TRANSPORT SYSTEMS present condition on freight transport intra-city freight traffic. Tokyo.
- Kinney, P. L. 2008. Climate change, air quality, and human health. Am. J. Prev. Med. 35 (5):459–67. doi:10.1016/j.amepre.2008.08.025.
- Li, X., Y. J. Feng, and H. Y. Liang. 2017. The impact of meteorological factors on PM2.5 variations in Hong Kong. IOP Conf. Series: Earth Environ. Sci. 78:012003. doi:10.1088/1755-1315/78/1/012003.
- Lou, C., H. Liu, Y. Li, Y. Peng, J. Wang, and L. Dai. 2017. Relationships of Relative Humidity with PM 2. 5 and PM 10 in the Yangtze River Delta, China. Environ. Monit. Assess. 189 (582).
- Mahmud Khan, S., and M. S. Hoque. 2013. Traffic flow interruptions in Dhaka City: Is smooth traffic flow possible? J. PU B 2 (2):46–54.
- Maji, K. J., M. Arora, and A. K. Dikshit. 2018. Premature mortality attributable to PM2.5exposure and future policy roadmap for ‘airpocalypse’ affected asian megacities. Process Saf. Environ. Prot. 118:Institution of Chemical Engineers: 371–83. doi:10.1016/j.psep.2018.07.009.
- Mamun, M. A., N. Rumana, K. Pervin, M. C. Azad, and N. Shahana. 2015. Emerging burden of cardiovascular diseases in Bangladesh. J. Atheroscler. Thromb. 16–18.
- Masiol, M., S. Squizzato, G. Formenton, R. M. Harrison, and C. Agostinelli. 2017. Air quality across a european hotspot: Spatial gradients, seasonality, diurnal cycles and trends in the Veneto Region, NE Italy. Sci. Total Environ. 576 Elsevier B.V.:210–24. doi:10.1016/j.scitotenv.2016.10.042.
- Massey, D. D., A. Kulshrestha, and A. Taneja. 2013. Particulate matter concentrations and their related metal toxicity in rural residential environment of Semi-Arid Region of India. Atmos. Environ. 67 Elsevier Ltd:278–86. doi:10.1016/j.atmosenv.2012.11.002.
- McLeod, A. I., K. W. Hipei, B. A. Bodo, A. I. Mcleod, K. W. Hipel, and B. A. Bodo. 1991. Trend analysis methodology for water quality time series. Environmetrics 2 (2):169–200. doi:10.1002/env.3770020205.
- Measurement, National Research Council (U.S.). Committee on Tropospheric Ozone Formation. 1991. Rethinking the ozone problem in urban and regional air pollution. Washington, D.C.: National Academy Press.
- Ott, W. R. 1995. Environmental statistics and data analysis. Boca Raton, FL: Lewis Publishers.
- Ouyang, W., B. Guo, G. Cai, L. Qing, S. Han, B. Liu, and X. Liu. 2015. The washing effect of precipitation on particulate matter and the pollution dynamics of rainwater in Downtown Beijing. Sci. Total Environ. 505:Elsevier B.V.:306–14. doi:10.1016/j.scitotenv.2014.09.062.
- Owoade, O. K., F. S. Olise, L. T. Ogundele, O. G. Fawole, and H. B. Olaniyi. 2012. Correlation between particulate matter concentrations and meteorological parameters at a site in Ile-Ife, Nigeria. Ife J. Sci. 14 (1):83–93.
- Özkaynak, H., and G. D. Thurston. 1987. Associations between 1980 U.S. mortality rates and alternative measures of airborne particle concentration. Risk Anal. 7 (4):449–61. doi:10.1111/j.1539-6924.1987.tb00482.x.
- Pant, P., S. K. Guttikunda, and R. E. Peltier. 2016. Exposure to particulate matter in India: A synthesis of findings and future directions. Environ. Res. 147:480–96. doi:10.1016/j.envres.2016.03.011.
- Parrish, D. D., H. B. Singh, L. Molina, and S. Madronich. 2011. Air quality progress in north american megacities: A review. Atmos. Environ. 45 (39):Elsevier Ltd:7015–25. doi:10.1016/j.atmosenv.2011.09.039.
- Peng, R. D., F. Dominici, R. Pastor-Barriuso, S. L. Zeger, and J. M. Samet. 2005. Seasonal analyses of air pollution and mortality in 100 US cities. Am. J. Epidemiol. 161 (6):585–94. doi:10.1093/aje/kwi075.
- Pope, I. I. I., C. Arden, R. T. Burnett, M. J. Thun, E. E. Calle, D. Krewski, and G. D. Thurston. 2002. To fine particulate air pollution. J. Am. Med. Assoc. 287 (9):1132–41. doi:10.1001/jama.287.9.1132.
- Randall, S., B. Sivertsen, S. S. Ahammad, N. D. Cruz, and V. T. Dam. 2015. Emissions Inventory for Dhaka and Chittagong of Pollutants PM10, PM2.5, NOx, SOx, and CO. http://bapman.nilu.no/LinkClick.aspx?fileticket=Wq46eRdToUA%3D&tabid=3331&mid=7822&language=en-US.
- Reşitoʇlu, I. A., K. Altinişik, and A. Keskin. 2015. The pollutant emissions from diesel-engine vehicles and exhaust aftertreatment systems. Clean Technol. Environ. Policy 17 (1):15–27. doi:10.1007/s10098-014-0793-9.
- Roser, H. R. 2018. Causes of death. OurWorldInData.Org. https://ourworldindata.org/causes-of-death#comparisons-of-risk-factors-of-death.
- Sajan, D., M. S. Q. Hasan, A. Rumana, H. Sumaiya, K. Sumana, M. Z. H. Gorapi, and S. Mohammad. 2017. Socioeconomic conditions and health hazards of brick field workers: A case study of mymensingh brick industrial Area of Bangladesh. J. Public Health Epidemiol. 9 (7):198–205. doi:10.5897/JPHE2017.0927.
- Salam, A., H. Bauer, K. Kassin, S. M. Ullah, and H. Puxbaum. 2003. Aerosol chemical characteristics of a Mega-City in Southeast Asia (Dhaka-Bangladesh). Atmos. Environ. 37 (18):2517–28. doi:10.1016/S1352-2310(03)00135-3.
- Sánchez-Triana, E., S. Enriquez, J. Afzal, and A. S. K. Akiko Nakagawa. 2014. Cleaning Pakistan’s air. Washington, D.C.
- Shah, A. S. V., K. K. Lee, D. A. McAllister, A. Hunter, H. Nair, W. Whiteley, J. P. Langrish, D. E. Newby, and N. L. Mills. 2015. Short term exposure to air pollution and stroke: systematic review and meta-analysis. BMJ January: h1295. doi:10.1136/bmj.h1295.
- Thurston, G. D, R. T. Burnett, and M. C. Turner. 2016. Ischemic heart disease mortality and long-term exposure to source-related components of U.S. Fine Particle Air Pollution. Environ. Health Perspect. 124 (6):785–95. doi:10.1289/ehp.1509777.
- Transport, Dhaka, and Coordination Board. 2011. Dhaka urban transport network development project (environmental impact assessment study). Dhaka.
- US EPA. 2011. The benefits and costs of the Clean Air Act from 1990 to 2020, Final Report, Revision A, April 2011, April. https://www.epa.gov/sites/production/files/2015-07/documents/fullreport_rev_a.pdf.
- Wang, J., and S. Ogawa. 2015. Effects of meteorological conditions on PM2.5 concentrations in Nagasaki, Japan. Int. J. Environ. Res. Public Health 12:9089–101. doi:10.3390/ijerph120809089.
- Weatherhead, E. C., and G. C. Reinsel. 1998. Factors affecting the detection of trends: Statistical considerations and applications to environmental data. J. Geophys. Res. Atmos. 103 (D14):17149–61. doi:10.1029/98JD00995.
- WHO. 2014. 7 million premature deaths annually linked to air pollution. http://www.who.int/mediacentre/news/releases/2014/air-pollution/en/.
- WHO. 2016. WHO’s urban ambient air pollution database - update 2016. WHO, 1–7. https://doi.org//entity/phe/health_topics/outdoorair/databases/cities/en/index.html.
- Zhao, S., Y. Yu, D. Yin, J. He, N. Liu, J. Qu, and J. Xiao. 2016. Annual and diurnal variations of gaseous and particulate pollutants in 31 provincial capital cities based on in situ air quality monitoring data from China national environmental monitoring center. Environ. Int. 86 (January 2013):92–106. doi:10.1016/j.envint.2015.11.003.