
ABSTRACT
Emission measurements of black carbon (BC) mass were conducted on a T63 turboshaft engine, operated at idle and cruise power with conventional and alternative fuels, using an Artium LII-300 laser-induced incandescence analyzer (LII) and AVL model 483 micro soot sensor (MSS) photoacoustic instrument using the manufacturer’s calibration for both instruments. These measurements were compared with elemental carbon (EC) determined by manual and semicontinuous thermal-optical transmission analyses according to National Institute for Occupational Safety and Health (NIOSH) method 5040 as the reference method. The results indicate that both the LII and MSS instruments show good linear correlation with EC for the two fuels and two engine power conditions evaluated. The LII measurements were observed to be biased high (27–49%) and the MSS measurements were biased low (24–35%) relative to EC. The agreement between the instruments and the reference method was substantially improved by applying a calibration of the instruments against a common BC aerosol source. Test data also suggest that the two instruments show some sensitivity to particle size (or properties related to size), specifically for particles with a geometric mean diameter (GMD) <30 nm. This sensitivity is problematic, since new engines or certain combustion conditions in current engines will produce smaller particles compared with the T63 model tested in this study. Further assessments of instrument performance for particles within this size range are therefore warranted.
Implications: Accurate black carbon emission measurements are needed to certify new and in-production commercial aircraft engines. Both the Artium LII-300 and AVL 483 micro soot sensor are currently approved by the International Civil Aviation Organization for this purpose. This study compares the two instruments against elemental carbon (EC) using NIOSH method 5040 as the reference using a T63 turboshaft engine. The results indicate that both instruments correlate reasonably well with EC, and the correlation substantially improved when applying a calibration against a common aerosol source. Sensitivity to particle size may be an issue for both instruments.
Introduction
The fine particulate matter (PM) emissions from aircraft gas turbines can impact local air quality around airports and contribute to the formation of contrails and contrail-induced cirrus clouds (Lee et al. Citation2010; Webb et al. Citation2008). The PM that exists at the exit conditions of an aircraft turbine engine consists mainly of black carbon (BC) soot along with trace quantities of metal oxides and similar constituents (Abegglen et al. Citation2016; SAE Citation2017a; Webb et al. Citation2008). Volatile PM emissions from aircraft turbines are composed of sulfur and organic compounds and generally do not form until the exhaust plume has sufficiently diluted and cooled in the downstream atmosphere (Kinsey et al. Citation2010, Citation2011; Whitefield et al. Citation2008).
The SAE International E-31 Aircraft Engine Gas and Particulate Emissions Measurement Committee has designated the determination of the nonvolatile PM (nvPM) generated by aircraft engines in its measurement methodology published as Aerospace Recommended Practice 6320 (ARP6320; SAE Citation2017a). This ARP was developed at the request of the International Civil Aviation Organization (ICAO) to standardize a PM measurement methodology to certify new and in-production commercial aircraft engines. ARP6320 defines nvPM as those particles present at the aircraft engine exit plane that do not volatilize when heated to 623 K, and due to the impracticality of filter sampling and analysis, it specifies the measurement of BC mass as a surrogate for nvPM.
There is confusion about the definition of BC and thus the measurement techniques used for its quantification. In general, BC can be defined as the solid form of mostly pure carbon that absorbs light at all wavelengths over the visible and near-visible spectral regions (Bond and Bergstrom Citation2006; Lack et al. Citation2014; Moosmuller, Chakrabarty, and Arnott Citation2009; Sasser et al. Citation2012). The measurement of BC mass can be made either using light absorption techniques or by thermally isolating a specific carbon fraction and converting it to carbon dioxide (CO2) (Sasser et al. Citation2012). Generally, the data produced by light absorption methods are referred to as light-absorbing carbon (LAC), whereas those generated by thermal isolation are referred to as elemental (EC) and organic carbon (OC) (Sasser et al. Citation2012). LAC is defined as the combination of BC and brown carbon (BrC), where BrC refers to a class of OC compounds that absorb ultraviolet (UV) and visible radiation (Lack et al. Citation2014; Sasser et al. Citation2012). Since aircraft turbine engines generally produce only minor amounts of OC relative to total carbon, in this paper we will refer to the data from light absorption instruments as simply BC (Abegglen et al. Citation2016).
Light absorption instruments can use filter-based, photoacoustic, incandescence, or cavity attenuated phase shift methods to determine the mass of BC (Lack et al. Citation2014; Michelsen et al. Citation2015; Moosmuller, Chakrabarty, and Arnott Citation2009). Filter-based methods use the attenuation (and possibly scattering) of incident light to determine the mass of BC in a sample deposited on a filter. Photoacoustic methods utilize the absorption of light from a laser to heat the particles and surrounding gas, creating a sound wave that is detected by a sensitive microphone(s). The incandescence method uses a high-power laser to heat the absorbing particles to the point where their incandescence in the visible or near-visible spectral region is measured. Finally, the cavity attenuated phase shift method uses changes in the phase shift of the distorted waveform of square-wave modulated light-emitting diode (LED) light transmitted through an optical cell to determine light extinction (Massoli et al. Citation2010). Light absorption instruments are dependent on the mass absorption coefficient of the particles, which can change with size, composition, and morphology (Moosmuller, Chakrabarty, and Arnott Citation2009).
Thermal isolation of a specific carbon fraction for determination of EC and OC involves heating a collected sample (carbon burn-off), with the evolved CO2 measured using traditional gas analysis. The most widely used thermal isolation method is the thermal-optical method where the sample is heated in a series of temperature steps to evolve OC in pure helium (He) and EC in a He/O2 atmosphere, with an optical (transmittance or reflectance) correction applied for charring of organic material during analysis (American Society for Testing and Materials [ASTM] Citation2013; National Institute for Occupational Safety and Health [NIOSH] Citation2003; Sasser et al. Citation2012). The temperature steps used during the analysis depend on the specific operating protocol used. There are several thermal-optical operating protocols in common use, all of which are operationally defined (Birch and Cary Citation1996; Chow et al. Citation2005, Citation2001; Snyder and Schauer Citation2007; Watson, Chow, and Chen Citation2005). For these instruments, the evolved CO2 can be either analyzed using a catalyst (methanator) and flame ionization detector or measured directly by a nondispersive infrared spectrometer.
A list of the commercially available light absorption and thermal isolation instruments as obtained from the various manufacturers is shown in , which includes their measurement principle, parameters measured, operating range, and lower detection limit. The application of these instruments in various field studies can be found in the literature (e.g., Bachalo et al. Citation2002; Borak et al. Citation2003; Chan et al. Citation2010; Cheng et al. Citation2011; Chow et al. Citation2009; Cross et al. Citation2010; Kanaya et al. Citation2008; Maricq Citation2014; Massoli et al. Citation2010; Nakayama et al. Citation2015; Pavlovic, Kinsey, and Hays Citation2014; Schindler et al. Citation2004; Schwartz et al. Citation2010; Slowik et al. Citation2007; Snyder and Schauer Citation2007; Weingartner et al. Citation2003).
Table 1. Currently commercially available light absorption and thermal isolation analyzers.a
There are also numerous published studies comparing BC monitoring methods for ambient air (Arnott et al. Citation2003; Bae et al. Citation2007; Borak et al. Citation2003; Chan et al. Citation2010; Cheng et al. Citation2011; Chow et al. Citation2009; Kanaya et al. Citation2008; Petzold et al. Citation2005a; Petzold and Schönlinner Citation2004; Snyder and Schauer Citation2007; Soto-Garcia et al. Citation2010; Ueda et al. Citation2016). Similar comparisons for source BC measurements are somewhat more limited, however, with most work focused on the characterization of the emissions from either internal combustion engines for ground transport (Arnott et al. Citation2003; Jimenez et al. Citation2007; Maricq Citation2014; Weingartner et al. Citation2003) or, more recently, aircraft turbine engines (Anderson et al. Citation2011; Cain et al. Citation2013; Cheng et al. Citation2009; Drozd et al. Citation2012; Kinsey et al. Citation2011; Lobo et al. Citation2015; Moore et al. Citation2015; Petzold et al. Citation2005b, Citation2011; Speth et al. Citation2015; Wey et al. Citation2006). Probably the most generally applied thermal isolation method for aircraft engine source monitoring is the thermal-optical transmittance (ToT) technique included in National Institute for Occupational Safety and Health (NIOSH) method 5040 (NIOSH Citation2003), a variation of which is embodied in ASTM International method D6877-13 (ASTM Citation2013).
During early development of SAE ARP6320, the SAE E-31 Committee conducted an evaluation of the available techniques for determining BC mass. Emphasis was placed on methods historically used to measure BC from aircraft gas turbine engines. Based on this evaluation, four candidate techniques were selected for consideration, which included the AVL model 483 MSS (Gratz, Austria), Artium Technologies LII-300 laser-induced incandescence (LII) analyzer (Sunnyvale, CA), and Thermo 5012 multiangle absorption photometer (MAAP; Waltham, MA) for determination of BC plus quartz filter sampling, and NIOSH method 5040 thermal-optical analysis for the measurement of EC. (The final published version of ARP6320 later substituted ASTM D6877-13 for the NIOSH method to meet international standards.)
To support the SAE E-31 Committee’s development of ARP6320, a two-part experimental program was performed by the U.S. Environmental Protection Agency’s (EPA) National Risk Management Research Laboratory in Research Triangle Park, North Carolina, to compare available BC measurement techniques for the quantification of aircraft engine emissions. In the Phase I effort, a laboratory study of the four candidate measurement methods was conducted using a modified Jing 5201 miniature combustion aerosol standard (Mini-CAST; Jing, Ltd., Zollikefen, Switzerland) propane diffusion flame burner (Kinsey and Pavlovic Citation2017). The four methods were compared with each other and with Teflon filter sampling for total particle gravimetric mass. The data showed high linear correlations (R2 ≥ 0.99) of all methods with total particle mass and EC. In addition, the BC measured (without a catalytic stripper) with the LII was on average 21% higher and the BC measured with the MSS was on average 15% lower as compared with EC. It was also determined that the amount of run time needed to collect an adequate sample on either a Teflon or quartz filter for analysis was generally impractical for regulatory certification purposes due to high engine operating costs. However, since NIOSH 5040 is a standard published method widely used for combustion source characterization, it was selected by the SAE E-31 Committee as the most suitable reference method for further assessment of the other three techniques.
Phase II of the study was conducted in late 2012 using the same equipment employed in the laboratory evaluation to characterize the emissions from a T63 turboshaft engine using both JP-8 (Jet-A-1 plus military additives) and an alternative jet fuel produced using the Fischer-Tropsch (FT) process. This research was conducted in collaboration with the U.S. Air Force Research Laboratory (AFRL) Aerospace Systems Directorate at Wright-Patterson Air Force Base, Ohio, and the University of Dayton Research Institute (UDRI). The objective of this phase of the study was to compare the MSS and LII with NIOSH 5040 as the reference. Other critical measurements needed to characterize the particle emissions from the engine were made by AFRL and UDRI using complementary techniques for particle number and size as well as gas-phase constituents. This paper reports the findings of the Phase II study.
Experimental
Engine and fuels
Testing was performed using an Allison T63-A-700 C18 turboshaft engine located in the Engine Environment Research Facility (EERF) at Wright-Patterson Air Force Base (WPAFB). This engine model and the combustor type have been used extensively in prior studies investigating the effect of fuel composition on emission propensity and engine operation (Corporan et al. Citation2007; Cain et al. Citation2013; Drozd et al. Citation2012). Engine emission measurements were obtained at two steady-state engine power conditions: 7% (high-speed idle) and 85% (cruise) of the maximum rated power. The engine was started with JP-8 for each test to provide baseline operation and emission data, transitioned to the specific test fuel supplied from an external tank, and subsequently returned to JP-8 to verify consistent operation. It should be noted that, although the T63 is an older technology engine, the emission trends with varying fuel compositions from this platform have been consistent with those observed for more modern technology engines (Corporan et al. Citation2011).
The test fuels consisted of a military-specification JP-8 fuel and a coal-derived synthetic paraffinic kerosene (SPK) produced via the FT synthesis process obtained from SASOL in Johannesburg, South Africa. SPKs are predominantly composed of linear and branched (iso-) paraffins, with minimal concentrations of aromatics (<0.5% by volume) and heteroatomic compounds (<15 ppmv sulfur and <2 ppmv nitrogen) (Cain et al. Citation2013). In our study, neat (100%) FT fuel was used. Analyses of both fuels are provided in .
Table 2. Fuel analyses.
Sampling system and instrumentation
A schematic of the overall sampling system is shown in , with a description of the instrumentation provided in . A raw, undiluted engine exhaust sample was extracted using an oil-cooled stainless steel probe. The raw sample was transported through a 0.77-cm-internal diameter, 15.24-m-long stainless steel tube kept at 150 °C, and then split into three sample streams. One sample stream was diluted with dry nitrogen using an ejector (Airvac model TD110HSS; Air-Vac Engineering, Seymour, CT) and supplied to the AFRL scanning mobility particle sizer (SMPS), condensation particle counter (CPC), and nondispersive infrared (NDIR) CO2 analyzer (used to determine corresponding dilution factor). The second sample stream was also diluted with dry nitrogen in an identical ejector and delivered to the EPA mobile laboratory. Separate dilution of the AFRL and EPA PM samples allowed individually adjusting the PM concentrations to values within the measurement range of the particle number and mass instruments. The sample lines from the ejectors to the AFRL and EPA particle instrument suites were identical in length at ~8 m. To minimize particle losses, the sample lines were grounded and the diluted samples were maintained at 75 °C up to the instruments as illustrated in . The third sample stream provided an undiluted sample to the AFRL Fourier transform infrared (FTIR) and flame ionization detector (FID) analyzers for gas analysis and was maintained at 150 °C.
Table 3. Experimental parameters and instrumentation.
Figure 1. Flow schematic of the overall sampling system.
The EPA measurement suite () was operated in a mobile laboratory and consisted of a Sunset model 3 semicontinuous OCEC analyzer, MSS, LII, and multifilter sampler (MFS) equipped with four 47-mm prebaked quartz filters operated one at a time. A modified MAAP instrument (“SuperMAAP”) was also operated but malfunctioned; thus, these data are not reported here. This equipment was the same as that used in the Phase I laboratory evaluation (Kinsey and Pavlovic Citation2017) except that the MFS was substituted for a single quartz filter sampler utilized in the laboratory. Note that the MSS and LII instruments used were earlier versions of those currently commercially available.
Figure 2. EPA measurement system. Note that the SuperMAAP malfunctioned and the data were not reported.
As shown in , the diluted sample from the AFRL distribution system entered the EPA sample distribution system through a full-bore, three-way pneumatic valve. This valve could be operated either by passing the sample directly to the instruments or by allowing laboratory air to pass through a high-efficiency particulate air (HEPA) filter to obtain an instrument zero. After the three-way valve, the sample was split into two identical streams of ~19.3 liters per minute (Lpm), with one stream going through a URG Corporation stainless steel cyclone (model URG-2000-30ENS-2; URG Corporation, Chapel Hill, NC) to the MFS and the other through a second identical cyclone to a sample splitter for distribution to the semicontinuous OCEC analyzer and BC instruments. The cyclones were used to remove any large agglomerates greater than approximately 1.3 µm in aerodynamic particle diameter (i.e., the cyclone cut point at that flow rate) that might be shed from the sample distribution system. Each instrument was equipped with its own vacuum pump for drawing the sample gas through the analyzers, and all sample lines from the cyclones to the instruments were 0.95-cm (outside diameter) polished stainless steel, 3.1 m in length, and grounded to minimize particle losses.
The EPA data were logged using a multicomputer network running specialized software specific to each instrument type. For the three BC analyzers, a 1-Hz data stream was produced and logged accordingly. In the case of the semicontinuous OCEC analyzer, the software calculated the analytical results for each time-integrated sample along with storing its associated thermogram, operating parameters, etc. All data files were archived to a removable drive at the end of each test day.
Test procedures
Prior to deployment, all EPA equipment was prepared for use in the field. This included a complete functionality check and multipoint sucrose calibration of the semicontinuous OCEC analyzer as well as quality control (QC) checks of the other instruments according to the applicable standard operating procedure (SOP; see Kinsey and Pavlovic Citation2017). A positive pressure leak check of the sample distribution system was also made using dry nitrogen and Snoop soap solution (Swaglok Company, Solon, OH) to assure leak-free operation. In addition, all 47-mm quartz filters were baked in a laboratory oven at 550 °C for at least 12 hr, placed into aluminum (Al) foil–lined plastic Petri dishes, and stored in a laboratory freezer at −50 °C. The Al foil was also prebaked before being installed in the dishes. During transport and in the field, all filters were stored inside a small portable freezer at a nominal temperature of approximately −20 °C to preserve sample integrity. The freezer was operated in-transit as well as on-site.
Measurements were preceded by a calibration check of the semicontinuous OCEC analyzer using a standard sucrose solution along with the routine injection and analysis of a fixed volume of an external calibration gas standard (certified mixture of 5% methane [CH4] in He) following each OCEC analysis cycle (Bauer et al. Citation2009). Calibration and quality control checks of the other instruments were also completed according to the applicable standard operating procedure (Kinsey and Pavlovic Citation2017). All instruments were thoroughly warmed up prior to conducting the calibration checks and were kept running for the remainder of the 4-day campaign. For the AFRL SMPS, the instrument was checked prior to testing using several relevant sizes of nebulized polystyrene latex spheres to assure proper operation of the instrument.
At the start of each test day, a series of prechecks were routinely performed. These checks included a zero measurement using the large HEPA filter installed on the EPA sampling system (). Also, a method blank filter (the internal filter with no actual sample collected) was analyzed in the semicontinuous OCEC analyzer. Finally, blank runs of the entire measurement system without the engine running were conducted at the beginning and the end of the test campaign. The blank run values obtained were used to correct the data as described below. The AFRL NDIR, FID, and FTIR instruments were spanned with certified calibration gases at relevant ranges to verify the accuracy of the measurements, and a daily sampling system cleanliness test was performed by placing a HEPA filter at the inlet of the sampling system and measuring particle numbers with the CPC. Ambient background particle number measurements were also performed to correct the measured values; however, these were found to be negligible.
Experimental test matrix
The experimental test matrix consisted of a total of nine steady-state engine tests using different fuels. Most tests were divided into three separate test points (data collection periods) as indicated in . At each test point, continuous BC monitoring was conducted along with a particle sample collected and analyzed for EC using the semicontinuous analyzer. Two manual quartz filter samples were also collected during each test with JP-8 and one quartz filter sample for tests with FT fuel. The limited number of manual filters that could be collected for each test was due to the larger diameter of the manual quartz filters, which required longer run times to allow sufficient sample mass to be collected for analysis. AFRL measurements included continuous monitoring of carbon monoxide (CO), carbon dioxide (CO2), total hydrocarbons (THC), and nitrogen oxides (NOx; not reported here), SMPS scans for particle size distributions, and continuous CPC particle number concentration measurements.
Sample and data analyses
The exposed filters obtained from the MFS were analyzed by EPA after returning from the field according to modified NIOSH method 5040 for OCEC using a Sunset laboratory analyzer (Sunset Laboratory, Tigard, OR) (NIOSH Citation2003). The analytical protocol used during these analyses including all calibrations conducted is described in detail in the Phase I report (Kinsey and Pavlovic Citation2017). The same filter analysis software (NIOSH870.par) used in the semicontinuous analyzer was also used in the laboratory instrument. A gas-phase artifact correction to the NIOSH OC measurements could not be applied to either the semicontinuous or manual filter analyses, since a separate Teflon/quartz filter sampling train was not available. Hence, these data represent the total (gas + particle phase) OC.
All continuous gaseous, BC, and CPC monitoring data were obtained at 1 Hz and analyzed to provide test-point-average concentration values for each instrument and test condition. The time-integrated OCEC results from the automated filter analyses represent the entire sampling period for each test point. As described above, the sampling time periods for the manual filter samples did not match the test points shown in . For this reason, separate BC averages were calculated for the specific period that manual filter sampling was performed. The values obtained from the pre- and post-test blank runs were also averaged and subtracted from the average BC results. No correction for particle loss in the sample lines were made to the data, since all analyzers theoretically measured the same aerosol, thus allowing valid instrument comparisons.
For the AFRL SMPS, a 2-min scan time was used with continuous scans conducted throughout each test, with the data provided as test averages. This approach was deemed appropriate, since although only a relatively few scans were available for each test point, the engine was very stable and thus the test average measurements are believed to be representative of steady-state engine operation.
The data obtained by each team were combined for comparison purposes. This process involved applying the dilution correction using the ratio of raw-to-dilute CO2 (referred to here as dilution factor or DF). The DF was adjusted to maintain the PM concentrations within the instrumentation measurement range and to verify that dilution level did not impact the particle size distribution, number, and mass values obtained. DFs for the AFRL SMPS and CPC data ranged from ~7 to 55, whereas for the EPA instrument suite the DFs ranged from ~3 to 30. These resulted in average sample residence times of 2.3–3.4 sec for the AFRL system and 1.8–2.8 sec for the EPA system.
Results and discussion
Overall engine emissions
Gaseous emissions
The average concentrations of CO, CO2, and total hydrocarbons (THC) measured during each test run are provided in . As noted, both CO and THC decrease with increasing engine power, indicative of more complete combustion at higher power levels due to improved fuel atomization, fuel/air mixing, and higher combustion temperatures. Also of note is the slightly lower THC for the use of the FT fuel at cruise, which is likely due to the lack of aromatics or higher hydrogen content in the FT fuel. The lower THC produced with the FT fuel also results in lower OC and PM (formed in the exhaust) relative to JP-8. Finally, CO2 increases with engine power, which is expected based on the increased fuel flow associated with higher power settings. These differences in gaseous emissions in the T63 engine as a function of power setting and fuel type are consistent with those shown in previous studies (Cain et al. Citation2013).
Table 4. Experimental matrix.
Table 5. Average gaseous concentration data.
Particle number and size
The total PM number concentration averaged over each test is provided in for the various fuel/engine power combinations. The average total PM number concentrations measured by the CPC were 3.12–3.74 × 10⁷ particles/cm3 for idle with JP-8, 5.19–5.64 × 10⁷ particles/cm3 for JP-8 at cruise, 3.75 × 10⁶ particles/cm3 for FT at idle (single test point average); and 2.92–3.03 × 10⁷ particles/cm3 for FT at cruise. As shown in , the individual values for those tests with multiple points were relatively consistent for the same fuel/power combination, indicative of reasonably good reproducibility from run to run.
Figure 3. Test average total particle number concentration for each fuel/power condition from AFRL CPC. The error bars represent 1 standard deviation.
Another observation of note is the substantial decrease in particle number emissions, on the order of ~50% at cruise with use of the FT fuel. This is not surprising, since the FT fuel has essentially no sulfur or aromatic compounds. Similar decreases in PM emissions from the use of FT fuel in aircraft engines have been found in other studies conducted by the authors and are well documented elsewhere in the literature (Corporan et al. 2007; Kinsey et al. Citation2012).
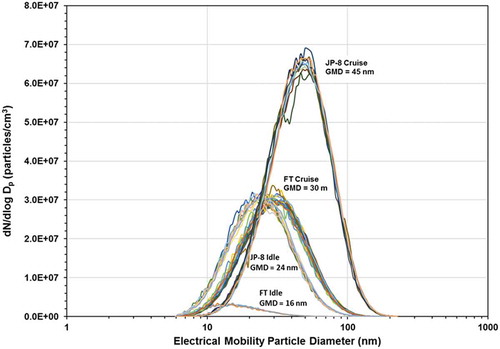
Example differential number particle size distributions (PSDs) are illustrated in . This figure shows a compilation of the individual SMPS scans for a range of DFs for both JP-8 and FT fuels with the engine operating at both idle and cruise power. As shown, a single-mode lognormal PSD was present for all fuel/power combinations and negligible differences are observed for PSDs for different DFs. The average particle geometric mean diameters (GMDs) obtained for each condition were 25 nm for JP-8 idle, 45 nm for JP-8 cruise, 16 nm for FT idle, and 30 nm for FT cruise. The decrease in magnitude of the emissions is also obvious with the use of FT fuel, with the most significant reduction being at idle power. Also, as anticipated due to the increased aromatic concentrations, substantially larger particles were produced by the engine using JP-8 as compared with FT fuel at cruise power.
Figure 4. Example differential number particle size distributions by fuel/power condition. GMD is the geometric mean particle diameter.
Volatile PM
Regarding the volatile portion of the PM emissions, the test average total OC concentration from the semicontinuous samples collected are shown in . (Values for FT fuel at idle were not available due to the low particle loading at this condition.) Recall that these values are a combination of both gas- and particle-phase OC and thus represent total OC, since a gas-phase artifact correction could not be performed. Even though the particle-phase OC could not be separated from that in the gas phase, an analysis of the trends is useful as a general indication of the volatile composition of the PM generated by the engine at different power settings and fuel types.
Table 6. Average total OC (gas + particle phase) concentrations for all test conditions.
As shown in , the highest total OC concentrations measured were for the burning of JP-8 at idle followed by JP-8 at cruise and FT at cruise, respectively. This trend is expected, since there are substantial amounts of unburned fuel present at idle power, which decreases substantially with increasing power (Cain et al. Citation2013; Kinsey et al. Citation2011). The lower total OC produced by the FT fuel relative to JP-8 at cruise is due to its lack of aromatic compounds.
Black carbon (BC) emissions
Comparisons of the test-point-average LII and MSS BC concentrations with EC from both the semicontinuous and laboratory ToT analyzer are shown in and , respectively. As can be seen from , both BC instruments are well correlated with EC, with R2 ≥ 0.89 for all data presented. However, significant differences in mass concentrations between the techniques are also observed and appear to worsen as the BC concentration increased. Depending on which ToT analyzer was used, the LII measurements were observed to be biased 27–49% high and the MSS measurements were biased 24–35% low relative to the NIOSH EC measurements. This trend is similar to the data set from the Phase I laboratory study (without use of a catalytic stripper) where the LII was biased 21% high and the MSS was biased 15% low as compared to EC (Kinsey and Pavlovic Citation2017).
Figure 5. NIOSH EC versus average BC concentration determined with (a) semicontinuous OCEC analyzer and (b) manual filter and laboratory OCEC analyzer for all tests conducted. The error bars represent 1 standard deviation.
The MSS BC data most closely agrees with EC from the semicontinuous analysis () compared with the manual filter analysis (). These data also show large uncertainties in the LII measurements, as indicated by the error bars. The higher scatter for the LII is mainly due to the signal processing method of the LII firmware, where the data output was the result of single laser shots acquired every second and averages determined manually by postprocessing. For the MSS, the data signal was processed by the firmware, thus providing a more representative mass concentration and reduced data scatter. Data from the manual filter analyses, shown in , also indicate increased scatter as compared with the measurements from the semicontinuous instrument. The higher data scatter is partially due to the limited number of filters that could be collected for manual analysis in this study and the fact that the semicontinuous and manual samples were collected during different time periods. When the semicontinuous and manual EC data were compared for the same approximate sampling period and a linear regression performed, a slope of 1.04 (forced through zero) and a R2 value of 0.84 were obtained, also indicating scatter in the data between the two techniques.
As stated above, the use of the FT fuel produced substantially smaller particles than was the case for JP-8 for the same engine power. To explore the impact of particle size on instrument performance, the relative difference between the average BC instrument reading and the associated average EC value was calculated and plotted against the GMD in for JP-8 at idle and cruise power and FT at cruise. Again, the semicontinuous EC was used to calculate the relative differences due to the larger data set available.
Figure 6. Relative difference between the series average instrument reading and series average semicontinuous EC value. The error bars represent 1 standard deviation.
As shown in , the MSS and LII exhibit a reasonably consistent relationship (or bias) to the measured EC at GMDs of 30 and 45 nm, but at a GMD of 25 nm that relationship changes for both instruments. The magnitude of the change in relative response was about 50% for the LII and approximately 30% for the MSS. Theoretically, the relative difference between the instrument and the associated EC measurements should be constant regardless of particle size. The data in suggest that both instruments have some sensitivity to the size (or properties related to size) of the particles being measured. A similar trend has been seen for the two instruments in recent unpublished data collected by J.S.K. and collaborators at EPA during the VAriable Response in Aircraft nvPM Testing (VARIAnT) research program (Giannelli Citation2018). Different instrument responses based on particle size is a subject that warrants further investigation. This is particularly important for the evaluation of new technology engines or for certain combustion conditions in current engines, which tend to produce much smaller particles as compared with the engine source used here.
Note that the differences in the relative biases for the LII may also be related to the differences in particle density as a function of size. The LII assumes a single density of 1.9 g/cm3 for all particle diameters based on the characteristics of pure carbon, which if not accurate, also contributes to the bias in mass measurement relative to EC.
As was the case for the laboratory study conducted in Phase I (Kinsey and Pavlovic Citation2017), a calibration against a reference method had not been applied to the two BC analyzers prior to data collection. Both instruments were calibrated by the manufacturer using their internal procedures. For the LII, an integrating sphere was used for a calibration employing first principles (Kinsey and Pavlovic Citation2017). In the case of the MSS, a laboratory soot generator (CAST) was used to establish a calibration for the absorber window installed in the instrument (Schindler et al. Citation2004).
To explore how a calibration could impact the test results, the regression constants obtained from the Phase I data set (without volatile PM removal by a catalytic stripper) were applied to the test-point-average LII and MSS BC measurements and the data replotted against NIOSH EC from the semicontinuous analyzer (). Linear regressions were also calculated for both data sets. Note that the data set generated during Phase I consisted of six tests conducted at target concentrations of 10, 50, 100, 500, and 1000 µg/m3 generated using a modified Jing 5201 Mini-CAST burner, with measurements made in a flow tunnel both with and without the use of a catalytic stripper (Kinsey and Pavlovic Citation2017). The use of the Phase I constants without the catalytic stripper in this analysis was deemed appropriate, since (1) use of a Mini-CAST burner is considered a suitable diffusion flame combustion source for use in calibration of the two instruments as specified by ARP6320 (SAE Citation2017a) and (2) a catalytic stripper was not used in the Phase II study reported here.
Figure 7. NIOSH EC concentration by semicontinuous analysis versus MSS and LII BC concentrations after application of the Phase I regression constants to the BC data.
As shown in , the agreement for MSS and LII data relative to the EC data improved substantially from that shown previously in . The LII regression was within ~23% of the 1:1 perfect agreement line and the MSS within ~10%. This is in comparison with the original regression values, which showed the LII within ~49% and the MSS within ~24% of perfect agreement. These results indicate that some type of calibration using a common aerosol source is needed to provide more consistent results as referenced to NIOSH EC.
It is also interesting to observe from the significant difference in readings between the two instruments compared with each other. Based on the regression constants, there appears to be a ~33% difference between the average data collected by the two instruments after comparison with a common aerosol source. The specific reason(s) for this rather large difference in response between the two instruments was not immediately obvious from the data collected and should be explored further.
Finally, the test average SMPS particle number data were converted to particle mass assuming a particle density of 1 g/cm3 and plotted against semicontinuous EC along with data obtained from the LII and MSS. The assumed unit density was selected based on recent work by the SAE E-31 Committee and others to estimate particle losses in the ARP6320 sampling system (Durdina et al. Citation2014; SAE Citation2017b). This plot is shown in , with the data corrected for dilution back to the engine exit and the Phase I regression coefficients applied to the LII and MSS data. Note that the number of data points is quite limited, since the SMPS data are only available for each test rather than by test point. As illustrated in , the observed SMPS-based PM mass concentrations were higher than those of both the LII and MSS. The SMPS mass should theoretically be slightly higher than the BC, since it includes additional components such as metal oxides, etc., in trace amounts. It must be considered, however, that the assumed density plays an important role in this analysis, as does the calibration of the BC instruments. Nonetheless, it is encouraging that the SMPS-based particle mass is at least in the same general range as the BC measurements from the two on-line analyzers.
Figure 8. Engine exit EC concentration determined by semicontinuous method versus particle mass concentration determined by SMPS, MSS, and LII after correction for dilution and Phase I regression constants.
Summary
BC mass concentrations from a T63 turboshaft engine, operated at idle and cruise conditions with two different fuels, were measured using several instruments. The objective was to assess the validity of BC mass data measured with LII and MSS as compared with the standard NIOSH 5040 EC measurement. The results indicate that both the LII and MSS instruments correlated reasonably well with EC for the two fuels and two engine power conditions evaluated. However, significant differences were observed for the absolute mass concentrations for both instruments when using manufacturer calibrations. The agreement between the instruments and the reference method was observed to improve by applying a calibration of the instruments against a common BC aerosol source. Test data also suggest that the two instruments show sensitivity to particle size (or properties related to particle size). This size sensitivity for these instruments is problematic for newer engines or certain combustion conditions in current engines, which produce smaller particles compared with the one tested here. Further assessments of instrument performance for particles within this diameter range are warranted and are being conducted during the VARIAnT program.
Disclaimer
This document has been reviewed in accordance with the U.S. Environmental Protection Agency policy and approved for publication. Mention of trade names or commercial products does not constitute endorsement or recommendation for use. The views expressed in this journal paper are those of the authors and do not necessarily reflect the views or policy of the U.S. Environmental Protection Agency.
Additional information
Notes on contributors
John S. Kinsey
John S. Kinsey is a research physical scientist in the Air and Energy Management Division, National Risk Management Research Laboratory, Office of Research and Development, at the U.S. Environmental Protection Agency in Research Triangle Park, North Carolina.
Edwin Corporan
Edwin Corporan is a principal mechanical engineer at the Fuels and Energy Branch of the Turbine Engine Division, Aerospace Systems Directorate, at Wright-Patterson Air Force Base, Ohio.
Jelica Pavlovic
Jelica Pavlovic is a scientific project officer working at the Joint Research Center, Directorate for Energy, Transport, and Climate, European Commission, in Ispra, Italy. When this work was conducted, Dr. Pavlovic was a participant in the Oak Ridge Institute for Science Education assigned to the U.S. Environmental Protection Agency National Risk Management Research Laboratory in Research Triangle Park, North Carolina.
Matthew DeWitt
Matthew DeWitt is a distinguished research engineer with the Fuels Engineering Group, Fuels and Combustion Division, at the University of Dayton Research Institute in Dayton, Ohio.
Christopher Klingshirn
Christopher Klingshirn is a research chemist/emissions specialist with the Fuels Engineering Group, Fuels and Combustion Division, at the University of Dayton Research Institute in Dayton, Ohio.
Russell Logan
Russell Logan is a technician with Jacobs Technology, Inc., in Research Triangle Park, North Carolina. When the work was conducted, Mr. Logan held a similar position at Arcadis-U.S. in Durham, North Carolina.
References
- Abegglen, M., B. T. Brem, M. Ellenrieder, L. Durdina, T. Rindlisbacher, J. Wang, U. Lohmann, and B. Sierau. 2016. Chemical characterization of freshly emitted particulate matter from aircraft exhaust using a single particle mass spectrometer. Atmos. Environ. 134:181–97. doi:10.1016/j.atmosenv.2016.03.051.
- Anderson, B. A., A. J. Beyersdorf, C. H. Hudgins, J. V. Plant, K. L. Thornhill, E. L. Winstead, L. D. Ziemba, R. Howard, E. Corporan, R. C. Miake-Lye, et al. 2011. Alternative Aviation Fuel Experiment (AAFEX). NASA/TM-2011-217059, National Aeronautics and Space Administration, Hanover, MD.
- Arnott, W. P., H. Moosmuller, P. J. Sheridan, J. A. Ogren, R. Raspet, W. V. Slaton, J. L. Hand, S. M. Kreidenweis, and J. L. Collett Jr. 2003. Photoacoustic and filter-based ambient aerosol light absorption measurements: Instrument comparisons and the role of relative humidity. J. Geophys. Res. 108:4034. doi:10.1029/2002JD002165.
- ASTM International. 2013. Standard test method for monitoring diesel particulate exhaust in the workplace. D6877-13, West Conshohocken, PA, USA.
- Bachalo, W. D., S. V. Sankar, G. J. Smallwood, and D. R. Snelling. Development of the laser-induced incandescence method for the reliable characterization of particulate emissions. Paper presented at the 11th international symposium on applications of laser techniques to fluid mechanics, Lisbon, Portugal July 8-11, 2002. doi:10.1044/1059-0889(2002/er01)
- Bae, M.-S., C.-S. Hong, Y. J. Kim, J.-S. Han, K.-J. Moon, Y. Kondo, Y. Komazaki, and Y. Miyazaki. 2007. Intercomparison of two different thermal-optical elemental carbons and optical black carbon during ABC-EAREX2005. Atmos. Environ. 41:2791–803. doi:10.1016/j.atmosenv.2006.11.040.
- Bauer, J. J., X.-Y. Yu, R. Cary, N. Laulainen, and C. Berkowitz. 2009. Characterization of the Sunset semi-continuous carbon aerosol analyzer. J. Air & Waste Manage. Assoc. 59:826–33. doi:10.3155/1047-3289.59.7.826.
- Birch, M. E., and R. A. Cary. 1996. Elemental carbon-based method for monitoring occupational exposures to particulate diesel exhaust. Aerosol Sci. Technol. 25:221–41. doi:10.1080/02786829608965393.
- Bond, T. C., and R. W. Bergstrom. 2006. Light absorption by carbonaceous particles: An investigative review. Aerosol Sci. Technol. 40:27–67. doi:10.1080/027868205000421521.
- Borak, J., G. Sirianni, H. J. Cohen, S. Chemerynski, and R. Wheeler. 2003. Comparison of NIOSH 5040 method vs. aethalometer to monitor diesel particulate in school buses and at work sites. Aiha J. 64:260–68. doi:10.1080/15428110308984816.
- Cain, J., M. J. DeWitt, D. Blunck, E. Corporan, R. Striebich, D. Anneken, C. Klingshirn, W. M. Roquemore, and R. Vander Wal. 2013. Characterization of gaseous and particulate emissions from a turboshaft engine burning conventional, alternative, and surrogate fuels. Energy Fuels 27:2290–302. doi:10.1021/ef400009c.
- Chan, T. W., J. R. Brook, G. J. Smallwood, and G. Lu. 2010. Time-resolved measurements of black carbon light absorption enhancement in urban and near-urban locations of Southern Ontario, Canada. Atmos. Chem. Phys. Discuss. 10:199939–19980. doi:10.5194/acpd-10-19939-2010.
- Cheng, M.-D., E. Corporan, M. J. DeWitt, and B. Landgraf. 2009. Emissions of volatile particulate components from turboshaft engines operated with JP-8 and Fischer-Tropsch fuels. Aerosol Air Qual. Res. 9:237–56. doi:10.4209/aaqr.2008.11.0059.
- Cheng, Y., M. Zheng, K.-B. He, Y. Chen, B. Yan, A. G. Russell, W. Shi, Z. Jiao, G. Sheng, J. Fu, et al. 2011. Comparison of two thermal-optical methods for the determination of organic carbon and elemental carbon: Results from the southeastern United States. Atmos. Environ. 45:1913–18. doi:10.1016/j.atmosenv.2011.01.036.
- Chow, J. C., J. G. Watson, D. Crow, H. L. Douglas, and T. Merrifield. 2001. Comparison of IMPROVE and NIOSH carbon measurements. Aerosol Sci. Technol. 34:23–34. doi:10.1080/02786820119073.
- Chow, J. C., J. G. Watson, L.-W. A. Chen, G. Peredes-Miranda, M.-C. O. Chang, C. Trimble, K. K. Fung, H. Zhang, and J. Zhen Yu. 2005. Refining temperature measures in thermal/optical carbon analysis. Atmos. Chem. Phys. 5:2961–72. doi:10.1080/02786820119073.
- Chow, J. C., J. G. Watson, P. Doraiswamy, L.-W. A. Chen, D. A. Sodeman, D. H. Lowenthal, K. Park, W. P. Arnott, and N. Motallebi. 2009. Aerosol light absorption, black carbon, and elemental carbon at the Fresno Supersite, California. Atmos. Res. 93:874–87. doi:10.1016/j.atmosres.2009.04.010.
- Corporan, E., M. J. DeWitt, V. Belovich, R. Pawlik, A. C. Lynch, J. R. Gord, and T. R. Meyer. 2007. Emissions characteristics of a turbine engine and research combustor burning a fischer-tropsch jet fuel. Energy Fuels 21:2615–26. doi:10.1021/ef070015j.
- Corporan, E., T. Edwards, L. Shafer, M. J. DeWitt, C. Klingshirn, S. Zabarnick, Z. West, R. Striebich, J. Graham, and J. Klein. 2011. Chemical, thermal stability, seal swell, and emission studies of alternative jet fuels. Energy Fuels 25:955–66. doi:10.1021/ef101520v.
- Cross, E. S., T. B. Onash, A. Ahern, W. Wrobel, J. G. Slowik, J. Olfert, D. A. Lack, P. Massoli, C. D. Cappa, J. P. Schwarz, et al. 2010. Soot particle studies-instrument inter-comparison-project overview. Aerosol Sci. Technol. 44:592–611. doi:10.1080/0278-6826print/1521-7388online.
- Drozd, G. T., M. A. Miracolo, A. A. Presto, E. M. Lipsky, D. D. Riemer, E. Corporan, and A. L. Robinson. 2012. Particulate matter and organic vapor emissions from a helicopter engine operating on petroleum and Fischer–Tropsch fuels. Energy Fuels 26:4756–66. doi:10.1021/ef300651t.
- Durdina, L., B. T. Brem, M. Abegglen, P. Lobo, T. Rindlisbacher, K. A. Thompson, G. J. Smallwood, D. E. Hagen, B. Sierau, and J. Wang. 2014. Determination of PM mass emissions from an aircraft turbine engine using particle effective density. Atmos. Environ. 99:500–07. doi:10.1016/j.atmosenv.2014.10.018.
- Giannelli, R. 2018. Personal communication. Ann Arbor, MI: U. S. Environmental Protection Agency, Office of Transportation and Air Quality. May 27.
- Jimenez, J., C. Claiborn, T. Larson, T. Gould, T. W. Kirchstetter, and L. Gundel. 2007. Loading effect correction for real-time aethalometer measurements of fresh diesel soot. J. Air & Waste Manage. Assoc. 57:868–73. doi:10.3155/1047-3289.57.7.868.
- Kanaya, Y., Y. Komazaki, P. Pochanart, Y. Liu, H. Akimoto, J. Gao, T. Wang, and Z. Wang. 2008. Mass concentrations of black carbon measured by four instruments in the middle of Central East China in June 2006. Atmos. Chem. Phys. 8:7637–49. doi:10.5194/acp-8-7637-2008.
- Kinsey, J. S., and J. Pavlovic. 2017. Laboratory validation of four black carbon measurement methods for determination of the nonvolatile particulate matter (nvPM) mass emissions from commercial aircraft engines. Publication No. EPA 600/R-17/190, U. S. Environmental Protection Agency, Research Triangle Park, NC, August. https://cfpub.epa.gov/si/si_public_record_Report.cfm?Lab=NRMRL&dirEntryId=338123
- Kinsey, J. S., M. D. Hays, Y. Dong, D. C. Williams, and R. Logan. 2011. Chemical characterization of the fine particle emissions from commercial aircraft engines during the aircraft particle emissions eXperiment (APEX) 1 to 3. Environ. Sci. Technol. 45:3415–21. doi:10.1021/es103880d.
- Kinsey, J. S., M. T. Timko, S. C. Herndon, E. C. Wood, Z.-H. Yu, R. C. Miake-Lye, P. Lobo, P. Whitefield, D. Hagen, C. Wey, et al. 2012. Determination of the emissions from an aircraft auxiliary power unit (APU) during the alternative aviation fuels experiment (AAFEX). 2012. J. Air & Waste Manage. Assoc. 62:420–30. doi:10.1080/10473289.2012.655884.
- Kinsey, J. S., Y. Dong, D. C. Williams, and R. Logan. 2010. Physical characterization of the fine particle emissions from commercial aircraft engines during the aircraft particle emissions eXperiment (APEX) 1-3. Atmos. Environ. 44:2147–56. doi:10.1016/j.atmosenv.2010.02.010.
- Lack, D. A., H. Moosmuller, G. R. McMeeking, R. K. Chakrabarty, and D. Baumgardner. 2014. Characterizing elemental, equivalent black, and refractory black carbon aerosol particles: A review of techniques, their limitations, and uncertainties. Anal. Bioanal. Chem. 406:99–122. doi:10.1007/s00216-013-7402.3.
- Lee, D. S., G. Pitari, V. Grewe, K. Gierens, J. E. Penner, A. Petzold, M. J. Prather, U. Schumann, A. Bais, T. Berntsen, et al. 2010. Transport impacts on atmosphere and climate: Aviation. Atmos. Environ. 44:4678–734. doi:10.1016/j.atmosenv.2009.06.005.
- Lobo, P., L. Durdina, G. J. Smallwood, T. Rindlisbacher, F. Siegerist, E. A. Black, Z. Yu, A. A. Mensah, D. E. Hagen, R. C. Miake-Lye, et al. 2015. Measurement of aircraft engine non-volatile PM emissions: Results of the aviation-particle regulatory instrumentation demonstration experiment (A-PRIDE) 4 campaign. Aerosol Sci. Technol. 49:472–84. doi:10.1080/02786826.2015.1047012.
- Maricq, M. M. 2014. Examining the relationship between black carbon and soot in flames and engine exhaust. Aerosol Sci. Technol. 48:620–29. doi:10.1080/02786826.2014.904961.
- Massoli, P., P. Kababian, T. Onasch, F. Hills, and A. Freedman. 2010. Aerosol light extinction measurements by Cavity Attenuated Phase Shift Spectroscopy (CAPS): Laboratory validation and field deployment of a compact aerosol extinction monitor. Aerosol Sci. Technol. 44:428–35. doi:10.1080/02786821003716599.
- Michelsen, H. A., C. Schulz, G. J. Smallwood, and S. Will. 2015. Laser-induced incandenscence: Particulate diagnostics for combustion, atmospheric, and industrial applications. Progr. Energy Combust. Sci 51:2–48. doi:10.1016/j.pecs.2015.07.001.
- Moore, R. H., M. Shook, A. Beyersdorf, C. Corr, S. Herndon, W. B. Knighton, R. Miake-Lye, K. L. Thornhill, E. L. Winstead, Z. Yu, et al. 2015. Influence of jet fuel composition on aircraft engine emissions: A synthesis of aerosol emissions data from the NASA APEX, AAFEX, and ACCESS missions. Energy Fuels 29:2591–600. doi:10.1021/ef502618w.
- Moosmuller, H., R. K. Chakrabarty, and W. P. Arnott. 2009. Aerosol light absorption and its measurement: A review. J. Quan. Spectro. Rad. Trans. 110:844–78. doi:10.1016/jqsrt.2009.02.035.
- Nakayama, T., H. Suzuki, S. Kagamitani, and Y. Ikeda. 2015. Characterization of a three wavelength photoacoustic spectrometer (PASS-3) and a photoacoustic extinctiometer (PAX). J. Meteorol. Soc. Jpn 93:285–308. doi:10.2151/jmsj.2015-016.
- National Institute for Occupational Safety and Health (NIOSH). 2003. Diesel particulate matter (as elemental carbon). NIOSH manual of analytical methods. 4th ed. Atlanta, GA, USA: Centers for Disease Control and Prevention.
- Pavlovic, J., J. S. Kinsey, and M. D. Hays. 2014. The influence of temperature calibration on the OC-EC results from a dual optics thermal carbon analyzer. Atmos. Meas. Tech. 7:3321–48. doi:10.5194/amt-7-2829-2014.
- Petzold, A., H. Schloesser, P. J. Sheridan, W. P. Arnott, J. A. Ogren, and A. Virkkula. 2005a. Evaluation of multiangle absorption photometry for measuring aerosol light absorption. Aerosol Sci. Technol. 39:40–51. doi:10.1080/027868290901945.
- Petzold, A., M. Fiebig, L. Fritzsche, C. Stein, U. Schumann, C. W. Wilson, C. W. Hurley, F. Arnold, E. Katragkou, U. Baltensperger, et al. 2005b. Particle emissions from aircraft engines-a survey of the European project PartEmis. Meterologische Zeitschrift 14:465–276. doi:10.1127/0941-2948/2005/0054.
- Petzold, A., and M. Schönlinner. 2004. Multi-angle absorption photometry – A new method for the measurement of aerosol light absorption and atmospheric black carbon. J. Aerosol Sci. 35:421–41. doi:10.1016/j.jaerosci.2003.09.005.
- Petzold, A., R. Marsh, M. Johnson, M. Miller, Y. Sevcenco, D. Delhaye, A. Ibrahim, P. Williams, H. Bauer, A. Crayford, et al. 2011. Evaluation of methods for measuring particulate matter emissions from gas turbines. Environ. Sci. Tehnol. 45:3562–68. doi:10.1021/es103969v.
- SAE International. 2017a. Procedure for the continuous sampling and measurement of non-volatile particle emissions from aircraft turbine engines. Aerospace Recommended Practice 6320, Warrendale, PA, September.
- SAE International. 2017b. Procedure for the calculation of non-volatile particulate matter sampling and measurement system penetration functions and system loss correction factors. Aerospace Information Report 6504, Warrendale, PA, November.
- Sasser, E., J. Hemby, K. Adler, S. Anenberg, C. Bailey, L. Brockman, L. Chappell, B. DeAngelo, R. Damberg, J. Dawson, et al. 2012. Report to congress on black carbon. Publication EPA-450/R-12-001, U. S. Environmental Protection Agency, Washington, D. C.
- Schindler, W., C. Halsch, H. A. Beck, R. Niessner, E. Jacob, and D. Rothe. 2004. A photoacoustic sensor system for time resolved quantification of diesel soot emissions. Paper No. 2004-01-0988, SAE International, Warrendale, PA.
- Schwartz, J. P., J. R. Spackman, R. S. Gao, A. E. Perring, E. Cross, T. B. Onasch, A. Ahern, W. Wrobel, P. Davidovitz, J. Olfert, et al. 2010. The detection efficiency of the single particle soot photometer. Aerosol Sci. Technol. 44:612–28. doi:10.1080/02786826.2010.481298.
- Slowik, J. G., E. S. Cross, J.-H. Han, P. Davidovits, T. B. Onash, J. T. Jayne, L. R. Williams, M. R. Canagaratna, D. R. Worsnop, R. K. Chakrabarty, et al. 2007. An inter-comparison of instruments measuring black carbon content of soot parti-cles. Aerosol Sci. Technol. 41:295–314. doi:10.1080/02786820701197078.
- Snyder, D. C., and J. J. Schauer. 2007. An inter-comparison of two black carbon aerosol instruments and a semi-continuous elemental carbon instrument in the urban environment. Aerosol Sci. Technol. 41:463–74. doi:10.1080/02786820701222819.
- Soto-Garcia, L. L., M. O. Andreae, T. W. Andreae, P. Artaxo, W. Masnhaut, T. Kirchstetter, T. Novakov, J. C. Chow, and O. L. Mayol-Bracero. 2010. Evaluation of the carbon content of aerosols from the burning of biomass in the Brazilian Amazon using thermal, optical, and thermal-optical methods. Atmos. Chem. Phy. Discuss. 10:12859–906. doi:10.5194/acpd-10-12859-2010.
- Speth, R. L., C. Rojo, R. Malina, and S. R. H. Barrett. 2015. Black carbon emissions reductions from combustion of alternative jet fuels. Atmos. Environ. 105:37–42. doi:10.1016/j.atmosenv.2015.01.040.
- Ueda, S., T. Nakayama, F. Taketani, K. Adachi, A. Matsuki, Y. Iwamoto, Y. Sadanaga, and Y. Matsumi. 2016. Light absoption and morphological properties of soot-containing aerosols observed at an East Asian outflow site, Noto Peninsula, Japan. Atmos. Chem. Phys. 16:2525–41. doi:10.5194/acp-16-2525-2016.
- Watson, J. G., J. C. Chow, and L.-W. A. Chen. 2005. Summary of organic and elemental carbon/black carbon analysis methods and intercomparisons. Aerosol Air Qual. Res. 5:65–102. doi:10.4209/aaqr.2005.06.0006.
- Webb, S., P. D. Whitefield, R. C. Miake-Lye, M. T. Timko, and T. G. Thrasher. 2008. Research needs associated with particulate emissions at airports. ACRP Report 6, Transportation Research Board, Washington, D.C.
- Weingartner, E., H. Saathoff, M. Schnaiter, N. Streit, B. Bitnar, and U. Baltensperger. 2003. Absorption of light by soot particles: Determination of the absorption coefficient by means of aethalometers. J. Aerosol Sci. 34:1445–63. doi:10.1016/S0021-8502(03)00359-8.
- Wey, C. C., B. E. Anderson, C. Hudgins, C. Wey, X. Li-Jones, E. Winstead, L. K. Thornhill, P. Lobo, D. Hagen, P. Whitefield, et al. 2006. Aircraft particle emissions experiment (APEX). NASA/TM-2006-214382, National Aeronautics and Space Administration, Hanover, MD.
- Whitefield, P. D., P. Lobo, D. E. Hagen, M. T. Timko, R. C. Miake-Lye, C. Taylor, G. Ratliff, S. Lukachko, C. Sequeira, J. Hileman, et al. 2008. Summarizing and interpreting aircraft gaseous and particulate emissions data. ACRP Report 9, Transportation Research Board, Washington, D.C.