
 ?Mathematical formulae have been encoded as MathML and are displayed in this HTML version using MathJax in order to improve their display. Uncheck the box to turn MathJax off. This feature requires Javascript. Click on a formula to zoom.
ABSTRACT
Electrolyzed water (EW) is an effective disinfectant with a wide range of pH. EW in acid range was proved to be an ammonia absorbent which make it valuable for wet scrubbers used in animal feeding operations (AFOs). This study aimed to optimize the design and operating parameters of a wet scrubber with EW spray for ammonia removal, based on the size distribution of droplets, the property of EW and the reduction efficiency of ammonia. The optimized parameters included droplet size, nozzle flow rates, pH and available chlorine concentration (ACC) of EW, nozzle number at single stage, stage number, initial ammonia concentration and air speed in the duct. The ammonia removal efficiency increased with the decrease of droplet size and the increase of flow rate. The pH values of EW showed significant influence on ammonia removal efficiency (P ˂ 0.05), while ACC of the EW showed no significant influence (P > 0.05). For inlet ammonia concentration of 70 ppm with one and three spray stages, the wet scrubber with EW (pH = 1.35) spray was able to reduce 55.8 ± 4.3 % and 97.2 ± 3.0 % of ammonia, respectively, when the nozzles with 0.9 mm orifice diameter operated at a flow rate of 1.20 L min-1. Response surface analysis showed that orifice diameter, nozzle flow rate, and their combination were all significant factors impacting ammonia removal efficiency for both pH =1.35 and 5.50 at a 95% confidence level. Optimal ammonia removal efficiency was obtained at orifice diameter 0.9 mm and flow rate 1.20 L min-1 within the selected range. The results of this study demonstrated that wet scrubber with EW spray could be a very effective and feasible ammonia mitigation technology for animal feeding operation.
Implications: It is difficult to effectively reduce ammonia emitted from the animal feeding operations (AFOs). Both the acidity and disinfection effects of electrolyzed water (EW) make it a potential absorbent used for spray in wet scrubber to reduce the ammonia and microorganisms. Based on some preliminary field test results, lab tests were conducted to optimize the design and operation parameters of a wet scrubber with EW spray to improve the ammonia removal efficiency. A better understanding of the application and influence factors of the wet scrubber with EW spray can contribute to effective mitigation of ammonia emission from animal houses and improve the atmosphere air quality.
Introduction
Ammonia emitted from animal feeding operations (AFOs) has multiple adverse environment and public health effects. More than 50% and 64% of total ammonia in atmospheric environment were released from animal agriculture in the United States and Europe, respectively (National Research Council [NRC] Citation2003; Webb et al. Citation2005). Ammonia is a precursor of PM2.5 (particulate matter with an aerodynamic diameter <2.5 μm) and also attributes to water eutrophication (Capareda, Parnell, and McGee Citation2017; Ndegwa et al. Citation2008). Available ammonia in the air plays a vital role on the formation of particulate sulfate and nitrate during the haze episode (Ye et al. Citation2011). It affects human respiratory and animal production performance, reduces the resistance to respiratory diseases, and increases ascites (Beker et al. Citation2004). Abatement techniques for exhaust ammonia from AFOs are essential in order to safeguard human health and protect the environment.
For mechanically ventilated poultry and livestock houses, air outlets are stationary and agricultural axial fans are in fixed in location. Ammonia emission concentration and emission rate showed opposite variation trends and periodically fluctuated daily and yearly (Lin et al. Citation2012; Shepherd et al. Citation2015). The highest ammonia emission rate usually occurred in summer, whereas the ammonia emission concentration was the lowest at that time. With the development of the daily management and manure removal system in livestock and poultry breeding, both ammonia concentration and emission rate in modern AFOs were significantly reduced compared with before (Philippe, Cabaraux, and Nicks Citation2011). However, further reduction of ammonia emission was necessary to avoid noxious effects on ecosystems. Abatement techniques for ammonia include manure management, diet manipulation, and end-of-pipe treatment (Melse, Oginka, and Rulkens Citation2009). The end-of-pipe treatment technology was the most efficient way to reduce the contaminants emitted from AFOs, including ammonia. The ammonia removal efficiency could even reach >80% in field experiments (Hadlocon, Manuzon, and Zhao Citation2014a, Citation2015; Melse, Ploegaert, and Ogink Citation2012). Compared with other technologies, including biotrickling filters, water curtains, bioscrubbers, and packed-bed acid wet scrubbers, lower backpressure of spraying wet scrubber, one of the effective end-of-pipe treatment technologies for mechanically ventilated houses, showed the greatest effectiveness in purifying dirty air emitted from AFOs (Hadlocon, Manuzon, and Zhao Citation2015). Particulate matter, airborne microorganisms, and odorants were also contaminants emitted from the AFOs in addition to ammonia (Fabbri et al. Citation2007; Gay et al. Citation2003; Schauberger et al. Citation2013; Shepherd et al. Citation2015; Zhao et al. Citation2016). Higher airborne microorganisms of posttreatment could occur in some end-of-pipe treatment technologies without disinfectant medium (Aarnink et al. Citation2011; Zhao et al. Citation2011). Electrolyzed water (EW) was an effective disinfectant, which could be produced by electrolysis of a dilute salt solution. Three types of EW, electrolyzed water (AEW; pH < 2.7), slightly acidic electrolyzed water (SAEW; pH 5.0–6.5), and neutral electrolyzed water (NEW, pH 6.5–8.5), were considered as alternative disinfectants compared with common chemical sanitizer in food and egg industries (Hricova, Stephan, and Zweifel Citation2008; Huang et al. Citation2008; Rahman, Khan, and Oh Citation2016; Zheng et al., Citation2016b). The combination of antiseptic effect of the disinfectant and washing effect of the scrubber achieved high removal efficiency of microorganisms (Aarnink et al. Citation2011). Both acidity and disinfection make EW a potential liquid medium for the removal of both ammonia and airborne microbial emitted from AFOs.
Selection of nozzle parameters, air duct shape and size, stages, etc., was important in designing a spray wet scrubber. Full-cone nozzle had been proved to be the most effective nozzle type used in spray wet scrubber (Manuzon et al. Citation2007). Hadlocon, Manuzon, and Zhao (Citation2014a) designed and optimized the geometry of spray wet scrubber and found that equivalent diameters and air duct shape had significant effects on ammonia removal efficiency. Hexagonal shape was proved to be the best choice compared with round and square shapes (Hadlocon, Manuzon, and Zhao Citation2014a). High pressure made the nozzle produce small droplets and raised nozzle flow rate, which could increase the contact area of the ammonia and scrubbing liquid. To improve removal efficiency, multistage spray was used in both laboratory and field tests. In the field tests, ammonia scrubber with three spraying stages achieved ammonia removal efficiencies of more than 70% (Hadlocon, Manuzon, and Zhao Citation2015; Hadlocon et al. Citation2014b). Spraying medium was another important factor in ammonia removal efficiency for a spray wet scrubber. Although ammonia was easily soluble in water, the spray wet scrubber using only water as an absorbent was proved to be inefficient (Ocfemia, Zhang, and Tan Citation2005). Acidic substances had been used to enhance ammonia capture capacity for chemical reaction such as neutralization reaction. The maximum ammonia removal efficiency of 56% was achieved by the ammonia removal scrubber using EW designed by Majd et al. (Citation2015), using a full-cone narrow-angle nozzle with a spray angle of 26°, EW scrubbing solution with pH = 6.5, and contact time of 0.9 sec in a laboratory test, which still needed to been improved. In a field test, SAEW (pH = 5.8–6.2) combined with a proof-of-concept windbreak wall was used to remove the ammonia emitted from a layer hen house. However, the ammonia removal efficiency was 13.2%, only 4.4% higher than tap water (Zheng et al. Citation2015). Wet scrubber with EW spray for ammonia absorption deserved further research for its low removal efficiency and the gap in knowledge of EW spray with pH values lower than 5.5.
The objectives of this laboratory research were to (1) optimize key design parameters of a spray wet scrubber for ammonia mitigation by adjusting the droplet size and flow rate; (2) explore the effects of pH and available chlorine concentration (ACC) of EW on ammonia removal efficiency; and (3) quantify the effects of number of nozzles, number of stages, and operation parameters (initial ammonia concentration and air speed) on the ammonia removal performance.
Materials and methods
Laboratory-scale wet scrubber
An L-shape polyvinyl chloride (PVC) air duct that could redirect the horizontal airflow to vertical airflow was designed and established (). The wet scrubber for laboratory simulation consisted of six sections, including an air contaminant release-and-mixing chamber, an axial fan, a drain, a 90° elbow, a scrubber column, and a mist demister. The integrated system included three subsystems: an air contaminant release system, a spraying system, and an ammonia sampling system. The air contaminant release and mixing chamber, a 50 cm × 50 cm rectangular PVC duct with a length of 170 cm, was used to fully stabilize the airflow before it reached the axial fan. A variable-speed axial fan (YWF4E-500G; Huajian Corporation, Shanghai, China) was used to create airflow resembling the exhaust air stream of a commercial animal facility. The axial fan with a diameter of 0.5 m and a maximum airflow rate of 8850 m3 hr−1 could provide an airflow with 1–7 m sec−1 air speed in the duct of the system. The air speed was measured by a portable optical tachometer (PLT200; Monarch Instrument, Amherst, NH) at the center of the vertical duct. The polluted air was diverted using a 90° elbow toward the vertical scrubber column with enclosed spray nozzles. The liquid droplets of EW interacted with the polluted air in a countercurrent mode inside the scrubber column. There were three scrubber columns arranged in a hexagonal geometry with a diameter of 45.7 cm (Hadlocon, Manuzon, and Zhao Citation2014a). All three nozzle stages (E1, E2, and E3) were identical, with the capacity of utmost three nozzles for each stage installed as in the top view shown in .
Figure 1. Schematic of the laboratory wet scrubber with electrolyzed water spray. All three nozzle stages (E1, E2, and E3) are identical, with capacity of utmost three nozzles for each stage as the top view shows.
Preparation of electrolyzed water (EW)
EW with different ACCs and pH values was generated with an EW generator (Harmony-2; Rui Andre Environmental Equipment, Beijing, China). Solutions with corresponding NaCl and HCl concentrations were prepared before electrolyzing in an electrolyzed cell to produce EW. EW with pH value of 5.50 was directly generated by the electrolysis of 1% NaCl solution with pH value of 6.3, which was adjusted with HCl. EW with pH values of 1.35, 1.95, and 2.55 was generated by adding HCl into EW (pH = 5.50). A digital chlorine test kit (RC-3F; Kasahara Chemical Instruments, Saitama, Japan) and a dual-scale pH meter (HM-30 R; DKKTOA, Tokyo, Japan) were used to determine the ACC and the pH of EW, respectively. During the experiment, the pH meter was regularly calibrated using commercial standard buffers with pH values of 4.01 and 6.86 provided by the manufacturer.
Neutralization reaction was considered to be the main chemical reaction in spray scrubber for ammonia removal due to the acidity of EW. Available chlorine in EW has strong oxidation potential, including chlorine (Cl2), hypochlorous acid (HOCl), and hypochlorite ions (OCl−). HOCl in EW with strong oxidizing ability could also react with the ammonia and produce chloramines besides the neutralization reaction in EW spray scrubber. The distribution of free available chlorine and the reaction of ammonia and EW substances have been summarized by Majd et al. (Citation2015).
Electrolyzed water (EW) spraying system
The spraying system was composed of a high-pressure pump with a pressure regulator, a strainer, a pressure monitor, a flow rate meter, and an array of pipes with angle coupling of nozzles. Full-cone nozzles with different orifice diameters of 0.9, 1.0, 1.1, and 1.2 mm were used in this experiment, under different flow rates of 0.8, 1.0, and 1.2 L min−1. The spray angle of the nozzles was about 90° according to the manual. The spray pressure and flow rate of nozzles were recorded and given in . Another nozzle with orifice diameter of 0.8 mm was added in response surface methodology (RSM) study. However, the orifice diameter of 0.8 mm could cause high operating pressure and harm the pump.
Table 1. Relationships between flow rate and spray pressure of different orifice diameter nozzles.
Aerosol size distribution measurement
The size distribution of sprayed EW aerosols was detected with laser diffraction technique using a Spraytec system (Malvern Instruments, Worcestershire, UK). The Spraytec system covered a size range of 0.1–2000 μm sprayed aerosols and provided the size distribution data, including Dv(90), Dv(50), Dv(10), and the span. The spray nozzle was fixed to a point that was 0.5 m above the laser beam. For a volume-based size distribution, Dv(90), Dv(50), and Dv(10) are the maximum particle diameters, smaller than which are the diameters of 90%, 50%, and 10% sprayed droplets present, respectively. They are the most common data for demonstrating laser diffraction results based on volume distribution. The span, which measures the width of the distribution, is the most common data used to express aerosol distribution width (Zheng et al., Citation2016a). Usually, the narrower the aerosol distribution, the smaller the span. The span is calculated using eq 1.
The Dv(50) and span of the nozzles with different orifice diameters of 0.9, 1.0, 1.1, and 1.2 mm at three flow rates (0.8, 1.0, 1.2 L min−1) are shown in based on the size distribution data.
Table 2. Droplets size distribution data with different nozzle orifice diameters and flow rates.
Ammonia release system
The ammonia release system consisted of three sections, including an ammonia cylinder with 99.99% certified concentration, a PVC manifold, and an ammonia flow meter. A perforated 1.6-cm PVC manifold was connected to the ammonia cylinder through an ammonia flow meter to deliver different levels of ammonia to the mixing chamber. Desired concentrations of ammonia in the air were achieved by regulating the flow rate of ammonia released into the chamber.
Ammonia sampling system and analysis
Ammonia sampling was simultaneously performed at C1 (before scrubbing) and C2 (after scrubbing) of the wet scrubber by using two identical ammonia sampling systems (). Each sampling system consists of a PVC sampling manifold, a flow meter (Dwyer VFA-24; Dwyer Instruments, Michigan City, IN), two ammonia washing bottles in series (the upstream gas washing bottle and the downstream gas washing bottle), a drying tube, a commercially available vacuum pump (KVP8; Kamoer Fluid Tech, Shanghai, China), and clear Tygon PVC tubing for connection. Boric acid solution (250 mL, 2% w/v) was used as the gas washing medium in each bottle. Bromocresol green–methyl red mixed indicator was added to the downstream gas washing bottle (Zheng et al. Citation2015). During the sampling, the solution color of the downstream gas washing bottle did not turn blue-green from dark red, which indicated that all the ammonia was absorbed in the upstream gas washing bottle. The sampling manifolds were made of 16 mm inner diameter (ID) PVC pipes with five 2 mm diameter holes, spaced 0.10 m on the manifold for both C1 and C2. The holes of the sampling manifold faced the airflow direction. To ensure that these sampling manifolds sampled uniformly across their lengths, the design criterion developed by Chen and Sparrow (Citation2009) requiring that the total area of the small holes should be less than 14% of the cross-section area of the PVC pipe was followed. The C1 manifold was placed across the fan cone (0.3 m downwind of the fan), whereas the C2 manifold was placed after across the air outlet (0.3 m after the demister). Every ammonia sampling lasted 15 min, then the gas washing bottles were sent to the Laboratory of Water Resources and Environment at China Agricultural University for ammonia analysis and replaced with fresh gas washing bottles.
The airflow rate of the ammonia sampling system was kept at 3.0 L min−1. After sampling, the solution in the upstream gas washing bottle was analyzed by a continuous segmented flow analyzer (AA3; SEAL Analytical, Shanghai, China) to obtain its ammonia nitrogen concentration. The liquid volume in the upstream gas washing bottle after sampling was also measured by a cylinder. The ammonia concentration was calculated by eq 2.
where Cammonia is the ammonia concentration, mg m−3; CN is the ammonium nitrogen concentration, mg L−1; V is the liquid volume in the upstream gas washing bottle after sampling, mL; MNH3 is the molecular mass of ammonia, 17 amu; Q is the airflow rate through the gas washing bottle, L min−1; t is the sampling duration, min; and MN is the molecular mass of N, 14 amu.
The efficiency of the ammonia removal scrubber for this laboratory simulation was calculated using eq 3.
where Rammonia is the ammonia removal efficiency by EW spray, %; Cbefore is the ammonia concentration measured before spray, mg m−3; and Cafter is the ammonia concentration measured after spray, mg m−3.
Experimental design for ammonia removal
To optimize the effect of ammonia removal by electrolyzed water spray, one-factor-at-a-time (OFAT) and fractional factorial designs were used and the experimental parameters are summarized in . All the tests were separated into two parts: design parameters and EW character parameters (tests 1–3) and operation parameters (test 4). Ammonia removal efficiency for each treatment was measured three times for all tests. Three flow rates (spray nozzle volume; 0.8, 1.0, 1.2 L min−1) were used at all four orifice diameters (0.9, 1.0, 1.1, 1.2 mm), respectively, in test 1. Only nozzle with 0.9 mm orifice diameter at 1.2 L min−1 flow rate was used in tests 2–4. Four pH of EW (1.35, 1.95, 2.55, 5.50) were chosen at four ACCs (30, 50, 70, 90 mg L−1) to evaluate the effect of the pH and ACC on the ammonia removal in test 2. OFAT experiment was conducted to demonstrate the effects of the number of nozzles and the number of stages as well as operating conditions in tests 3 and 4.
Table 3. Summary of treatments and levels.
Statistical analysis
Collected data were analyzed with SAS 9.2 software (SAS Institute, Cary, NC, USA). Analysis of variance (ANOVA) was used to analyze the difference in the ammonia removal efficiency between different ACCs or pH. Differences were considered significant for a 5% probability level.
RSM has been a powerful tool used in optimizing the treatment conditions for different experimental systems to achieve maximal product yields (Mohana et al. Citation2008) and determining the effects of different factors and the interactions among them (Bas and Boyaci Citation2007). In this study, the ammonia removal efficiency was designated as the response variable, which was optimized against orifice diameter and flow rate of the nozzle and their interactions analyzed by analysis of variance (ANOVA) at a 95% confidence level. It was conducted for AEW (pH = 1.35) and SAEW (pH = 5.50) with a second-order quadratic regression equation represented by eq 4.
where y is the ammonia removal efficiency (%); x1 and x2 are orifice diameter (mm) and flow rate (L min−1), respectively; β0 is the intercept term; β1 and β2 are linear coefficients; β11 and β22 are the quadratic coefficients; and β12 is the interaction coefficient.
Results and discussion
Effects of droplet size and spray rate on ammonia removal
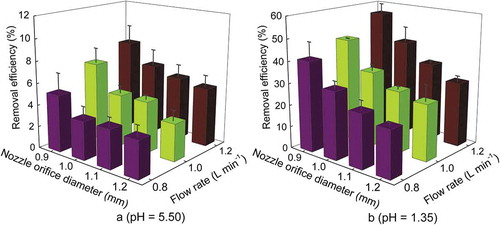
The red stone nozzles with four orifice diameters (0.9, 1.0, 1.1, 1.2 mm) were used for ammonia removal at three nozzle flow rates of 0.8, 1.0, and 1.2 L min−1 by adjusting the pump operating pressure (). Effects of droplet size and spray rate on ammonia removal performance of wet scrubber with EW spray were tested at initial ammonia concentration of 70 ppm and air velocity of 4 m sec−1 in the duct. Two pH levels (1.35 and 5.50) were chosen to evaluate the effects of droplet size and flow rate on ammonia removal. As shown in , the increase in nozzle flow rate improved the ammonia removal efficiency for all nozzles due to the decrease in gas-to-liquid ratio. At the same nozzle flow rate, the decrease in nozzle orifice diameter can generate smaller droplets, which also improved scrubbing efficiency due to the increase in droplet surface area for contact and chemical reaction. The maximum ammonia removal efficiencies at EW pH of 5.50 and flow rate of 1.2 L min−1 were 8.3 ± 1.6%, 6.4 ± 1.4%, 5.8 ± 1.1%, and 5.4 ± 1.0% at orifice diameters of 0.9, 1.0, 1.1, and 1.2 mm, respectively, whereas the maximum ammonia removal efficiencies at EW pH of 1.35 and flow rate of 1.20 L min−1 were 55.8 ± 4.3%, 43.7 ± 6.8%, 35.6 ± 1.1%, and 29.5 ± 2.3% at orifice diameters of 0.9, 1.0, 1.1, and 1.2 mm, respectively. As shown in , the Dv(50) values corresponding to maximum scrubber efficiency at the two EW pH levels (5.50, 1.35) and a flow rate of 1.20 L min−1 were 55.20 ± 1.81, 60.81 ± 1.78, 102.76 ± 0.84, and 109.61 ± 1.90 μm at orifice diameters of 0.9, 1.0, 1.1, and 1.2 mm, respectively. The nozzle with flow rate of 1.20 L min−1 and Dv(50) of 55.20 ± 1.81 μm showed the best ammonia removal performance.
Figure 2. Ammonia removal efficiencies with different nozzle orifice diameters and flow rates. Stage: E2; number of nozzles: 1; initial ammonia concentration: 70 ppm; air velocity in the duct: 4 m sec−1.
Flow rate of the nozzle and droplet size were important parameters affecting the scrubbing efficiency at a scrubbing column. Full-cone nozzle was selected in this research according to Manuzon et al. (Citation2007) and Hadlocon, Manuzon, and Zhao (Citation2014a). Majd et al. (Citation2015) carried out a study on spray scrubber for ammonia removal from air using electrolyzed water with pH = 9.0 and pH = 6.5, but only two flow rates of nozzle were used, including 5.15 L/min for full-cone narrow-angle nozzle and 0.87 L min−1 for standard-type nozzle. The full-cone narrow-angle nozzle with 5.15 L min−1 flow rate obtained the best removal efficiency among all experiments. Besides EW, Manuzon et al. (Citation2007) and Hadlocon, Manuzon, and Zhao (Citation2014a) also carried out studies on spray scrubber for ammonia removal from air using sulfuric acid solutions at concentrations of 0.36 and 0.60 N. The trend of higher flow rate–better ammonia removal efficiency was confirmed in this study. Flow rate and droplet size of spray nozzle showed strongly negative correlativity, and it was difficult to realize single variation controlling. However, this study measured the ammonia removal efficiency with four droplet sizes at the same flow rate. Within the range studied, both the increase in flow rate of nozzle and decrease in droplet size could improve the ammonia removal efficiency of the wet scrubber with EW spray.
Although decrease in droplet size resulted in higher ammonia removal efficiency, there should be factors limiting the infinite decreasing in the droplet size. Droplet collection, water recycle, and high evaporation would be the factors to consider. High operating pressure produced small droplets for a single nozzle, which could reduce the life of pump, whereas increase in nozzle flow rate was easier to realize. Nozzle selection was valuable for the spray scrubber to achieve high ammonia removal efficiency and cost control. In field application, spray nozzle volume determined partly the water consume, which was limited by the cost. Droplet size should be small enough to obtain high ammonia removal efficiency, and it also should match the demister character to obtain high water recover efficiency. Spray angle determined by nozzle type and operating pressure may correlate with the scrubber unit diameter and shape. However, no further relevant research was found.
Effects of pH and available chlorine concentration (ACC) of EW on ammonia removal
The pH value was used to quantify the acidity of EW, which by definition is −log[cH+], where cH+ is the activity of H+ and is equivalent to [H+] in an aqueous environment. Available chlorine would affect the H+ concentration. As shown in , the effects of pH and ACC of EW on ammonia removal efficiency were tested at initial ammonia concentration of 70 ppm and air velocity of 4 m sec−1 in the duct. The pH value had significant effect on ammonia removal efficiency (P < 0.05), and ammonia removal efficiency increased with the decrease in pH value. ACC had no significant effect on ammonia removal efficiency (P > 0.05). The maximum and minimum ammonia removal efficiencies were observed at pH of 1.35 and 5.50, respectively.
Figure 3. Effects of different pH and ACCs of EW on the ammonia removal. Stage: E2; number of nozzles: 1; nozzle orifice diameter: 0.9 mm; flow rate: 1.2 L min−1; air speed: 4 m sec−1; initial ammonia concentration: 70 ppm; single stage with one nozzle.
Ammonia is an alkaline gas that is easily absorbed by acid solutions. It has been proved that pH value was an important factor in ammonia removal efficiency when sulfuric acid solution was used (Ashtari et al. Citation2016; Hadlocon, Manuzon, and Zhao Citation2014a; Manuzon et al. Citation2007). Free available chlorine composed of Cl2, HOCl, and OCl− in liquid form can be generated by electrolyzing. The main form of free available chlorine depends on the pH of the EW. The main form of free available chlorine that existed in the solution was HOCl at the pH range of 3–6. In the pH range below 3, the concentration of HOCl decreased with the decrease in pH, whereas Cl2 in the liquid increased (Majd et al. Citation2015). Majd et al. (Citation2015) summarized that the reaction of HOCl and ammonia would be another route to enhance the ammonia removal performance of EW spray scrubber. However, no significant difference was found when ACC was changed from 30 to 90 mg L−1 at pH value of 5.50, which proved that the route based on the reaction of HOCl and ammonia had little effect on the ammonia removal efficiency of EW spray scrubber. ACC has no significant effect on ammonia removal efficiency of EW spray scrubber. Large amounts of Cl2 in EW at low pH values could cause the loss of Cl2 when spray of EW occurred, which suggested that the supplement of chlorine was necessary. The loss of Cl2 and the inefficiency of ammonia removal contributed by the reaction of HOCl and ammonia made the wet scrubber by EW spray inferior to other spray scrubbers by sulfuric acid spray. Considering the more powerful disinfection of EW and the mitigation of odorants than other acidity-based methods, the wet scrubber by EW spray was still a potential way to pure the contaminated air emitted from AFOs.
Effect of number of spray stages or number of nozzles on ammonia removal
shows the performance of the single-stage (E2: scrubber column 2) scrubber with respect to the number of nozzles. Ammonia removal efficiencies observed from single-stage scrubber with 1, 2, and 3 nozzles were 55.8 ± 4.3%, 85.4 ± 1.6%, and 93.6 ± 0.5%, respectively. shows the performance of multistage (only one nozzle installed at the center for each stage) scrubber with respect to the number of spray stages. Ammonia removal efficiencies observed from multistage scrubber with 1 and 3 spray stages were 55.8 ± 4.3% and 97.2 ± 3.0%, respectively, whereas ammonia removal efficiencies observed with 2 spray stages were 75.8 ± 2.4% (E2: scrubber column 2; E3: scrubber column 3) and 92.8 ± 3.4% (E1: scrubber column 1; E2: scrubber column 2).
Figure 4. Effects of number of stages and number of nozzles at the same stage on the ammonia removal. Nozzle orifice diameter: 0.9 mm; flow rate: 1.2 L min−1; air speed: 4 m sec−1; initial ammonia concentration: 70 ppm; pH = 1.35. E1 = scrubber column 1, E2 = scrubber column 2, E3 = scrubber column 3; G/L = gas-to-liquid ratio; a = 27,130.
Increase in number of nozzles at one stage or number of spray stages with a single nozzle for each stage actually multiplied spray nozzle volume at the horizontal or vertical section. Although ammonia removal efficiency increased with the increase in the number of nozzles at one stage or the number of spray stages with a single nozzle for each stage, higher droplet concentration intensified droplet intercollision, which led to droplet coagulation and decreased contact surface area for air and liquid (Manuzon et al. Citation2007). In fact, increase in the number of spray stages must change retention time considering the extension of scrubber distance, which led to the difference in ammonia removal efficiencies at two spray stages of E2 and E3 and at another two spray stages of E1 and E2. Fixing nozzles in multiple stages may lessen droplet coagulation compared with fixing them in a single stage. The occurrence probability of droplet coagulation in multiple stages could be lower than that in a single stage because of the larger distribution area at the same concentration of droplets.
Effect of operating conditions on removal of air contaminants
shows the ammonia removal efficiency at different air speeds (4.0 and 6.0 m sec−1) and initial ammonia concentrations (30, 50, 70 ppm) in the scrubber duct. Ammonia removal efficiency increased with the decrease in the air speed and the initial ammonia concentration in the scrubber duct. The same results were obtained by Hadlocon, Manuzon, and Zhao (Citation2014a). Ammonia removal efficiencies observed from the single-stage scrubber with one nozzle at 4.0 m sec−1 were 53.5 ± 4.2%, 60.1 ± 6.5%, and 66.1 ± 5.1% at initial ammonia concentrations of 70, 50, and 30 ppm, respectively. Ammonia removal efficiencies observed from the single-stage scrubber with one nozzle at 6.0 m sec−1 were 35.5 ± 4.2%, 43.7 ± 3.3%, and 50.6 ± 1.9% at initial ammonia concentrations of 70, 50, and 30 ppm, respectively.
Figure 5. Effects of initial ammonia concentration and air speed on the ammonia removal. Stage: E2; number of nozzles: 1; nozzle orifice diameter: 0.9 mm; flow rate: 1.2 L min−1; pH = 1.35.
Air speed was inversely proportional to the liquid-to-gas ratio and the retention time in the scrubber duct with fixed-length scrubbing column. Low air speed in the scrubber duct achieved higher ammonia removal efficiency for the increase in retention time and liquid-to-gas ratio (Hadlocon, Manuzon, and Zhao Citation2014a). The inlet ammonia concentration was practically determined by the field condition. In spray scrubber and biotrickling laboratory experiment, ammonia removal efficiency decreased with the increase in inlet ammonia concentration (Hadlocon, Manuzon, and Zhao Citation2014a; Jafari et al. Citation2018), which was also verified in this study.
Response surface methodology (RSM) results
The results of ammonia removal efficiency of 15 treatments (duplicates) analyzed using ANOVA indicated that orifice diameter, flow rate, and their combination were all significant variables (P < 0.0001 for orifice diameter, P < 0.0001 for flow rate, and P = 0.0260 for their combination at pH = 5.50; P < 0.0001 for orifice diameter, P < 0.0001 for flow rate, and P < 0.0001 for their combination at pH = 1.35) at a 95% confidence level for ammonia removal efficiency. RSM analysis was used on the condition that these three variables were independent. RSM results of the EW spraying scrubber at pH = 5.50 and 1.35 were evaluated with an orifice diameter range of 0.8–1.2 mm and flow rate range of 0.8–1.2 L min−1. The RSM reflects the positive effect of nozzle flow rate and the negative effect of nozzle orifice diameter, which were both consistent with earlier findings ().
Figure 6. Response surface plots showing the effects of orifice diameter and flow rate on ammonia removal efficiency. Stage: E2; number of nozzles: 1; initial ammonia concentration: 70 ppm; air velocity in the duct: 4 m sec−1.
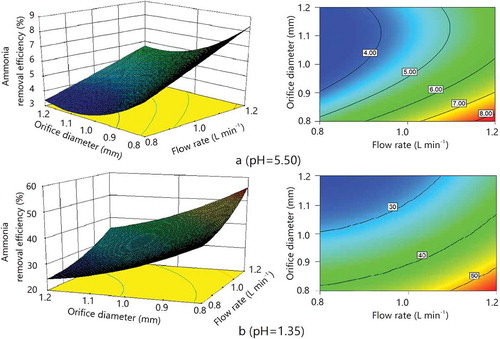
The maximum ammonia removal efficiency was obtained at orifice diameter 0.8 mm and flow rate 1.2 L min−1 within the selected ranges. However, the selected ranges for orifice diameter and flow rate tested in this study appeared to be not inclusive. The response surface as well as the contour line graph failed to capture a maximum point of ammonia removal efficiency, meaning that the optimal combination of the operating parameters (orifice diameter and flow rate) was actually outside the selected range as shown in . Orifice diameter and flow rate could acquire the highest ammonia removal efficiency. However, there were other limited variations, such as droplet collection, water recycle, and high evaporation, to get better economic benefits.
Conclusion
A wet scrubber with EW spray was designed to remove ammonia in the air emitted from AFOs. Design parameters (droplet size, flow rates, pH and ACC of EW, number of nozzles, and number of stages) and operation parameters (initial ammonia concentration and air speed) were investigated in this study. The findings are summarized below:
Within the study range, the best ammonia removal efficiency (55.8 ± 4.3%) was achieved using a full-zone nozzle with orifice diameter of 0.9 mm, flow rate of 1.2 L min−1, and EW pH value of 1.35 at a single stage. The highest ammonia removal efficiency was 97.2 ± 3.0% using multistage spray scrubber with three full-zone nozzles with orifice diameter of 0.9 mm at total flow rate of 3.6 L min−1 installed in three stages (EW with pH = 1.35).
The ammonia removal efficiency depended on droplet size, nozzle flow rate, initial ammonia concentration, and air speed, which was consistent with other spray scrubber.
The pH of EW showed significant effect on ammonia removal efficiency (P < 0.05), whereas ACC of EW showed no significant effect on ammonia removal efficiency (P > 0.05).
Response surface analysis showed that orifice diameter, flow rate, and their combination were all significant factors impacting ammonia removal efficiency (P < 0.0001 for orifice diameter, P < 0.0001 for flow rate, and P = 0.0260 for their combination at pH = 5.50; P < 0.0001 for orifice diameter, P < 0.0001 for flow rate, and P < 0.0001 for their combination at pH = 1.35) at a 95% confidence level. The optimal ammonia removal efficiency was obtained at orifice diameter of 0.8 mm and flow rate of 1.2 L min−1 within the selected range. With the consideration of high pressure for the pump, nozzle with orifice diameter of 0.9 mm and flow rate 1.2 L min−1 was the appropriate selection.
Additional information
Funding
Notes on contributors
Zonggang Li
Zonggang Li is a Ph.D. candidate in the College of Water Resources & Civil Engineering, China Agricultural University, Beijing, China.
Baoming Li
Baoming Li is a professor in the College of Water Resources & Civil Engineering, China Agricultural University, Beijing, China.
Weichao Zheng
Weichao Zheng is an associate professor in the College of Water Resources & Civil Engineering, China Agricultural University, Beijing, China.
Jiang Tu
Jiang Tu is a master candidate in the College of Water Resources & Civil Engineering, China Agricultural University, Beijing, China.
Hongya Zheng
Hongya Zheng is a Ph.D. candidate in the College of Water Resources & Civil Engineering, China Agricultural University, Beijing, China.
Yang Wang
Yang Wang is a Ph.D. candidate in the College of Water Resources & Civil Engineering, China Agricultural University, Beijing, China.
References
- Aarnink, A. J. A., W. J. M. Landman, R. W. Melse, Y. Zhao, J. P. M. Ploegaert, and T. T. T. Huynh. 2011. Scrubber capabilities to remove airborne microorganisms and other aerial pollutants from the exhaust air of animal houses. Trans. ASABE 54 (5):1921–30. doi:10.13031/2013.39833.
- Ashtari, A. K., A. M. S. Majd, G. L. Riskowski, S. Mukhtar, and L. Zhao. 2016. Removing ammonia from air with a constant pH, slightly acidic water spray wet scrubber using recycled scrubbing solution. Front Environ. Sci. Eng. 10 (6):3. doi:10.1007/s11783-016-0869-3.
- Bas, D., and I. H. Boyaci. 2007. Modelling and optimization. I. Usability of response surface methodology. J. Food Eng. 78 (3):836–45. doi:10.1016/j.jfoodeng.2005.11.024.
- Beker, A., S. L. Vanhooser, J. H. Swartzlander, and R. G. Teeter. 2004. Atmospheric ammonia concentration effects on broiler growth and performance. J. Appl. Poult. Res. 13 (1):5–9. doi:10.1093/japr/13.1.5.
- Capareda, S. C., C. B. Parnell, and R. O. McGee. 2017. Solid Aerosol Formation from the Reaction of Ammonia with Greenhouse gases (GHG). Paper presented at 2017 ASABE Annual International Meeting, Spokane, Washington, July 16-19.
- Chen, A. W., and E. M. Sparrow. 2009. Systematic approaches for design of distribution manifolds having the same per-port outflow. J. Fluids Eng. 131 (6):061101. doi:10.1115/1.3111256.
- Fabbri, C., L. Valli, M. Guarino, A. Costa, and V. Mazzotta. 2007. Ammonia, methane, nitrous oxide and particulate matter emissions from two different buildings for laying hens. Biosyst. Eng. 97 (4):441–55. doi:10.1016/j.biosystemseng.2007.03.036.
- Gay, S. W., D. R. Schmidt, C. J. Clanton, K. A. Janni, L. D. Jacobson, and S. Weisberg. 2003. Odor, total reduced sulfur, and ammonia emissions from animal housing facilities and manure storage units in Minnesota. Appl. Eng. Agric. 19 (3):347–60. doi:10.13031/2013.13663.
- Hadlocon, L. J. S., L. Zhao, R. B. Manuzon, and I. E. Elbatawi. 2014b. An acid spray scrubber for recovery of ammonia emissions from a deep-pit swine facility. Trans. ASABE 57 (3):949–60. doi:10.13031/trans.57.10576.
- Hadlocon, L. J. S., R. B. Manuzon, and L. Zhao. 2014a. Optimization of ammonia absorption using acid spray wet scrubbers. Trans. ASABE 57 (2):647–59. doi:10.13031/trans.57.10481.
- Hadlocon, L. J. S., R. B. Manuzon, and L. Zhao. 2015. Development and evaluation of a full-scale spray scrubber for ammonia recovery and production of nitrogen fertilizer at poultry facilities. Environ. Technol. 36 (4):405–16. doi:10.1080/09593330.2014.950346.
- Hricova, D., R. Stephan, and C. Zweifel. 2008. Electrolyzed water and its application in the food industry. J. Food Prot. 71 (9):1934–47. doi:10.5167/uzh-4971.
- Huang, Y. R., Y. C. Hung, S. Y. Hsu, Y. W. Huang, and D. F. Hwang. 2008. Application of electrolyzed water in the food industry. Food Control. 19 (4):329–45. doi:10.1016/j.foodcont.2007.08.012.
- Jafari, M. J., A. H. Matin, A. Rahmati, M. R. Azari, L. Omidi, S. S. Hosseini, and D. Panahi. 2018. Experimental optimization of a spray tower for ammonia removal. Atmos. Pollut. Res. 9 (4):783–90. doi:10.1016/j.apr.2018.01.014.
- Lin, X. J., E. L. Cortus, R. Zhang, S. Jiang, and A. J. Heber. 2012. Ammonia, hydrogen sulfide, carbon dioxide and particulate matter emissions from California high-rise layer houses. Atmos. Environ. 46 (2012):81–91. doi:10.1016/j.atmosenv.2011.10.021.
- Majd, A. M. S., A. K. Ashtari, G. L. Riskowski, S. Mukhtar, L. Zhao, and W. Fang. 2015. Electrolyzed water spray scrubber for removing ammonia from air. Trans. ASABE 58 (4):1069–78. doi:10.13031/trans.58.10973.
- Manuzon, R. B., L. Zhao, H. M. Keener, and M. J. Darr. 2007. A prototype acid spray scrubber for absorbing ammonia emissions from exhaust fans of animal buildings. Trans. ASABE 50 (4):1395–407. doi:10.13031/2013.23628.
- Melse, R. W., J. P. M. Ploegaert, and N. W. M. Ogink. 2012. Biotrickling filter for the treatment of exhaust air from a pig rearing building: Ammonia removal performance and its fluctuations. Biosyst. Eng. 113 (3):242–52. doi:10.1016/j.biosystemseng.2012.08.010.
- Melse, R. W., N. W. M. Oginka, and W. H. Rulkens. 2009. Air treatment techniques for abatement of emissions from intensive livestock production. Open Agric. J. 3:6–12. doi:10.2174/1874331500903010006.
- Mohana, S., S. Shrivastava, J. Divecha, and D. Madamwar. 2008. Response surface methodology for optimization of medium for decolorization of textile dye direct black 22 by a novel bacterial consortium. Bioresour. Technol. 99 (3):562–69. doi:10.1016/j.biortech.2006.12.033.
- Ndegwa, P. M., A. N. Hristov, J. Arogo, and R. E. Sheffield. 2008. A review of ammonia emission mitigation techniques for concentrated animal feeding operations. Biosyst. Eng. 100 (4):453–69. doi:10.1016/j.biosystemseng.2008.05.010.
- NRC. 2003. Air emissions. In air emissions from animal feeding operations: Current knowledge and future needs. Washington, D.C.: National Academies Press.
- Ocfemia, K., Y. Zhang, and Z. Tan. 2005. Ammonia absorption in a vertical sprayer at low ammonia partial pressures. Trans. ASAE 48 (4):1561–66. doi:10.13031/2013.19189.
- Philippe, F. X., J. F. Cabaraux, and B. Nicks. 2011. Ammonia emissions from pig houses: Influencing factors and mitigation techniques. Agric. Ecosyst. Environ. 141 (3–4):245–60. doi:10.1016/j.agee.2011.03.012.
- Rahman, S. M. E., I. Khan, and D. H. Oh. 2016. Electrolyzed water as a novel sanitizer in the food industry: Current trends and future perspectives. Compr. Rev. Food Sci. Food Saf. 15 (3):471–90. doi:10.1111/1541-4337.12200.
- Schauberger, G., T. T. Lim, J. Q. Ni, D. S. Bundy, B. L. Haymore, C. A. Diehl, R. K. Duggirala, and A. J. Heber. 2013. Empirical model of odor emission from deep-pit swine finishing barns to derive a standardized odor emission factor. Atmos. Environ. 66:84–90. doi:10.1016/j.atmosenv.2012.05.046.
- Shepherd, T. A., Y. Zhao, H. Li, J. P. Stinn, M. D. Hayes, and H. Xin. 2015. Environmental assessment of three egg production systems—Part II. Ammonia, greenhouse gas, and particulate matter emissions. Poult. Sci. 94 (3):534–43. doi:10.3382/ps/peu075.
- Webb, J., H. Menzi, B. F. Pain, T. H. Misselbrook, U. Dämmgen, H. Hendriks, and H. Döhler. 2005. Managing ammonia emissions from livestock production in Europe. Environ. pollut. 135 (3):399–406. doi:10.1016/j.envpol.2004.11.013.
- Ye, X., Z. Ma, J. Zhang, H. Du, J. Chen, H. Chen, Y. Xin, W. Gao, and F. Geng. 2011. Important role of ammonia on haze formation in Shanghai. Environ. Res. Lett. 6 (2):24019–23. doi:10.1088/1748-9326/6/2/024019.
- Zhao, Y., A. J. A. Aarnink, M. C. M. De Jong, N. W. M. Ogink, and P. G. Koerkamp. 2011. Effectiveness of multi-stage scrubbers in reducing emissions of air pollutants from pig houses. Trans. ASABE 54 (1):285–93. doi:10.13031/2013.36256.
- Zhao, Y., D. Zhao, H. Ma, K. Liu, A. Atilgan, and H. Xin. 2016. Environmental assessment of three egg production systems–Part III: Airborne bacteria concentrations and emissions. Poult. Sci. 95 (7):1473–81. doi:10.3382/ps/pew053.
- Zheng, W., L. Ni, and B. Li. 2016b. Electrolyzed water and its application in animal houses. Front Environ. Sci. Eng. 3 (3):195–205. doi:10.15302/J-FASE-2016109.
- Zheng, W., L. Ni, X. Hui, B. Li, and J. Zhang. 2016a. Optimization of slightly acidic electrolyzed water spray for airborne culturable bacteria reduction in animal housing. Int. J. Agric. Biol. Eng. 9 (4):185–91. doi:10.3965/j.ijabe.20160904.2366.
- Zheng, W., Z. Li, S. B. Shah, and B. Li. 2015. Removal of ammonia and airborne culturable bacteria by proof-of-concept windbreak wall with slightly acidic electrolyzed water spray for a layer breeding house. Appl. Eng. Agric. 32 (3):393–99. doi:10.13031/aea.32.11509.