
ABSTRACT
In recent years, there has been a marked increase in the amount of ambient air quality data collected near Marcellus Shale oil and gas development (OGD) sites. We integrated air measurement data from over 30 datasets totaling approximately 200 sampling locations nearby to Marcellus Shale development sites, focusing on 11 air pollutants that can be associated with OGD operations: fine particulate matter (PM2.5), nitrogen dioxide (NO2), sulfur dioxide (SO2), acetaldehyde, benzene, ethylbenzene, formaldehyde, n-hexane, toluene, xylenes, and hydrogen sulfide (H2S). We evaluated these data to determine whether there is evidence of community-level air quality impacts of potential health concern, making screening-level comparisons of air monitoring data with acute and chronic health-based air comparison values (HBACVs). Based on the available air monitoring data, we found that only a small fraction of measurements exceeded HBACVs, which is similar to findings from integrative air quality assessments for other shale gas plays. Therefore, the data indicate that air pollutant levels within the Marcellus Shale development region typically are below HBACV exceedance levels; however, the sporadic HBACV exceedances warrant further investigation to determine whether they may be related to specific site characteristics, or certain operations or sources. Like any air monitoring dataset, there is uncertainty as to how well the available Marcellus Shale air monitoring data characterize the range of potential exposures for people living nearby to OGD sites. Given the lesser amounts of air monitoring data available for locations within 1,000 feet of OGD sites as compared to locations between 0.2 and 1 miles, the presence of potential concentration hotspots cannot be ruled out. Additional air monitoring data, in particular more real-time data to further characterize short-term peak concentrations associated with episodic events, are needed to provide for more refined assessments of potential health risks from Marcellus Shale development.
Implications: While there is now a sizable amount of ambient air monitoring data collected nearby to OGD activities in the Marcellus Shale region, these data are currently scattered among different databases and studies. As part of an integrative assessment of Marcellus Shale air quality impacts, ambient air data are compiled for a subset of criteria air pollutants and hazardous air pollutants that have been associated with OGD activities, and compared to acute and chronic health-based air comparison values to help assess the air-related public health impacts of Marcellus Shale development.
Introduction
Occurring primarily in Pennsylvania, West Virginia, New York, and eastern Ohio, but also occupying smaller portions of Virginia, Maryland, and Tennessee, the Marcellus Shale has become the top shale gas–producing resource in the United States (EIA Citation2017). To date, the majority of the development of the Marcellus Shale has occurred in Pennsylvania and West Virginia, where there are now over 10,000 and 3,000 active unconventional natural gas wells, respectively (PADEP Citation2017; WVGES Citation2017). The rapid development of the Marcellus Shale play, which was made possible by major technological advances that include horizontal drilling and high-volume hydraulic fracturing, has occurred since 2007 when the first commercial horizontal Marcellus Shale gas well was established in southeastern Pennsylvania (Soeder Citation2017). While the Marcellus Shale play is best known for its vast supply of recoverable natural gas (estimated to be as high as 3.2 trillion cubic meters or 114 trillion cubic feet, which is approximately equivalent to a 5-year supply for the United States at current consumption rates; Soeder Citation2017), Marcellus Shale wells can also be sources of both oil and condensate liquids.
In parallel with the rapid development of the Marcellus Shale play and other tight oil and shale gas plays in the United States, there have arisen concerns regarding the potential public health and environmental impacts of unconventional oil and gas development (OGD) activities. Concerns have been raised regarding a variety of different types of potential impacts of OGD activities, including those to air quality, water quality, psychosocial stress, noise, seismic activity, public health, worker health, and ecosystem health. Much of the early research has focused on water quality impacts, although a growing number of studies have addressed other types of impacts, particularly air quality impacts. Groups such as the Health Effects Institute (HEI) have recommended a multifaceted research program to address the broad range of potential OGD-related impacts (HEI Citation2015).
It is well established that each of the phases of development for a natural gas or oil well pad is associated with potential sources of air emissions, including criteria air pollutants, air toxics, and greenhouse gases (McCawley Citation2015; Moore et al. Citation2014). For example, diesel-powered construction equipment, including trucks, backhoes, and graders, can be sources of air emissions during the well pad construction phase. During the well drilling phase, sources of air emissions can include diesel-powered trucks, generators, compressors, and backhoes; diesel- and/or natural gas-powered drill rigs; as well as drilling muds. During the well completion phase, sources of air emissions can include diesel-powered trucks, diesel- and/or natural gas-powered hydraulic fracturing pumps, hydraulic fracturing fluids, flowback water, and sand handling operations. Finally, air emission sources during the production phase can include well-head compressors or pumps, well pad equipment bleeding and leaks (e.g., from valves or flanges), and diesel-powered trucks. With the exception of the production phase, the various phases of well pad development are transient in nature with typical durations on the order of days to weeks (Soeder Citation2017), meaning that potential well pad air emission sources will predominantly occur over short-term time periods. Natural gas infrastructure, including gas processing plants, compressor stations, and pipelines, can also be associated with air emissions.
Recent integrative assessments have been conducted for other shale plays (e.g., for the Barnett Shale region in Texas [Bunch et al. Citation2014] and the Niobrara Shale region in Colorado [CDPHE Citation2017; McMullin et al. Citation2018; McKenzie et al. Citation2018]), but we are not aware of such a broad assessment of air quality data for the Marcellus Shale region, despite a substantial increase in the amount of ambient air monitoring data collected nearby to Marcellus Shale development activities. Given that the available air quality data are currently scattered among different databases and studies, the objective of this assessment was thus to assemble the body of data and provide an integrative screening-level assessment of its implications for air-related public health impacts of OGD activities in the Marcellus Shale region. By identifying available air quality data representative of both long-term average exposure levels as well as short-term transient exposures (e.g., 1 minute, 1 hour), we sought to address the following question: Do ambient air monitoring data collected in the Marcellus Shale region provide evidence of community-level air quality impacts of potential health concern? This is slightly different from the question of whether Marcellus Shale development activities are causing community-level air quality impacts of potential health concern. Due to the use of ambient air data that reflect the combined impacts of a variety of local and regional air pollutant sources, our assessment cannot provide a reliable answer to the latter question. In other words, the occurrence of elevated air concentrations above health-based air comparison values (HBACVs) does not necessarily provide evidence of harmful air emissions from OGD activities due to the difficulty in apportioning the air quality impacts of OGD emissions versus other common emissions, even for air monitoring sites nearby to OGD activities. However, our assessment can identify whether air pollutants are frequently being found at concentrations of potential health concern nearby to OGD sites.
Though we compare data to acute and chronic health-based air comparison values in our assessment, it is important to distinguish this type of screening assessment from a quantitative risk assessment. We do not perform risk calculations typical of a quantitative human health risk assessment due to the large heterogeneity of the data across studies in terms of sampling locations, sample averaging times, measurement methods, study durations, etc. Rather, we perform a screening assessment of ambient air data that are expected to capture any local, community-level impacts of OGD-related activities. We focus on data for a subset of air pollutants that have been most consistently measured in Marcellus Shale air quality studies and that have received greater scrutiny as potential contributors to OGD-related health risks. These include both criteria air pollutants (fine particulate matter [PM2.5], nitrogen dioxide [NO2], sulfur dioxide [SO2]), U.S. EPA hazardous air pollutants (HAPs; acetaldehyde, benzene, ethylbenzene, formaldehyde, n-hexane, toluene, and xylenes), and hydrogen sulfide (H2S). Some of the few available quantitative risk assessments conducted for shale play regions have reported findings suggesting that these air pollutants may be associated with the greatest potential for human health risks (CDPHE Citation2017; McKenzie et al. Citation2018, Citation2012; McMullin et al. Citation2018). We did not include the major natural gas constituents (methane, ethane, propane, butane) in our assessment because they are of low direct toxicity to humans (Goldstein et al. Citation2014; McKee et al. Citation2014). We also did not include ozone in the assessment because it is a secondary pollutant produced from emissions from many regional sources, and therefore local source attribution is complex.
Methods
Literature searches were performed using the U.S. National Library of Medicine’s PubMed biomedical literature database (http://www.ncbi.nlm.nih.gov/pubmed/) and Elsevier’s Scopus database (http://www.scopus.com/) to identify ambient air measurement data for monitoring locations nearby to Marcellus Shale OGD sites. We used the following general inclusion criteria so as to compile the largest amount of available data as possible representing the potential air quality impacts of OGD operations: (1) Availability of post-2007 data for air sampling for ambient air monitoring locations potentially impacted by Marcellus Shale development activities; (2) Original data reported in a governmental dataset or air monitoring study published in a peer-reviewed journal, governmental report, or other report; (3) Availability of information on monitoring locations relative to OGD-related activity and on key sampling parameters (e.g., sampling and analytical methods, sample duration, detection limits); (4) Reliance on standard, accepted sampling and analytical methods (e.g., U.S. EPA methods); and (5) Few, if any, other large local air pollutant sources, such as nearby highways and other local industry. We used 2008 as the first year for data inclusion, given that this year is recognized as the start of the surge of drilling activity in the Marcellus Shale region (Soeder Citation2017).
We broadly defined air monitoring locations potentially impacted by OGD activities in order to include all available air monitoring data potentially illustrative of OGD-related air quality impacts. Specifically, we included air monitoring locations if they were between 500 feet to 10 miles from OGD sites, based on the 500-foot minimum setback distance in Pennsylvania between an unconventional well and an occupied structure, and the 10-mile distance cut-off that has been used by some epidemiological studies (e.g., McKenzie et al. Citation2014; Stacy et al. Citation2015) to determine “exposed” populations in OGD regions. We excluded on-well pad measurements, point-source air testing data, and occupational exposure measurements since they are not generally representative of the off-site ambient air to which the general public may be exposed. We focused our efforts on identifying data for monitoring sites within 1 to 2 miles of OGD sites; this is consistent with research indicating that the air quality impacts of well pad sites diminish rapidly with distance away from air emission sources (Zielinska, Campbell, and Samburova Citation2014).
PubMed and Scopus literature searches were conducted to locate search terms in article titles, abstracts, and keywords. The set of search terms was developed iteratively, beginning with less restrictive search terms and adding to them to obtain a comprehensive, but focused, body of relevant studies. The final set of search terms included: (Marcellus OR Pennsylvania OR West Virginia OR Virginia OR Maryland OR Ohio OR New York) AND air AND (quality OR concentration OR concentrations OR observation OR observations OR measurement OR measurements OR sample OR samples OR mixing ratio OR mixing ratios) AND (natural gas OR shale).
The PubMed and Scopus literature searches were supplemented using Google searches, by checking article and report reference lists, and by consulting two living bibliographies of studies bearing on OGD impacts, namely the HEI Energy Research Program “Unconventional Oil and Gas Development Bibliography (HEI, Citation2018)” and the Physicians, Scientists, and Engineers (PSE) for Healthy Energy Repository for Oil and Gas Energy Research (ROGER). Using these additional resources, we were able to identify pertinent governmental air monitoring datasets and reports, as well as reports and data from non-governmental research institutions, all of which would not have been indexed in either PubMed or Scopus.
In general, we erred on the side of including most air quality datasets and studies that we identified as reporting ambient air measurement data for the Marcellus Shale region. We excluded only a small number of datasets and studies, including the following: (1) Preliminary results reported by scientists at the U.S. Department of Energy (U.S. DOE) National Energy Technology Laboratory (NETL) for air monitoring conducted in 2012 at a Greene County (Pennsylvania) well pad and from 2011 to 2014 at a Washington County (Pennsylvania) well pad. Currently, data from these studies have only been reported in conference presentations and abstracts, and are not yet available in either study reports or peer-reviewed publications (Orak, Pekney, and Reeder Citation2017; Pekney et al. Citation2013). While there are limited data that could be drawn from these proceedings, it is not readily possible to determine if they are raw or preliminary data, rather than final, quality-controlled data that could be used in our assessment; (2) PM2.5 data reported by Lewis, Hamel, and Brown (Citation2016) for monitoring at several residences between 500 and 2,500 feet from a nearby well pad conducted in Penn Township, Pennsylvania, using a low-cost, handheld PM monitor known as the Speck. While we included data on volatile organic compounds (VOC) from this study in our assessment, we excluded the PM2.5 data given that studies have reported findings that raise questions regarding the accuracy and reliability of PM2.5 data from the Speck (EPA Citation2014a; SCAQMD, Citationn.d; Manikonda et al. Citation2016); (3) VOC data reported by the Pennsylvania Department of Environmental Protection (PADEP) for Open-Path Fourier Transform Infrared (OP-FTIR) measurements during their three short-term ambient air sampling studies (PADEP, Citation2010; Citation2011a, Citation2011b). These data were excluded due to the poor sensitivity of the OP-FTIR as compared to the VOC canister and field gas chromatograph/mass spectrometer (GC/MS) samples also collected as part of this study; (4) Data from indoor air sampling conducted inside the Sky View Elementary School in Morgantown, West Virginia, as part of the U.S. EPA-commissioned TechLaw (Citation2012) study. Only the outdoor air sampling data from this study were used, given that indoor sources may have contributed to measured concentrations for indoor samples, in particular for acetaldehyde and formaldehyde; (5) Air monitoring data for state and local air quality monitors in states besides Pennsylvania that have extensive Marcellus Shale development activities, including West Virginia in particular. Unlike PADEP, the West Virginia DEP (WVDEP) has not installed air quality monitors to specifically measure the impacts of Marcellus Shale development activities, and its existing network of air quality monitors is heavily impacted by other major industrial sources, including coal mines and chemical facilities. Similar to WVDEP, there has been a lack of air quality monitors in Ohio specifically sited near OGD sites, although plans called for the Ohio EPA to commence air monitoring in 2017 near a midstream natural gas processing facility in Harrison County, Ohio (Ohio EPA Citation2017).
For the datasets and studies included in the assessment, we extracted air monitoring data in varying forms, including full datasets, data summary tables, and study summary statistics. We were generally able to obtain full datasets for governmental monitoring, from both state and county air monitoring websites, as well as from the U.S. EPA AQS database. Criteria air pollutant data for all state and local air quality monitors and air toxics data for the Pinnacle State Park monitor in New York were obtained from the U.S. EPA AQS, with 2016 being the last full year of available data. Air toxics data for PADEP air monitors were obtained from the PADEP website and were generally only available for sampling conducted through 2015. For one published study (Goetz et al. Citation2017), the authors freely provided the full dataset of high-resolution measurements at the Dryad data repository (https://doi.org/10.5061/dryad.g8h54). For most non-governmental datasets, however, the raw data were not available and we therefore used existing summary statistics.
We summarized study measurement data by air pollutant, calculating summary statistics whenever we had access to full datasets or compiling summary statistics provided in the paper or report. Summary statistics that were calculated or compiled included the number of samples and detects (or percentage of detects), and mean, median, and maximum concentrations, with the latter three statistics often reported as ranges across either multiple sampling sites or years of data. The lack of raw data from many studies and variability in the summary statistics available from study to study contributed to the qualitative nature of our data assessment, which is based on tabular and graphical summaries rather than a rigorous statistical analysis.
We compared the compiled air quality data to acute and chronic HBACVs (). In these comparisons, we considered the monitoring data from state and local air monitors and from published and other studies separately in order to understand the similarities and differences between these different types of dataset. Importantly, the HBACVs we relied upon are not bright lines above which health effects are expected; instead, due to the use of conservative (i.e., health-protective) assumptions and safety and/or uncertainty factors, they typically specify exposure levels that are typically at least several hundredfold lower than the exposure level at which the actual adverse effect was observed in people or laboratory animals (EPA Citation2004). The exceedance of HBACVs should thus be viewed as indicating that further assessment of the potential exposure scenario is warranted, such as determining how well the data represent actual human exposure conditions and how close measured concentrations are to actual health effect levels.
Table 1. Summary of acute and chronic health-based air comparison values.
For chronic HBACVs, we relied upon the U.S. EPA primary National Ambient Air Quality Standards (NAAQS) for criteria air pollutants. For HAPs and H2S, we relied upon non-cancer U.S. EPA Reference Concentrations (RfCs) and estimated continuous lifetime exposure concentrations associated with a 100-in-a-million excess lifetime cancer risk. For calculating estimated continuous lifetime exposure concentrations for known or suspected human carcinogens (acetaldehyde, benzene, ethylbenzene, and formaldehyde), we relied upon inhalation unit cancer risks available from both U.S. EPA (acetaldehyde, benzene, and formaldehyde) and the California Office of Environmental Health Hazard Assessment (OEHHA) (ethylbenzene only). We based them on a 100-in-a-million lifetime cancer risk consistent with the U.S. EPA residual risk program and with long-term comparison levels developed as part of U.S. EPA’s School Air Toxics Initiative (EPA Citation2009). For air pollutants of interest with both RfCs and cancer-based estimated continuous lifetime concentrations, we used the lower of the two values as the chronic HBACVs.
Although the chronic HBACVs are most appropriate for comparison with long-term exposure concentrations representative of a lifetime of exposure (i.e., 70 years), it is common practice to assume that annual average air concentrations are representative of chronic long-term exposures and we thus compared the chronic HBACVs to annual average air concentrations whenever they were available. Given that many short-term studies conducted sampling over just a few days, weeks, or months, we also compared the chronic HBACVs to air monitoring data with shorter averaging times (e.g., the average of several 24-hour measurements). This comparison of short-term data to chronic HBACVs was done to more fully utilize the body of available data, since most studies did not measure air concentrations for a year or longer. However, this comparison is assumed to be conservative (i.e., erring on the side of overestimating potential risks) because many of the sampling studies targeted transient time periods (e.g., drilling and well completion phases) when OGD emissions were expected to be higher than for typical long-term conditions.
For acute HBACVs, we again relied upon the U.S. EPA primary NAAQS for criteria air pollutants and the lowest of four sets of acute inhalation values specifically developed to be protective of the general public and identified by U.S. EPA as appropriate for hazard identification and dose–response assessment for acute exposure to HAPs (EPA Citation2014b), namely U.S. Agency for Toxic Substances and Disease Registry (ATSDR) acute inhalation Minimal Risk Levels (MRLs), California OEHHA 1-hour Acute Reference Exposure Levels (RELs), 1-hour Acute Exposure Guideline Levels (AEGLs) developed by the National Advisory Committee for Acute Exposure Guideline Levels for Hazardous Substances (NAC), and 1-hour American Industrial Hygiene Association (AIHA) Emergency Response Planning Guidelines (ERPGs). Both the AEGLs and ERPGs are available for varying degrees of severity of effects, and we primarily relied upon 1-hour AEGL-1 and ERPG-1 values that represent the lowest acute exposure thresholds that are protective of mild health effects such as discomfort, irritation, and other mild reversible effects. For n-hexane, no AEGL-1 value is available due to insufficient data; so we relied upon the AEGL-2 value. With the exception of PM2.5 (for which we compared 24-hour average concentrations to the daily PM2.5 NAAQS), sampling data collected over periods of several minutes up to 8 hours was compared with these acute HBACVs. This is a conservative comparison for the ATSDR acute MRLs that are derived to protect against exposure durations of 1–14 days.
Results and discussion
We identified approximately 20 datasets from regulatory agency reports, published studies, and other studies and whitepapers, as well as 15 state and county air monitoring sites meeting our inclusion criteria, totaling approximately 200 sampling locations in areas with Marcellus Shale development (). As discussed more below (and summarized in Table S.2), individual air monitoring datasets and studies have various strengths and limitations, but when pooled they provide an informative dataset for examining air quality nearby to Marcellus Shale development. As shown in , we identified a larger body of data for the VOCs (BTEX, n-hexane) and two of the criteria pollutants of interest (PM2.5 and NO2) than for the carbonyls (acetaldehyde and formaldehyde), SO2, and H2S. While most regulatory, published, and other studies were conducted over study durations of days to months, the state and local air monitoring site datasets provide annual average data, frequently for multi-year periods. The majority of air monitoring site datasets and studies provide data with 24-hour or longer averaging times, but there is a growing body of studies reporting data with averaging times of 1 hour or less that can be used to evaluate episodic short-term air quality impacts. More specifically, Goetz et al. (Citation2015, Citation2017), Swarthout et al. (Citation2015), PADEP (Citation2010, Citation2011a, Citation2011b), Macey et al. (Citation2014), Pekney et al. (Citation2014), and the WVU Air, Noise, and Light Monitoring Study (McCawley Citation2013; Pekney et al. Citation2016) measured 1-hour or sub-hourly concentrations for four or more pollutants of interest. The U.S. DOE NETL studies conducted at well pads in Washington County and Greene County also made extensive 1-hour measurements, but full datasets are not currently available for these studies (Orak, Pekney, and Reeder Citation2017; Pekney et al. Citation2013). A few other studies measured 1-hour or sub-hourly concentrations for a couple of air pollutants of interest (see Table S.1).
Table 2. Summary of 2008–2016 air monitoring data identified for the Marcellus Shale.
Relatively few data were identified for monitoring sites within 500 to 1,000 feet of OGD sites, with the majority of monitoring sites ranging between 0.2 and 1 miles from the nearest OGD site (Tables S.1 and S.3). Several studies (e.g., PADEP Citation2010, Citation2011a, Citation2011b; Swarthout et al. Citation2015; Steinzor, Citation2013; Lewis, Hamel, and Brown Citation2016; McCawley Citation2013; Pekney et al. Citation2016) provide limited monitoring data that provide snapshots of air concentrations within approximately 500 to 1,000 feet of OGD sites. At least one longer-term dataset has been collected within 600 feet of a well pad that provides information on both long-term trends in air concentrations across multiple phases of well pad development as well as episodic short-term air quality impacts, namely the U.S. DOE NETL Washington County Well Pad Monitoring Study (Orak, Pekney, and Reeder Citation2017); however, the full dataset from this study is not currently available, and these data could not be evaluated in this assessment. Most of the data compiled for our evaluation are thus more relevant to what we’ve termed community-level air exposure levels than exposure levels of the people living closest to the OGD sites (i.e., for locations not directly abutting OGD sites, but instead nearby locations within the potential area of air quality impacts where greater amounts of people may reside).
Recent studies with extensive datasets
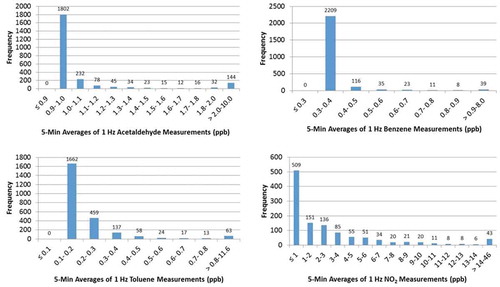
Several of the studies that we evaluated are notable for the strong datasets that they provide, which enhance our understanding of air pollutant concentrations in the Marcellus Shale region. Goetz et al. (Citation2015) and Goetz et al. (Citation2017) collected a large quantity of 1-second data at sampling locations 480 to 1,100 meters downwind of a variety of OGD sites (production well pads, a well pad with a drill rig, a well pad undergoing a well completion, and compressor stations) in wet and dry Marcellus Shale gas regions in both southwest and northwest Pennsylvania as part of an emissions estimation study. The authors provided online access to the raw data for acetaldehyde, benzene, toluene, and NO2. Goetz et al. also measured submicron particle mass (PM1) and C2-benzene (e.g., ethylbenzene, xylenes) concentrations, although these data are not reported in either paper or the raw data files. We used the raw 1-second data for acetaldehyde, benzene, toluene, and NO2 to calculate 5-minute and 24-hour averages for this evaluation. Goetz et al. (Citation2015) provided detection limits for the acetaldehyde, benzene, and toluene measurements, and we converted the concentrations of those species that were below the detection limit to half of these detection limits prior to the averaging. No detection limit was identified for the NO2 data, so the calculated averages are likely biased low due to the fact that some of the data points are zero or slightly lower than zero and thus are presumably below the detection limit of the instrument. Histograms of the 5-minute averages calculated from this dataset show that most are in the lowest concentration categories, with a small subset of measurements showing higher short-term concentrations (). All the 5-minute benzene and toluene concentrations were below 8 and 12 ppb, respectively, and all the acetaldehyde measurements were below 10 ppb. In addition, most of the NO2 measurements were less than or equal to 1 ppb, and the maximum 5-minute concentration was 46 ppb, which is well below the 1-hour NO2 NAAQS of 100 ppb. This sampling methodology is clearly of use for characterizing short-term episodic air quality impacts nearby to OGD sites, but the absence of detection of any peak events in this limited dataset cannot be extrapolated to other sites or even other time periods at these sites due to the limited duration of sampling (total of 28 sampling hours across all monitoring sites).
Figure 1. Histograms of 5-minute air monitoring concentrations calculated from 1 hertz (Hz) data collected by Goetz et al. (Citation2015), Goetz et al. (Citation2017)).
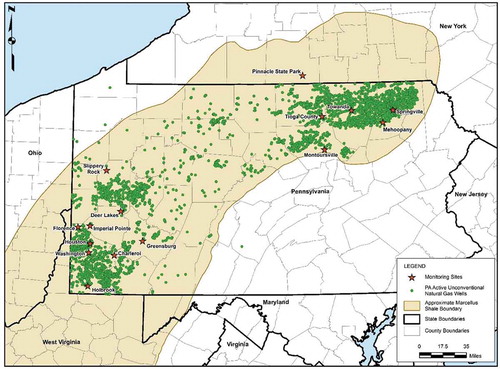
PADEP maintains an extensive statewide network of criteria air pollutant and air toxics monitors across the state, including in both dry and wet gas areas of Marcellus Shale development (e.g., Bradford, Butler, Greene, Susquehanna, Tioga, Washington, Westmoreland, and Wyoming Counties). Several of these monitors were purposely sited to be downwind of nearby OGD sources including well pads, compressor stations, and natural gas processing facilities (e.g., the Houston monitor in Washington County, the Mehoopany monitoring in Wyoming County, the Springville monitor in Susquehanna County, the Tioga monitor in Tioga County, and the Towanda monitor in Bradford County, which were all installed between 2012 and 2014) (PADEP Citation2016). For the 12 PADEP monitors in Marcellus Shale development areas for which we compiled air monitoring data, distances to the nearest well pad range from approximately 0.2 up to 3 miles (Table S.3). illustrates the large number of active well pad sites in close proximity to the PADEP monitoring sites used in this evaluation. Some of these monitors are also in close proximity to other OGD air emissions sources – such as the Houston monitor, which is approximately half a mile from a large gas processing facility and about 1.5 miles from a large compressor station. Air monitoring data available for these monitors include hourly PM2.5, NO2, SO2, and H2S data, and 24-hour VOC and carbonyls (acetaldehyde, formaldehyde) data (Table S.3). Data for acetaldehyde and formaldehyde are only available for sampling conducted between August 2012 and December 2013 at the Houston site and the temporary Henderson site as part of the PADEP “Long-term Ambient Air Monitoring Project: Marcellus Shale Gas Facilities” (PADEP Citation2018). Additional carbonyl samples have also been collected at the Houston air monitoring site since December 2013, although these data are not available from PADEP due to technical issues that resulted in most of the data being voided by the contract lab (personal communication, Renee Bartholomew, Section Chief, Air Toxics Monitoring, Pennsylvania Department of Environmental Protection, April 2017).
Figure 2. Location of state and local air monitoring sites in the Marcellus Shale Region relative to active unconventional natural gas wells (PADEP Citation2017; U.S. Energy Information Administration (EIA) Citation2017; U.S. Census Bureau Citation2016a, Citation2016b).
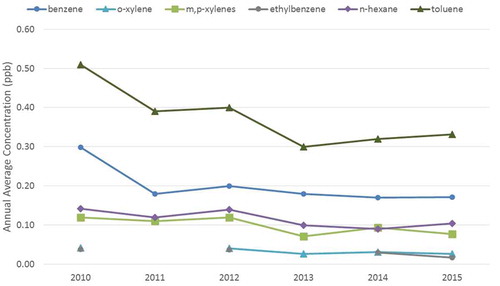
Given their close proximity to OGD air emission sources and the frequent availability of multi-year records of air monitoring data, the PADEP monitors provide useful datasets for assessing air quality in the Marcellus Shale region. In particular, these monitors provide the longest time series of VOC data available for the shale region ( and ), including a couple of sites with records dating from 2009 or 2010, a time period of rapid OGD increases in the Marcellus Shale. shows the cumulative number of active wells from 1980 to 2016 for Westmoreland County, where the PADEP Greensburg monitor is located. As shown in , mean concentrations of benzene, xylenes, ethylbenzene, toluene, and n-hexane at the Greensburg monitor have been fairly stable between 2010 and 2015, which is also true of the other six monitors listed in and .
Table 3. Range of annual averages of mean 24-hour HAP measurements for PADEP and NYDEC monitors in or near Marcellus Shale development areas.
Table 4. Range of annual maximum 24-hour HAP measurements for PADEP and NYDEC monitors in or near Marcellus Shale development areas.
Figure 3. Time series of Westmoreland County oil and gas wells from 1980 to 2016. Data are based on the spud dates of currently active wells (PADEP Citation2017).
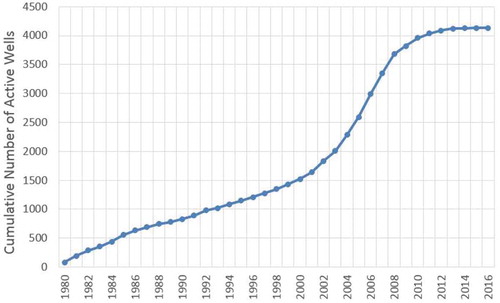
Figure 4. Measured VOC concentrations at the PADEP Greensburg monitoring site in Westmoreland County from 2010 to 2015. The absence of some data points for ethylbenzene (2011 and 2013) and o-xylene (2011) indicates that the VOC was detected in less than 15% of samples and PADEP did not report an annual average concentration.
PADEP’s “Long-term Ambient Air Monitoring Project: Marcellus Shale Gas Facilities” (PADEP Citation2018) is an additional source of nearly 1.5 years of data for each of the air pollutants of interest except SO2 at four air monitoring sites in Washington County, PA. These sites are surrounded by producing well pads and in close proximity (within 0.5 miles) to other major OGD facilities, including a large natural gas processing facility and compressor stations. As a follow-up study to the three PADEP short-term air sampling studies conducted between April and December 2010 in three regions of PA with Marcellus Shale development activities (PADEP Citation2010, Citation2011a, Citation2011b), this study was specifically conducted between July 2012 and December 2013 to “determine any chronic or long-term risks to the public from individual or multiple shale gas sources” (PADEP Citation2018). ATSDR prepared a public health evaluation based on the PADEP long-term air sampling data (ATSDR Citation2018).
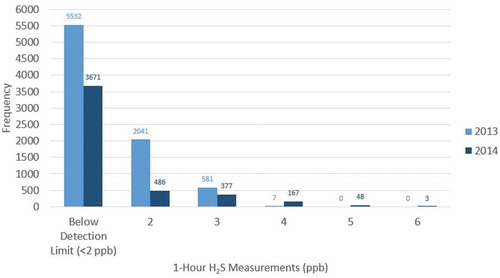
This study is notable for the collection of long-term VOC, aldehyde, and H2S data, which provide useful information for assessing chronic exposures at the community-based monitoring locations. PADEP (Citation2018) concluded that calculated chronic cancer risks and non-cancer hazards for the project HAP sites were comparable to those for a historical PA background ambient monitoring site. Given the 24-hour sample duration and the 1-in-6–day sampling schedule, the VOC and aldehyde data do not provide information on episodic short-term exposures. H2S measurements were made at two of the four sites, although two different methods were used and PADEP (Citation2018) concluded that only the hourly H2S data for the Houston site are reliable due to methodological problems at the other site as well as potential confounding from an adjacent sewage treatment facility. provides a histogram of the hourly H2S data available for the Houston site for the years 2013 and 2014, showing a significant number of non-detects (>70%) and a maximum 1-hour concentration of 6 ppb that is well below the acute HBACV of 30 ppb (note that almost all data points for 2012 were zero or negative and are not shown due to a possible instrumental problem).
Figure 5. Histogram of PADEP Houston monitor hydrogen sulfide measurements for 2013–2014. Note that Pennsylvania Dept. of Environmental Protection (PADEP) (Citation2018) refers to the Houston site as the Meddings Road site.
Air quality during baseline versus OGD activity time periods
Only a limited number of air monitoring studies conducted in proximity of well pads and other OGD air emission sources have made baseline air measurements before the start of OGD activities, which can provide data on local background air concentrations for comparison with measurements during OGD activity periods. For example, the Allegheny County Health Department (ACHD) installed the Deer Lakes and Imperial Pointe temporary monitors in 2014 to monitor the air quality impacts of developing OGD activity in Allegheny County, PA, with the Deer Lakes monitor located approximately 0.85 miles from the closest well pad and the Imperial Pointe monitor located approximately 0.3 miles from the closest well pad. The 4 years of data available for each of these sites (2014–2017 data; ACHD Citation2018a, Citation2018b) have been categorized by ACHD according to activity time periods (baseline, site construction, drilling, fracking, and production) at the nearest well pads. Both monitors were decommissioned in May 2017.
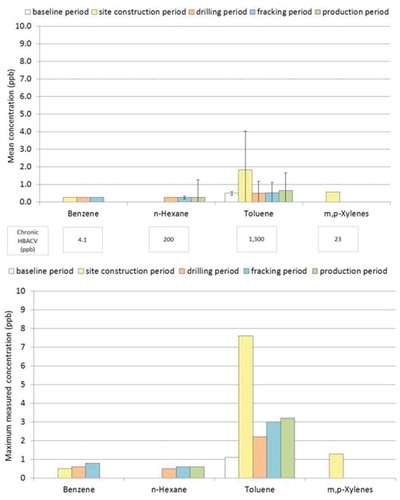
Plots of the mean and maximum HAP concentrations for each site show that there is some variability in concentrations across the different time periods ( and ). For the Deer Lakes site where 14-day air samples were collected, the mean concentrations of benzene and toluene were similar during OGD activity and baseline periods, as are the maximum benzene concentrations. The maximum toluene concentration during the baseline period was about half of the maximum toluene measured during an OGD activity period (drilling), suggesting that some OGD activities may be associated with short-term toluene emissions. Regardless, all measured toluene concentrations were less than 1 ppb and thus very low; similarly low concentrations of m,p-xylenes and n-hexane (<1 ppb) were measured during the drilling period, with non-detects for other phases of development at the nearest well pad. For the Imperial Pointe monitor where 24-hour air samples were collected, toluene was the only pollutant of interest detected during the baseline period, and measurements of toluene during OGD activity periods had peak concentrations approximately 2–8 times the baseline measurements, although mean concentrations for all activity periods but the site construction period were similar to the baseline mean. There were only infrequent detects of low concentrations of benzene, n-hexane, and xylenes (<2 ppb) at the Imperial Pointe monitor during OGD activity periods. As discussed below, overall mean concentrations of all species at both sites are well below chronic HBACVs.
Figure 6. Mean and maximum measured HAP concentrations for 14-day samples collected between June 2014 and May 2017 at the ACHD Deer Lakes air monitoring site. NO2 measurements made at this site are excluded from this figure because these measurements were only collected during the baseline period. The absence of bars for some VOCs (ethylbenzene, o-xylene) and for some phases of development (e.g., the site construction phase for benzene; all phases but the drilling phase for m,p-xylenes and n-hexane) indicates a lack of any detections. Mean concentrations are for detects only given the lack of detection limits in ACHD (Citation2018a); mean concentrations include confidence intervals of ±1 SD, except when the bar represents a single data point. The sources of the chronic health-based air comparison values (HBACVs) are detailed in .
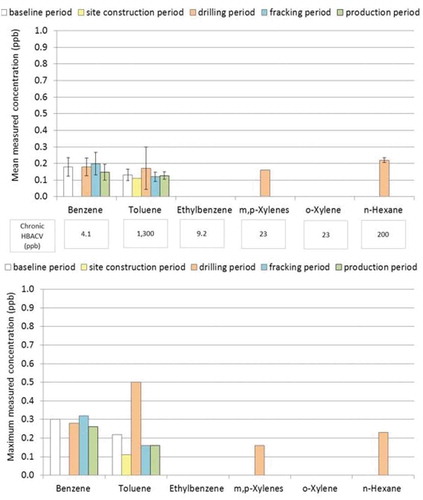
Figure 7. Mean and maximum measured HAP concentrations for 24-hour sampling between March 2014 and May 2017 at the ACHD Imperial Pointe air monitoring site. Mean concentrations assume half of the detection limit for non-detects and include confidence intervals of ±1 SD, except when the bar represents a single data point. Similar to , the absence of bars for some VOCs and development phases indicates an absence of any detections. The sources of the chronic health-based air comparison values (HBACVs) are detailed in .
For their study in Washington County, PA, Maskrey et al. (Citation2016) sampled during four different activity periods at the closest multiple-unit well pad, including a baseline sampling period when “the wellpad was relatively inactive and preparations were being made for hydraulic fracturing.” Benzene, n-hexane, and toluene were detected during both the baseline and OGD activity periods; m,p-xylenes were detected only during the baseline period; and ethylbenzene and o-xylene were not detected during any sampling period. The average benzene, n-hexane, and toluene concentrations during OGD activity periods were higher than during baseline periods; however, the concentrations of these species did not exceed 2 ppb during any period and therefore, as discussed further below, provide no evidence of VOC concentrations of public health concern.
Comparison of air quality data to acute and chronic HBACVs
Comparisons with HBACVs are useful for understanding whether measured air concentrations are at levels of potential human health concern. In and , air pollutant concentrations across all Marcellus Shale monitoring sites and studies are compared with acute and chronic HBACVs. For the acute HBACVs, any study or monitoring site with data averaging times of 8 hours or less was considered (except for PM2.5, for which 24-hour concentrations were used to match the averaging time of the HBACV), and for the chronic HBACVs, two comparison datasets were considered: annual average concentrations calculated from state and local air monitoring network data, and average concentrations of data collected during other Marcellus Shale study measurement campaigns. A dataset consisting of average concentrations from the various Marcellus Shale air quality studies is not a preferred dataset for comparison to chronic HBACVs, because with a few notable exceptions (e.g., PADEP Citation2018), most of the study data were collected over periods of days to weeks and therefore may not be representative of long-term exposures. Although there is large uncertainty as to whether these concentrations are representative of long-term exposures for which chronic HBACVs are developed, we used these data in the chronic HBACV comparisons so as to fully utilize the available data.
Table 5. Comparison of short-term measurements with acute health-based air comparison values (HBACVs).
Table 6. Comparison of measurements with chronic health-based air comparison values (HBACVs).
We found that most of the available Marcellus Shale air measurements are below or only slightly above health-based standards and guidelines. As shown in and , all available data for NO2, acetaldehyde, ethylbenzene, n-hexane, toluene, and xylenes are below the acute and chronic HBACVs. For benzene, formaldehyde, SO2, PM2.5, and H2S, there were measurements above one or both of the HBACVs; however, for most of these pollutants, the benchmark exceedances are limited to a small fraction of available measurements and sites, rather than being representative of the breadth of available measurements.
There were some exceedances of acute HBACVs for a subset of the air pollutants of interest: SO2, PM2.5, formaldehyde, and H2S. These exceedances were for a limited number of the available datasets with high-resolution sampling data (e.g., hourly and sub-hourly data) and thus provide evidence of sporadic short-term air pollutant events of potential health concern, rather than evidence of frequent occurrences of short-term peak events that coincide with the significant increases in OGD activities in these counties. For example, most of the exceedances of the SO2 and PM2.5 acute HBACVs are for 2008 and 2009 measurements. Some of the lowest maximum 1-hour SO2 and 24-hour PM2.5 concentrations have been observed at the monitors specifically sited by PADEP to be downwind of oil and gas sites. For example, PADEP discontinued SO2 monitoring at the Holbrook monitoring site in Greene County, which is located in an area with extensive unconventional shale gas activities, due to the consistent record of low hourly SO2 concentrations measured between 2010 and 2016 when annual maximum 1-hour SO2 concentrations ranged from 12 to 35 ppb (PADEP Citation2016). In 2016, maximum 24-hour PM2.5 concentrations of 14.5 and 20.9 μg/m3 were measured at newly installed PM2.5 monitors at the Holbrook and Towanda (Bradford County) sites; between 2014 and 2016, maximum PM2.5 concentrations ranging from 17.6 to 21.5 μg/m3 were recorded at the Tioga County site (Table S.6). Between 2012 and 2014, when PM2.5 monitoring was conducted at the Houston site in Washington County, which is located close to a large gas processing facility and a large compressor station, maximum 24-hour PM2.5 concentrations ranged from 20.1 to 29.7 μg/m3. While we identified only four H2S datasets, the exceedances of the acute HBACV of 30 ppb are for only maximum 5-minute measurements from a single study (ATSDR Citation2016b).
Although overall there were few exceedances of acute HBACVs, it is important to note the relative scarcity of high-resolution air monitoring data for each of the air pollutants of interest that are necessary for better characterizing the timing, frequency, and maximum-impact locations of short-term episodic air quality impacts from OGD operations. As discussed by McMullin et al. (Citation2018), a number of dynamic factors are expected to contribute to variability in short-term air quality impacts from OGD operations (e.g., episodic emissions, local-scale meteorological conditions, operator-specific processes, different durations of processes) and complicate the extrapolation of the available body of high-resolution measurements to other time periods and sites. It is encouraging that Marcellus Shale air quality studies are increasingly collecting high-resolution data, and that most of these data are below levels of health concern; but more data are needed to confirm that measurements are capturing the variability in short-term air quality impacts that may arise from the various OGD-related air emissions sources, and to identify whether specific activities or phases of operation may contribute to short-term episodic air quality impacts of potential health concern. These data are particularly needed for residential locations closest to OGD operations.
Chronic HBACV exceedances were also observed for a subset of the air pollutants of concern (PM2.5, benzene, formaldehyde, and H2S). These exceedances were generally limited to a small number of the available datasets, particularly the more limited datasets with measurements representative of time periods of days to weeks rather than chronic exposure periods of 1 year or longer. These chronic HBACV exceedances are thus suggestive of possible long-term air concentrations of potential chronic health concern at a limited number of monitored sites, but it remains unclear how representative the limited monitoring data are of chronic exposure periods.
For example, of the more than 20 datasets with benzene measurements made over at least multi-day time periods, only mean benzene concentrations from the WVU Air, Noise, and Light Monitoring Study (McCawley Citation2013; Pekney et al. Citation2016) exceeded the chronic HBACV of 4.1 ppb (). Ranging from 4.2 to 48.7 ppb, mean benzene concentrations from four of the seven sites included in the study exceeded the chronic HBACV, due to elevated concentrations for some of the small number of 72-hour canister samples taken at each site (4–8 samples per site). At each of these well pad sites, either drilling (horizontal or vertical) or hydraulic fracturing/flowback was occurring during the air sampling. Given that these short-term activities typically occur over time periods of days to weeks for a well on a well pad, there is uncertainty as to how representative these 72-hour samples are of chronic exposure periods. The study investigators also noted the diesel-fueled generator used at some of these sites as a possible air emissions source. Recognizing these uncertainties, these data provide evidence of elevated short-term benzene concentrations close to well pads that have the potential to contribute to long-term benzene exposures above the chronic HBACV, depending on the frequency and duration of benzene emission sources. Other studies with longer records of measurements, however, do not provide evidence of long-term benzene concentrations of potential health concern, including the ACHD (Citation2018a, Citation2018b) and the PADEP (Citation2018) datasets.
The levels of the maximum 72-hour benzene concentrations at these four sites (8.2 to 85 ppb) indicate that 1-hour benzene concentrations within these sampling periods were also presumably in excess of the acute HBACV of 8.5 ppb (note that these data are not included in the comparisons with the acute HBACVs given that they do not have 1-hour averaging times that correspond to the acute HBACVs). These data from the WVU Air, Noise, and Light Monitoring Study thus provide evidence of possible short-term benzene concentrations of potential acute health concern at some of the study sites. However, it is also important to note that hourly average benzene concentrations were also measured continuously at six of the seven sites in this study, including all four sites with the elevated benzene measurements, using a Perkin Elmer Ozone Precursor Analyzer System in the U.S. DOE NETL Mobile Air Monitoring Laboratory (Pekney et al. Citation2016). The NETL mobile laboratory was stationed at a single downwind location during the 1–4 week monitoring periods at each site, and was generally in close proximity to one or two, but not all, of the canister sampling locations (Pekney et al. Citation2016). Despite a sub-ppb quantitation limit, benzene was detected in less than 10% of the hourly samples for each of the six sites, which was the threshold above which hourly VOC data were reported (Pekney et al. Citation2016). The hourly benzene results thus do not support the frequent occurrence of elevated episodic short-term benzene concentrations, albeit for sampling at one location in close proximity to the study well pads.
For formaldehyde, the only exceedance of the chronic HBACV of 6.3 ppb was for a 2-day average concentration of 27.4 ppb from the Macey et al. (Citation2014) study, while average concentrations representative of longer time periods from PADEP (Citation2018) and ATSDR (Citation2016b) ranged from 0.67 to 3.4 ppb and were thus well below the HBACV. The Macey et al. (Citation2014) study was focused on characterizing potential short-term air emission events, as sampling was conducted by volunteers when they observed odors, could see emissions, or experienced acute health symptoms; as a result, there is uncertainty as to the relevance of these samples to long-term exposure conditions. Likewise, the highest study-average PM2.5 concentrations of 17–19 μg/m3 were measured during the 2-month ATSDR Brooklyn Township study (ATSDR Citation2016a), while substantially lower annual average PM2.5 concentrations in the range of 4.7–9.3 μg/m3 have been observed between 2012 and 2016 for four PM2.5 monitors specifically sited by PADEP to be downwind of OGD activities (Table S.6). These shorter-duration data should not be dismissed as being irrelevant to potential chronic health concerns, but additional long-term data are needed to further investigate whether transient processes and episodic emissions events at well pads can contribute to long-term air pollutant concentrations of potential chronic health concern.
Limitations and uncertainties
Given that they are actual measured concentrations, ambient air monitoring data have long been used for evaluating airborne chemical exposures (EPA Citation2004). It is widely recognized, however, that air monitoring data have inherent limitations for characterizing population air pollutant exposures. In particular, ambient air monitoring data provide estimates of air exposure levels at the monitoring sites themselves at the times of monitoring, and may not be representative of actual exposure conditions, broader geographic areas, or other time periods. This fundamental limitation of air monitoring data is not unique to Marcellus Shale air quality data. Like any air monitoring dataset, there is uncertainty as to how well the available Marcellus Shale air monitoring data characterize the range of potential exposures for people living nearby to OGD sites. This uncertainty may be amplified in the Marcellus Shale region as compared to air monitoring in an area with a single point source such as a power plant, given that the variability in OGD air emissions – as well as the high density of different OGD sites in some areas – may contribute to rapid changes in air pollutant concentrations across time and space.
The relative sparseness of air monitoring sites in the Marcellus Shale region is especially a challenge for the characterization of air pollutant hotspots, in particular for episodic peak air pollutant events. Relatively few studies have measured VOC concentrations for sampling frequencies of 1-hour or less, and the available studies with such high-resolution measurements (e.g., Goetz et al. Citation2017, Citation2015; McCawley Citation2013; Orak, Pekney, and Reeder Citation2017; Pekney et al. Citation2016) have generally conducted sampling at a single location nearby to a well pad or other OGD site. There is thus uncertainty as to whether the available data are capturing maximum, intermittent acute exposure levels associated with episodic peak events. Moreover, it is unclear whether the available Marcellus Shale monitoring data include super-emitting sites – defined as high-emission facilities that represent a small fraction of the total body of facilities, but which contribute the majority of air emissions (Allen Citation2016; Lyon et al. Citation2016). While super-emitting sources such as venting wells, pneumatic controllers, leaking tanks, and compressors are possible in the Marcellus Shale region, Lyon et al. (Citation2016) reported a smaller number of high-emitting hydrocarbon sources for the Marcellus Shale region (1%) as compared to other shale gas plays (e.g., 14% for the Bakken, 5.4% for the Eagle Ford, 3.5% for the Barnett), based on infrared camera surveys that they conducted by helicopter for over 8,000 oil and gas well pads in seven U.S. basins.
Another important limitation of using air monitoring data to characterize OGD impacts in the Marcellus Shale region is that ambient monitors measure levels of total (all-source) ambient pollutants. In other words, they are not specific to a single source type, such as well pad emissions. In particular, PM2.5 and SO2 are regional pollutants that have many emission sources, and the state and local air monitoring networks are clearly impacted by other significant local and regional sources of these pollutants (e.g., power plants, steel and coke plants, industrial boilers, mobile sources). Air toxics such as the BTEX species also have a number of common emission sources, including vehicular emissions in particular. While studies of Marcellus Shale development air quality impacts have attempted to site monitors in areas not highly influenced by other local air pollution sources, it is expected that local and regional air pollution sources remain significant contributors to both short-term episodic air pollution events and long-term average pollutant concentrations in most of the available datasets.
Conclusion
As described in this assessment, there is now available a sizable body of Marcellus Shale air monitoring data that provides insights on the nature and potential public health significance of community-level air quality impacts of OGD-related activities. Overall, this assessment of short-term and longer-term data for air monitoring conducted in proximity to OGD air emission sources in the Marcellus Shale region showed that the available air pollutant measurements were generally less than acute and chronic HBACVs. We identified a small number of sporadic exceedances of acute and chronic HBACVs for the air pollutants of interest that were not focused on specific pollutants, time periods, or measurement sites. Therefore, the available data indicate that air pollutant levels within the Marcellus Shale development region typically are below HBACV exceedance levels; however, the sporadic HBACV exceedances warrant further investigation to better understand the representativeness of the exceedances and whether there may be public health concerns associated with specific site characteristics or certain operations or sources (e.g., leaks, super-emitters).
We have highlighted limitations to the available air monitoring data, including the relative sparseness of samplers around OGD sites (particularly for locations within 1,000 feet of OGD sites), the limited availability of high-resolution data needed to characterize episodic peak air quality impacts, and the short duration of sampling (i.e., days to months rather than a year or years) of many studies. As a result of these limitations and spatial and temporal variability in OGD-related air quality impacts, it is unlikely that the available data are representative of the full range of potential air quality impacts and human exposures, either on a short-term (e.g., hourly) or chronic (e.g., annual average) basis. In order to help compensate for limitations in the available data, we assumed that short-term measurements made over days to weeks are representative of long-term air concentrations so as to fully utilize the available data and to minimize the underestimation of exposure.
Several of the studies from which we obtained air monitoring data compared their measurements with health-protective levels and reached similar conclusions regarding a lack of or limited evidence of potential health risks, including EPA (Citation2015), PADEP (Citation2018, Citation2010, Citation2011a, Citation2011b), ATSDR (Citation2018), Maskrey et al. (Citation2016), and Swarthout et al. (Citation2015). Our findings are also consistent with those reported for two other integrative air quality data assessments for different shale gas plays. For example, scientists at the Colorado Department of Public Health & Environment (CDPHE) recently conducted a screening-level public health assessment of air quality data from 47 datasets collected in areas of Colorado with substantial oil and gas operations (CDPHE Citation2017; McMullin et al. Citation2018). Finding that all measured air concentrations of 62 VOCs included in the assessment were below short-term and long-term health-based reference values, CDPHE concluded, “Overall, available air monitoring data suggest low risk of harmful health effects from combined exposure to all substances.” Working with several different datasets for air sampling conducted along Colorado’s Northern Front Range in summer 2014, which included some of the same data evaluated by the CDPHE scientists, McKenzie et al. (Citation2018) reached similar findings regarding a lack of evidence of elevated health risks for data representing locations at least 500 feet from OGD facilities. For a limited amount of air monitoring data collected within 500 feet from OGD facilities, McKenzie et al. reported evidence of higher acute non-cancer hazards and cancer risks that exceeded regulatory thresholds. Though suggestive of higher chronic health risks for populations living the closest to OGD sites, it should be noted that these risk estimates are highly uncertain given that the study authors extrapolated from daily 1-minute grab air samples collected over about a month to estimate both 1-hour and chronic (>1 year) exposures.
Utilizing a dataset consisting of 4.6 million data points from six different monitoring locations selected to represent community-wide ambient air exposures in the Dallas–Fort Worth area within Texas’s Barnett Shale region, Bunch compared 1-hour and 24-hour data with federal and state acute or short-term HBACVs and annual average concentrations with chronic HBACVs. Based on their assessment, Bunch et al. (Citation2014) concluded, “The analyses demonstrate that, for the extensive number of VOCs measured, shale gas production activities have not resulted in community-wide exposures to those VOCs at levels that would pose a health concern.”
There is a continuing need for additional air monitoring studies that are carefully designed to collect data representative of potential human exposures, including not only typical long-term exposures for nearby communities but also peak episodic exposures. Sampling sites should be carefully selected based on a number of factors, including to be downwind of nearby OGD operations; to reflect heterogeneity in residential proximity; to be representative of the range of local meteorology and terrain; and to capture different OGD site types and operations (e.g., each of the phases of well pad development). Depending on detailed profiles of air pollutants emitted from OGD operations, consideration should be given to monitoring of additional OGD constituents and reaction products, such as polycyclic aromatic hydrocarbons (PAHs) and alcohols. For example, there is a general absence of data from the Marcellus Shale region for PAHs, although a recent study conducted in the nearby Utica Shale region in Ohio reported low PAH concentrations comparable to or lower than both urban and rural background PAH levels (Paulik et al. Citation2016). Interpretation of PAH measurements may be challenging, however, due to the large number of contributing sources, including vehicle emissions and woodburning. Besides providing either full datasets or complete summary statistics, it is recommended that future datasets and studies categorize data according to well pad development phases, as done by some studies including ACHD (Citation2018a, Citation2018b) and Maskrey et al. (Citation2016).
Efforts are also needed to publicly disseminate some of the more comprehensive datasets that have already been collected. For example, it is our understanding that the U.S. DOE NETL air monitoring studies conducted at a Greene County (PA) well pad in 2012 and at a Washington County (PA) well pad from 2011 to 2014 used near-continuous instruments to measure both short-term episodic air quality impacts and long-term average concentrations of a suite of criteria air pollutants and VOCs for different phases of well pad development, including baseline measurements prior to the start of well pad development (Orak, Pekney, and Reeder Citation2017; Pekney et al. Citation2013).
Once additional data are available to address some of the limitations in the currently available body of Marcellus Shale air measurement data, it may be possible to conduct a quantitative human health risk assessment to characterize any potential human health risks associated with community-level air quality impacts of Marcellus Shale development. As emphasized in this assessment, such a quantitative risk assessment should address potential health risks associated with both episodic peak exposures as well as chronic exposures.
Supplemental Material
Download PDF (532.8 KB)Disclosure statement
The authors are employed by Gradient, a private environmental consulting firm. The work reported in this paper was conducted during the normal course of employment. This paper was prepared with financial support from the American Petroleum Institute (API) and was reviewed by members of API while in preparation. The authors retain sole responsibility for the writing and content of this paper, which represent the professional opinions of the authors and not necessarily those of API or its member companies. Gradient has worked with natural gas development companies active in the Marcellus Shale region over the past 36 months; none of these clients were involved with the conception or drafting of this manuscript. One of the authors of this manuscript (C. Long) has testified in Pennsylvania at a judicial hearing and local zoning hearing board meetings on the science of the air quality impacts of Marcellus Shale development activities.
Supplemental data
Supplemental data for this paper can be accessed on the publisher’s website.
Additional information
Notes on contributors
Christopher M. Long
Christopher M. Long is a Senior Risk Assessor and Toxicologist with Gradient in Cambridge, MA.
Nicole L. Briggs
Nicole L. Briggs is a Senior Air Quality Scientist with Gradient in Seattle, WA.
Ifeoluwa A. Bamgbose
Ifeoluwa A. Bamgbose is an Environmental Toxicologist with Gradient in Cambridge, MA.
Related Research Data
References
- Agency for Toxic Substances and Disease Registry (ATSDR). 2016a. Health consultation: Brooklyn township PM2.5, Brooklyn township, Susquehanna County, Pennsylvania. 35, Accessed April 22. https://www.atsdr.cdc.gov/HAC/pha/BrooklynTownship/BrooklynTwnsp_pm2-5_HC_Final_04-22-2016_508.pdf.
- Agency for Toxic Substances and Disease Registry (ATSDR). 2016b. Health Consultation, Exposure Investigation, Natural Gas Ambient Air Quality Monitoring Initiative, Brigich Compressor Station. Chartiers Township, Washington County, Pennsylvania. 94p., January 29.
- Agency for Toxic Substances and Disease Registry (ATSDR); Pennsylvania Department of Health. 2018. Health Consultation: Public Health Evaluation of Long-Term Air Sampling Data Collected in the Vicinity of Natural Gas Operations, Washington County, Pennsylvania. 91, July 18.
- Allegheny County, Pennsylvania, Health Dept. (ACHD). 2018a. Deer lakes ambient air sampling results/radiello passive monitors (2014-2017). 14 Pittsburgh, PA: ACHD.
- Allegheny County, Pennsylvania, Health Dept. (ACHD). 2018b. Imperial pointe ambient air sampling results/method EPA TO15 + tentatively identified compounds (2014-2017). 15. Pittsburgh, PA: ACHD.
- Allen, D. T. 2016. Emissions from oil and gas operations in the United States and their air quality implications. J. Air Waste Manag. Assoc. 66 (6):549–75. doi:10.1080/10962247.2016.1171263.
- Bunch, A. G., C. S. Perry, L. Abraham, D. S. Wikoff, J. A. Tachovsky, J. G. Hixon, J. D. Urban, M. A. Harris, and L. C. Haws. 2014. Evaluation of impact of shale gas operations in the Barnett Shale region on volatile organic compounds in air and potential human health risks. Sci. Total Environ. 468-469:832–42. doi:10.1016/j.scitotenv.2013.08.080.
- ChemRisk. 2012. Letter Report to R. Dinnen (Fort Cherry School District) re: Air Monitoring Results for the Fracking and Flaring Phases of Gas Extraction Operations at the Chiarelli Well Pad. 89. February 3.
- Colorado Dept. of Public Health and Environment (CDPHE). 2017. Assessment of potential public health effects from oil and gas operations in Colorado. Denver, CO: Oil and Gas Health Information and Response Program. 66. February 21.
- Goetz, J. D., A. Avery, B. Werden, C. Floerchinger, E. C. Fortner, J. Wormhoudt, P. Massoli, S. C. Herndon, C. E. Kolb, W. B. Knighton, et al. 2017. Analysis of local-scale background concentrations of methane and other gas-phase species in the Marcellus Shale. Elementa 5:1. doi:10.1525/elementa.182.
- Goetz, J. D., C. Floerchinger, E. C. Fortner, J. Wormhoudt, P. Massoli, W. B. Knighton, S. C. Herndon, C. E. Kolb, E. Knipping, S. Shaw, et al. 2015. Atmospheric emission characterization of Marcellus shale natural gas development sites. Environ. Sci. Technol. 49 (11):7012–20. doi:10.1021/acs.est.5b00452.
- Goldstein, B. D., B. W. Brooks, S. D. Cohen, A. E. Gates, M. E. Honeycutt, J. B. Morris, J. Orme-Zavaleta, T. M. Penning, and J. Snawder. 2014. The role of toxicological science in meeting the challenges and opportunities of hydraulic fracturing. Toxicol. Sci. 139 (2):271–83. doi:10.1093/toxsci/kfu061.
- Hammack, R. W. 2015. Environmental monitoring at a marcellus shale site in Greene County, Pennsylvania. Presented at California Well Stimulation (CWS) Forum, Los Angeles, CA. 31. July 24.
- Health Effects Institute (HEI). 2015. Strategic research agenda on the potential impacts of 21st century oil and natural gas development in the Appalachian region and beyond. Scientific Committee on Unconventional Oil and Gas Development in the Appalachian Basin. 240. October.
- Health Effects Institute (HEI). 2018. Unconventional oil and gas development bibliography: April 2018 monthly update. Energy Research Program. 126. April.
- Lewis, C., K. Hamel, and D. Brown. 2016. Community assessment of Penn Trafford outdoor air monitoring results. 11. June 6. McMurray, PA: Southwest Environmental Health Project.
- Lyon, D. R., R. A. Alvarez, D. Zavala-Araiza, A. R. Brandt, R. B. Jackson, and S. P. Hamburg. 2016. Aerial surveys of elevated hydrocarbon emissions from oil and gas production sites. Environ. Sci. Technol. 50:4877–86. doi:10.1021/acs.est.6b00705.
- Macey, G. P., R. Breech, M. Chernaik, C. Cox, D. Larson, D. Thomas, and D. O. Carpenter. 2014. Air concentrations of volatile compounds near oil and gas production: A community-based exploratory study. Environ. Health 13:82. doi:10.1186/1476-069X-13-82.
- Manikonda, A., N. Zikova, P. K. Hopke, and A. R. Ferro. 2016. Laboratory assessment of low-cost PM monitors. J. Aerosol Sci. 102:29–40. doi:10.1016/j.jaerosci.2016.08.010.
- Maskrey, J. R., A. L. Insley, E. S. Hynds, and J. M. Panko. 2016. Air monitoring of volatile organic compounds at relevant receptors during hydraulic fracturing operations in Washington County, Pennsylvania. Environ. Monit. Assess. 188 (7):410. doi:10.1007/s10661-016-5410-4.
- McCawley, M. 2013. Air, noise, and light monitoring results for assessing environmental impacts of horizontal gas well drilling operations (ETD-10 project). Report to West Virginia Dept. of Environmental Protection. 206. May 3. Accessed on December 21, 2016 at http://wvwri.org/wp-content/uploads/2013/10/A-N-L-Final-Report-FOR-WEB.pdf.
- McCawley, M. 2015. Air contaminants associated with potential respiratory effects from unconventional resource development activities. Semin. Respir. Crit. Care Med. 36 (3):379–87. doi:10.1055/s-0035-1549453.
- McKee, R. H., D. Herron, M. Saperstein, P. Podhasky, G. M. Hoffman, and L. Roberts. 2014. The toxicological properties of petroleum gases. Int. J. Toxicol 33 (Suppl.1):28S–51S. doi:10.1177/1091581813504225.
- McKenzie, L. M., B. D. Blair, J. Hughes, W. B. Allshouse, N. Blake, D. Helmig, P. Milmoe, H. Halliday, D. R. Blake, and J. L. Adgate. 2018. Ambient non-methane hydrocarbon levels along colorado’s northern front range: Acute and chronic health risks. Environ. Sci. Technol. 52 (8):4514–25. doi:10.1021/acs.est.7b05983.
- McKenzie, L. M., R. Guo, R. Z. Witter, D. A. Savitz, L. S. Newman, and J. L. Adgate. 2014. Birth outcomes and maternal residential proximity to natural gas development in rural Colorado. Environ. Health Perspect. 122 (4):412–17. doi:10.1289/ehp.1306722.
- McKenzie, L. M., R. Z. Witter, L. S. Newman, and J. L. Adgate. 2012. Human health risk assessment of air emissions from development of unconventional natural gas resources. Sci. Total Environ. 424:79–87. doi:10.1016/j.scitotenv.2012.02.018.
- McMullin, T. S., A. M. Bamber, D. Bon, D. I. Vigil, and M. Van Dyke. 2018. Exposures and health risks from volatile organic compounds in communities located near oil and gas exploration and production activities in Colorado (U.S.A.). Int. J. Environ. Res. Public Health 15 (7):1500. doi:10.3390/ijerph15071500.
- Moore, C. W., B. Zielinska, G. Petron, and R. B. Jackson. 2014. Air impacts of increased natural gas acquisition, processing, and use: A critical review. Environ. Sci. Technol. 48 (15):8349–59. doi:10.1021/es4053472.
- Ohio Environmental Protection Agency (OhioEPA). 2017. 2017-2018 Ohio EPA air monitoring network plan (Draft). 32. June. Columbus, OH: Ohio DEP.
- Orak, N. H., N. J. Pekney, and M. Reeder. 2017. Ambient air quality near a Marcellus shale well pad in southwestern Pennsylvania. Presented at the Air and Waste Management Association’s 110th Annual Conference and Exhibition, Pittsburgh, PA. June 7. Accessed at https://www.eventscribe.com/2017/awma/ajaxcalls/PresentationInfo.asp?efp=SFRXUFlFQkIzMjEz&PresentationID=262009&rnd=0.2957729.
- Paulik, L. B., C. E. Donald, B. W. Smith, L. G. Tidwell, K. A. Hobbie, L. Kincl, E. N. Haynes, and K. A. Anderson. 2016. Emissions of polycyclic aromatic hydrocarbons from natural gas extraction into air. Environ. Sci. Technol. 50:7921–29. doi:10.1021/acs.est.6b02762.
- Pekney, N., G. Veloski, M. Reeder, J. Tamilia, J. R. Diehl, and R. W. Hammack. 2013. Measurement of air quality impacts during hydraulic fracturing on a Marcellus Shale well pad in Greene County, Pennsylvania. Presented at American Association of Petroleum Geologists (AAPG) Annual Convention and Exhibition, Pittsburgh, PA, May 19-22. 20.
- Pekney, N., M. Reeder, G. Veloski, and J. R. Diehl. 2016. Data report for monitoring at six west virginia Marcellus Shale development sites using NETL’s mobile air monitoring laboratory (July–November 2012). Pittsburgh, PA: US Dept. of Energy (US DOE), National Energy Technology Laboratory (NETL) NETL-TRS-4-2016. 104. June 16.
- Pekney, N. J., G. Veloski, M. Reeder, J. Tamilia, E. Rupp, and A. Wetzel. 2014. Measurement of atmospheric pollutants associated with oil and natural gas exploration and production activity in Pennsylvania’s Allegheny national forest. J. Air Waste Manag. Assoc. 64 (9):1062–72. doi:10.1080/10962247.2014.897270.
- Pennsylvania Dept. of Environmental Protection (PADEP). 2010. Southwestern Pennsylvania Marcellus Shale short-term ambient air sampling report. Harrisburg, PA: Bureau of Air Quality. 52. November 1.
- Pennsylvania Dept. of Environmental Protection (PADEP). 2011a. Northeastern Pennsylvania Marcellus Shale short-term ambient air sampling report. Harrisburg, PA: Bureau of Air Quality. 57. January 12.
- Pennsylvania Dept. of Environmental Protection (PADEP). 2011b. Northcentral Pennsylvania Marcellus Shale short-term ambient air sampling report. Harrisburg, PA: Bureau of Air Quality. 52. May 6.
- Pennsylvania Dept. of Environmental Protection (PADEP). 2016. Proposed Commonwealth of Pennsylvania Department of Environmental Protection 2016 Annual Ambient Air Monitoring Network Plan. 181. June.
- Pennsylvania Dept. of Environmental Protection (PADEP). 2017. Marcellus Shale well count data. Accessed at http://www.depreportingservices.state.pa.us/ReportServer/Pages/ ReportViewer.aspx?/Oil_Gas/OG_Well_Inventory.
- Pennsylvania Dept. of Environmental Protection (PADEP). 2018. Long-term ambient air monitoring project: Marcellus Shale gas facilities. 139. July. Harrisburg, PA: PADEP.
- Soeder, D. J. 2017. Unconventional: Natural gas development from Marcellus Shale, Vol. 527, 143. Boulder, CO: Geological Society of America, Inc.
- South Coast Air Quality Management District (AQMD). n.d. Field evaluation: Speck sensor (Draft). Air Quality Sensor Performance Evaluation Center (AQ-SPEC). 10. Diamond Bar, CA: SCAQMD.
- Stacy, S. L., L. L. Brink, J. C. Larkin, Y. Sadovsky, B. D. Goldstein, B. R. Pitt, and E. O. Talbott. 2015. Perinatal outcomes and unconventional natural gas operations in southwest Pennsylvania. PLoS ONE 10 (6):e0126425. doi:10.1371/journal.pone.0126425.
- Steinzor, N., W. Subra, and L. Sumi. 2013. Investigating links between shale gas development and health impacts through a community survey project in Pennsylvania. New Solutions 23 (1):55–83. doi:10.2190/NS.23.1.e.
- Swarthout, R. F., R. S. Russo, B. C. Sive, Y. Zhou, B. M. Miller, B. L. Mitchell, E. Horsman, E. M. Lipsky, D. C. McCabe, and E. Baum. 2015. Impact of Marcellus Shale natural gas development in southwest Pennsylvania on volatile organic compound emissions and regional air quality. Environ. Sci. Technol. 49 (5):3175–84. doi:10.1021/es504315f.
- TechLaw, Inc. 2012. Trip report, air sampling event, skyview elementary school site, Morgantown, Monongalia County, West Virginia. Wheeling, WV: Report to U.S. EPA Region III. 98. January 30.
- U.S. Energy Information Administration (EIA). 2017. Drilling productivity report (For key tight oil and shale gas regions). 11. June. Accessed on June 28, 2017 at https://www.eia.gov/petroleum/drilling/archive/2017/06/pdf/dpr-full.pdf.
- U.S. EPA. 2004. Air toxics risk assessment reference library, volume 1: Technical resources manual. Office of Air Quality Planning and Standards. EPA-453-K-04-001A, 899. April.
- U.S. EPA. 2009. Schools air toxics monitoring activity (2009): Uses of health effects information in evaluating sample results. 24. September 10. Washington, DC.
- U.S. EPA. 2014a. Evaluation of field-deployed low cost PM sensors. Office of Research and Development, National Exposure Research Laboratory. EPA/600/R-14/464. 76. December.
- U.S. EPA. 2014b. Acute dose-response values for screening risk assessments. Table 2. 8. September 18. Washington, DC.
- U.S. EPA Region III. 2015. EPA region III natural gas ambient air monitoring initiative (NGAAMI) in Southwestern Pennsylvania. Office of Air Monitoring and Analysis, Air Protection Division. 515. August.
- US Census Bureau. 2016a. “Cartographic boundary shapefiles - States.” Accessed at https://www.census.gov/geo/maps-data/data/cbf/cbf_state.html
- US Census Bureau. 2016b. “Cartographic boundary shapefiles - counties.” Accessed at https://www.census.gov/geo/maps-data/data/cbf/cbf_counties.html
- West Virginia Geological and Economic Survey (WVGES) 2017. “Marcellus Shale well count data.” Accessed June 29, 2017. at http://www.wvgs.wvnet.edu/www/datastat/devshales.htm
- Zielinska, B., D. Campbell, and V. Samburova. 2014. Impact of emissions from natural gas production facilities on ambient air quality in the Barnett Shale area: A pilot study. J. Air Waste Manag. Assoc. 64 (12):1369–83. doi:10.1080/10962247.2014.954735.