
ABSTRACT
The use of a two-step thermal-oxidative analysis (TOA) technique for quantification of the mass of total carbon (TC) and elemental carbon (EC) of turbine engine-borne particulate matter (PM) has been evaluated. This approach could be used in lieu of analysis methods which were developed to characterize diluted PM. This effort is of particular interest as turbine engine PM emissions typically have a higher EC content than ambient aerosols, and filter sample mass loadings can be significantly greater than recommended for existing analysis techniques. Analyses were performed under a pure oxygen environment using a two-step temperature profile; reference carbon and actual PM samples were used to identify appropriate analysis conditions. Thermal gravimetric analysis (TGA) methods were used to provide guidance on the nature of the carbon in several of the materials. This was necessary as a standard reference material does not exist for determination of the EC fraction in PM. The TGA also assisted in identifying an appropriate temperature range for the first-stage of the TOA method. Quantification of TC and EC for turbine engine PM samples using TOA was compared to results obtained using the NIOSH 5040 thermal-optical method. For first-stage TOA temperatures of 350°C and 400°C, excellent agreement between the techniques was observed in both the quantified TC and EC, supporting the viability for using TOA for analysis of turbine engine PM samples. A primary benefit of using TOA for these types of PM samples is that filters with relatively high PM mass loadings (sampled at the emission source) can be readily analyzed. In addition, an entire filter sample can be evaluated, as compared to the use of a filter punch sample for the NIOSH technique. While the feasibility of using a TOA method for engine PM samples has been demonstrated, future studies to estimate potential OC charring and oxidation of EC-type material may provide additional data to assess its impact on the OC/EC fractions for other carbon-type measurements.
Implications: This work presents results and procedures of an analytical method for the determination of total and elemental carbon, i.e., TC and EC present in combustion source particulate matter samples. In general, it is shown that the LECO TOA methodology is as reliable and comprehensive as NIOSH 5040 for determining TC and EC carbon types in particulate matter present in turbine emission sources, and should be considered as an alternative. Principles of the methodology, differences, and corresponding agreement with the standard NIOSH 5040 method and TGA analysis are discussed.
Introduction
Particulate Matter (PM) emissions emanating from anthropogenic sources are of major interest for the scientific community as these adversely impact the environment and human health. Environmental impacts include reduced air quality/visibility and black body heat absorption, while health-wise, several studies have attempted to correlate PM emissions with increased mortality rates (Apte et al. Citation2018). The composition and structure of the PM varies significantly based on the combustion method/conditions and the type of fuel used. Policymaking agencies and regulators are interested in identifying the origin and compositional characteristics of PM to provide guidance in reducing overall emissions (Cross et al. Citation2010). The U.S. consumption of oil and gasoline during 2017 was 19.8 million barrels per day with 70% (13.76 million barrels) used for the operation of reciprocating piston and turbine combustion engines for civilian transportation, commerce and national defense (U.S. EIA Citation2017). The emissions from these combustion sources are a complex mixture containing various components such as: aliphatic organic compounds, unburned fuel, lubricating oil, polycyclic aromatic hydrocarbons, graphitic carbon, and sulfuric acid. The combustion conditions (e.g., pressure and air/fuel ratio) and fuel type significantly influence the content and distribution of compounds within the PM exhaust. The characterization of PM from aircraft turbine engines is of particular interest due to its impacts at both ground-level (i.e., health and environmental effects) and high altitudes (i.e., contribution to contrail formation and climate change). Sampling from turbine engines is challenging due to the conditions at the engine exit plane (e.g., high temperatures and velocities), relatively high mass concentrations of PM, and the feasible duration of available sampling time (Petzold et al. Citation2011).
Although the chemical composition of the PM can be complex, the total carbon (TC) content present in PM emissions from combustion sources can be classified in two general types, based on the temperature at which it volatilizes and/or oxidizes. Petzold et al. (Citation2013) provided a comprehensive review of the current and historic nomenclature and working definitions for the various types of carbonaceous material in PM, and their recommended definitions will be used in this work. Elemental carbon (EC) is defined as a thermally stable carbon fraction that can only be gasified by oxidation at elevated temperatures, while organic carbon (OC) is readily oxidizable at much lower temperatures and can be volatilized in an inert atmosphere. In theory, EC is pure carbon; however, in practice, the EC fraction may be comprised of numerous elements (e.g., hydrogen, sulfur, and oxygen), while still retaining the refractory nature of the carbon. The EC contains a subset of carbon referred to as “Black Carbon” (BC), which qualitatively describes carbonaceous material that has strong light-absorbing properties. Both EC and BC carbon possess a high degree of graphitic structures (i.e., sp2-bonded carbon atoms). Differences in EC morphology can be directly linked to the chemical reactivity, especially within the context of PM oxidation. For example, studies by Vander Wal and colleagues have used high-resolution transmission electron microscopy with a lattice fringe image analysis to assess the nanostructure of various PM types, including emissions from aircraft turbine engines (Hays and Vander Wal Citation2007; Vander Wal and Tomasek Citation2003). These studies demonstrate that PM with a higher ratio of basal plane-to-edge site carbon atoms (i.e., a more organized graphene structure) have reduced oxidation rates compared to more amorphous material. Additionally, a study by Pahalagedara et al. (Citation2012) examined the structure–activity relationships for diesel engine PM and commercially available EC samples. Results showed that the oxidation activity was correlated to the degree of organization (i.e., the ratio of amorphous carbon versus graphitic carbon measured by Raman spectroscopy), the average number of graphene layers, the overall particle size, and the surface area. Oxidation activity tended toward higher temperatures with more ordered and compact structure, while the available surface area exhibited a strong inverse relationship with oxidation activity.
Characterization and quantification of the total carbon emissions and corresponding fractions of EC and OC is difficult as the composition of PM is highly variable and there are no known standards for method development and calibration. Analysis methods include the use of thermal, thermal-optical, photoacoustic, and laser-incandescence-based techniques (Baumgardner et al. Citation2012). However, these are typically used to characterize samples for ambient air quality (e.g., low PM mass concentrations), and EC fractions quantified from varying methods have been shown to differ by up to a factor of 7, with a factor of 2 differences being common (Watson, Chow, and Antony Chen Citation2005). A brief overview of several of these techniques is provided below.
Thermal-optical methods have been developed to characterize the OC and EC fractions present in PM samples via thermal evolution in successive inert and oxidizing gas streams. PM samples are collected on quartz filters, either in a raw or conditioned (e.g., diluted and temperature/humidity controlled) gas stream, and a portion of the known area of the quartz filter is punched out for the analysis. The corresponding results are then corrected to the total PM deposit area. During analysis, the sample is first heated to a high temperature under an inert atmosphere (typically helium) to volatilize the OC. The carbon mass of the OC is determined via catalytic oxidation of the evolved species to carbon dioxide followed by reduction to methane and quantification using a Flame Ionization detector (FID). The temperature is then reduced and the gas stream is transitioned to an oxidizing atmosphere. The remaining carbon is oxidized to quantify the EC. During the initial high temperature analysis in inert gas, it is possible for a portion of the OC to undergo pyrolysis (also referred to as charring) rather than volatilization (Baumgardner et al. Citation2012; Birch and Cary Citation1996; Cachier, Brémond, and Buat-Ménard Citation1989; Jiang et al. Citation2011; Khan et al. Citation2012; Subramanian, Khlystov, and Robinson Citation2006; Turpin, Cary, and Huntzicker Citation1990). This results in the potential overestimation of the corresponding EC fraction. The extent of charring is highly dependent on the nature of the PM and can be affected by the temperature profile used during analysis. However, minimization of pyrolytic carbon by thermally desorbing PM samples at lower temperatures under an inert environment can have the opposite effect of underestimating the EC contribution in favor of OC (Pahalagedara et al. Citation2012). Therefore, optical techniques have been developed to assist with determination of an appropriate correction factor to account for in-situ charring. More specifically, either laser transmittance (thermal-optical transmittance [TOT]) or reflectance (thermal-optical reflectance [TOR]) of the PM is monitored during the inert gas phase of the analysis (Chow et al. Citation2001; Khan et al. Citation2012). Charring of OC will affect either of these optical measurements resulting in a change to the initial value. Since it is believed that charred OC will oxidize prior to the onset of EC oxidation, the carbon evolved upon transition to the oxidizing atmosphere is quantified as OC until the baseline transmittance/reflectance is re-attained. This is considered the ‘split-point’; subsequent carbon is quantified as EC.
Two techniques which utilize thermal-optical analysis are the National Institute of Occupational Safety and Health (NIOSH) method 5040 and the Interagency Monitoring of Protected Visual Environments (IMPROVE) method. These methods use different heating profiles during analysis of the OC/EC fractions. The NIOSH method 5040 uses a multistep temperature profile for both phases, with a typical maximum temperature of at least 850°C in inert atmosphere with subsequent cooling to approximately 550°C and transition to 2% oxygen in helium (Birch Citation2016; NIOSH Citation2016). The IMPROVE method heats to a maximum of 550°C in inert atmosphere before transitioning to a 2% oxygen atmosphere. Both methods show good agreement for quantification of TC for a wide range of aerosol types; however, there can be significant differences in the determined OC/EC ratio. For example, the EC fraction determined with the NIOSH method can be characteristically 50% lower than the IMPROVE method (Chow et al. Citation2001). This discrepancy is attributed to the allocation of the carbon evolved at the NIOSH 850ºC temperature in helium atmosphere to the OC rather than EC. An additional factor may be differences in sensitivity of transmittance as compared to reflectance when applying the correction factor. Better agreement in OC and EC values from these methods has been reported for more highly structured and mature PM, such as diesel-borne aerosols (Khan et al. Citation2012). It should be noted that both of these methods are recommended for analysis of ambient or workplace aerosol/PM samples, with a relatively low maximum filter loading (e.g., NIOSH 5040 has an upper mass concentration EC limit of 800 µg/m3 [filter loading of 90 μg/cm2]). Determination of the OC/EC ratio for filters with higher mass loadings is prone to a significant uncertainty. High TC and/or EC loadings can result in negligible initial transmittance/reflectance, making it difficult or impractical to accurately quantify the extent of charring (Khan et al. Citation2012). For the NIOSH 5040 method, an alternative is to manually determine the split-point by performing a second analysis of the PM. For this measurement, a portion of the PM from the original filter is manually transferred to the filter punch that was previously analyzed. The analysis is repeated and the split-point time, determined manually, is then used to correct the OC/EC ratio for the initial analysis. This can introduce further uncertainty for quantification of the absolute amounts of OC and EC; however, the TC mass is not affected. These factors make it difficult to directly apply these techniques to samples with high loadings and more mature/developed PM, such as that produced in turbine engines.
An alternative to estimating the OC/EC ratio via successive heating with inert and oxidizing atmospheres is to perform the entire analysis in an oxidizing atmosphere. In this approach, the split-point determination is based on a two (or multiple) step thermal profile; the carbon evolved at the lower temperature stage is classified as OC. This approach can reduce the complexity associated with the aforementioned thermal-optical analyses by accommodating an entire filter sample, including samples with high carbon loading. Cachier, Brémond, and Buat-Ménard (Citation1989) developed a two-step thermal technique to successfully analyze atmospheric PM samples (e.g., OC fraction >70%) using pure oxygen and a two-stage temperature profile. This method quantified EC on half of a filter via measurement of evolved CO2 at a high-temperature condition after an extended low-temperature exposure (to oxidize the OC). The second half of the PM filter was analyzed directly at the high-temperature condition to quantify the TC; OC was determined via difference. This study identified a first-stage temperature of approximately 340°C with a duration of 120 min to provide good agreement with the estimated and determined EC for ambient aerosol samples (~30% EC). The authors reported that it was anticipated the method would underestimate the EC at higher relative contents, and the method was applied to samples with low carbon loadings on the filter surface (10–80 µg/cm2). Application of this technique to turbine engine exhaust PM emissions (i.e., high TC and EC loadings) has not been demonstrated.
Thermogravimetric Analysis (TGA), which also does not have an optical correction, has been used to investigate the oxidation and volatility characteristics of PM (Fermo et al. Citation2006; Stratakis and Stamatelos Citation2003). During TGA, samples are analyzed for change in mass as a function of temperature, and the analysis can be performed under an inert and/or oxidizing atmosphere. Similar to the aforementioned TOT/TOR techniques, two-phase analysis with initial heating in an inert atmosphere, followed by subsequent heating in an oxidizing atmosphere, can provide information on the sample volatility and corresponding OC fraction. The mass change under the inert environment will be indicative of the OC while loss under the oxidizing environment will be indicative of EC. However, TGA does not account for potential charring, and since this method is based on sample weight loss, it is possible that other elements in the PM (e.g., hydrogen, nitrogen, sulfur, and oxygen) can affect data interpretation. To address these potential deficiencies, Fermo et al. (Citation2006) used Fourier Transform Infrared Spectroscopy to selectively quantify CO2 in the effluent of a two-step temperature TGA profile under only oxidizing conditions to determine TC and estimate the OC/EC ratio. The technique was applied to various standards and atmospheric aerosol PM (e.g., low sample loadings with significant OC fraction). The authors reported that a first-stage temperature of 435°C resulted in minimal charring and pre-combustion of EC. Comparison with TOT analysis showed very good agreement in TC, while OC and EC showed larger discrepancies, further indicating the difficulty associated with this analysis.
The present effort was performed to further investigate the use of multi-step temperature analysis in an oxidizing atmosphere for quantification of TC and EC for PM samples obtained from turbine engine exhaust. Primary characteristics of these samples include a sample surface loading significantly higher than for typical atmospheric PM samples, and higher EC content due to the nature of the combustion process. The analyses were performed using a LECO RC612 Multiphase Carbon/Hydrogen/Moisture Determinator, which permitted analysis of the entire PM sample with no required pre-analysis sample preparation. Various types of reference carbon and engine exhaust samples were utilized to identify test parameters to estimate an appropriate temperature for the OC/EC split-point measurement. TGA analysis was performed to provide further guidance on the nature of the carbon in several of the materials, which was necessary as a standard material does not exist for this determination. Analysis of selected samples was performed with the NIOSH 5040 method (even though the sample loadings were greater than recommended by the method) to provide a basis of comparison for the TC and EC determined with the different techniques.
Experimental
PM and carbon reference materials were analyzed for TC and EC content using TGA, the NIOSH 5040 method, and thermal-oxidative analysis (TOA) with a LECO RC612 Multiphase Carbon Analyzer. PM samples analyzed using the NIOSH 5040 method were conducted at either Sunset Labs, the U.S. Environmental Protection Agency, or Oak Ridge National Laboratory, while the TGA and TOA analyses were performed at the University of Dayton and Wright-Patterson Air Force Base, respectively.
Sample collection
PM samples were collected on pre-conditioned quartz fiber filters using an in-house fabricated sampling apparatus, which has previously been used to collect PM samples for determination of engine smoke number per SAE Aerospace Recommended Practice (ARP) 1179D (SAE Citation2011). Undiluted exhaust gas from an aircraft turbine engine was extracted at the engine exit plan using a heated extraction probe, and transferred via a heated line maintained at 150°C. The elevated temperature helps prevent condensation of volatile compounds and water vapor within the transfer line and on the PM particles. A constant sample flow rate of 14.2 standard liters per minute (consistent with ARP 1179D) was used for all sample collection. The total sample volume and collection time (typically 2 min) was recorded, as well as the inlet and outlet temperatures of the sample stream. It should be noted that the turbine engine emissions sample collection rate exceeds the maximum recommended in the NIOSH 5040 method; however, this is to be expected as the NIOSH 5040 method was established for workplace sampling, rather than raw, undiluted exhaust plane emissions. High flow rates without dilution are beneficial when sampling PM from turbine engines to insure sufficient mass of sample is acquired for analysis while reducing the sample acquisition time, which reduces the cost of engine operation (including fuel consumption). The filter spot size during sampling was 2.54 cm (1 inch); each filter was stored in a clean petri dish under ambient laboratory conditions prior to and after PM sample collection.
Quartz filter conditioning
The quartz glass filter media used for collecting PM samples were thermally conditioned to remove residual carbon present on the sample media. The filters were cut from large (20.3 x 25.4 cm) quartz filter sheets (Whatman no. 1851–865, QM-A) using a custom machined punch (38 mm diameter). Each filter was placed in a quartz watch glass and heated in a Thermo Scientific Thermolyne muffle furnace for 2 h at 750°C. After cooling, the filters were stored in Falcon 50 × 9 mm sterile plastic petri dishes until PM sampling; filters were handled with clean stainless steel forceps. During emissions sampling, a blank filter was withheld before and after sample collection for background correction.
Samples and reference materials
Turbine engine PM
PM samples were collected from the undiluted exhaust gas of a T63 turboshaft engine. This engine has been used to previously study the impact of fuel composition and operating condition on gaseous and PM emission propensity (Corporan et al. Citation2011; DeWitt et al. Citation2008). The engine was operated at two power settings (i.e., idle and cruise), and collected PM samples were analyzed for carbon content using the techniques described herein. Fuels with varying aromatic content were combusted to produce PM at varying mass concentrations and relative carbon type, as PM emissions are strongly influenced by fuel aromatic type and content (Speth et al. Citation2015). The impact of aromatic content on PM production propensity on a T63 engine has previously been reported on by DeWitt et al. (Citation2008) and will not be addressed in this work.
Diesel particulate matter NIST standard reference material 1650b
NIST standard reference material (SRM) 1650b was used to assist with investigation of the relative evaluation of the PM across instruments. SRM 1650b was also used to assist with identifying appropriate method parameters during investigation of the TOA analysis. This material is comprised of diesel-borne PM, with varying concentrations of multi-ring polycyclic aromatic hydrocarbons (PAH), nitro-substituted PAH, and higher molecular weight PM (e.g., OC and EC components).
Graphite powder
A synthetic graphite crystalline powder (200 mesh, 99.9995% pure) from Alfa Aesar was used as received. Graphite provided a predominantly pure EC source.
Paraffin wax
A high molecular weight paraffin wax (BARECO PX-105, Baker Petrolite) was used as received. The wax provided a predominantly pure OC source.
PM analysis techniques
Thermal gravimetric analysis (TGA)
TGA was performed using two different methodologies with a Mettler Toledo TGA/DSC (Differential Scanning Calorimetry). In the first method, the initial mass loss was determined by heating the sample from 30°C to 550°C at 20°C/min under a nitrogen atmosphere. Without opening the TGA furnace, the sample was cooled to 30°C, purged with air for 5 min to sweep nitrogen from the sample cell, and then heated from 30°C to 800°C at 20°C/min quantify the remaining mass loss. The mass fraction of OC and EC were estimated using the quantified total mass loss during each step of the analysis. A second approach used a temperature profile from 30°C to 1000°C with a heating rate of 20°C per minute under an air atmosphere. This latter approach was used to provide guidance for application of the two-phase analysis to the subsequent thermal-oxidative analysis (discussed below).
NIOSH method 5040
The NIOSH 5040 method was performed per the standard recommended procedure (Birch Citation2016; NIOSH Citation2016). The inert stage of analysis used He with a maximum temperature of 870°C, followed by a reduction in temperature to 550°C and transition to 2% O2/98% He atmosphere. The correction factor for charring and determination of the OC/EC fractions was performed using the automated analysis methodology unless otherwise noted.
Thermal-oxidative analysis (TOA) via multiphase LECO carbon determinator
A LECO Corporation model RC612 Multiphase Carbon/Hydrogen/Moisture Determinator was used to oxidize and quantify the TC and EC fractions present in reference and engine PM samples. Samples were introduced manually into a temperature programmable furnace with a 100% oxygen atmosphere. The RC612 furnace control system allows the temperature of the dual-stage furnace to be programmed from near ambient to 1100°C. Depending on the application, multiple temperature steps can be programmed and the furnace purged with oxygen creating conditions in which the carbon is oxidized. Carbon evolved during analysis is quantified using an infrared (IR) detector with wavelength selective to CO2. An afterburner furnace (nominally set to 850°C) and oxidation catalyst are included in the flow path upstream of the detectors to insure complete oxidation of all evolved components. The IR detector is calibrated per the instrument manufacturer’s recommended procedure using NIST traceable standards of known carbon content. The calibration procedure determines a correlation between the TC mass and detector total area response. Repeatability in quantified carbon mass is estimated via known mass of control standards, and is typically better than ±3% absolute.
During analysis, the entire filter sample was placed in a reusable sample pan. The pans were preconditioned at 1000°C for 80 s under a 100% oxygen atmosphere to remove residual carbon prior to filter analysis. The pans were then placed on a clean quartz glass sheet for cooling to await use for zeroing, calibration, and sample analysis. Three conditioned pans were analyzed to provide a background level for the instrument. Three thermally conditioned blank quartz filters were analyzed using the desired thermal profile. This analysis provided a filter background correction factor (typically ~5–7 µg) to be applied to the analysis.
Results and discussion
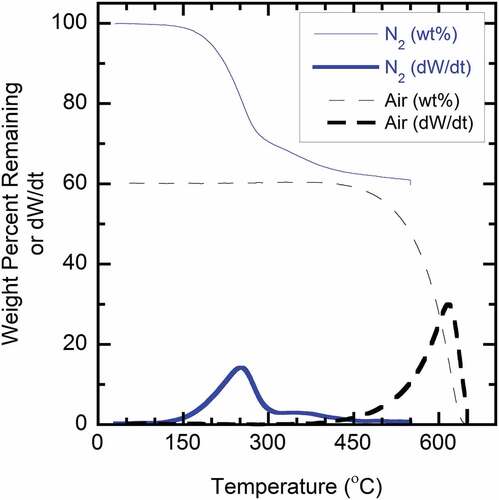
Development of a TOA method for quantifying carbon type in turbine engine PM exhaust can be assisted with TGA method analysis of reference and actual PM samples. More specifically, TGA can provide insight into the relative OC/EC ratio of the samples and an appropriate split-point temperature. shows TGA results using a two-phase analysis methodology for a PM sample obtained during operation of the T63 engine at engine cruise condition. The sample is initially heated under a nitrogen atmosphere with a temperature profile from 30°C to 550°C at 20°C/min, followed by cooling to 30°C and heating under an air atmosphere to 750°C. The thin curves in show the weight percent remaining during the two separate phases of analysis, while the bold curves show the first derivative of weight (e.g., mass change rate) versus temperature. The analysis indicates there are essentially two primary types of carbon in the PM (i.e., OC and EC). It is reasonable to assert that weight loss during the inert phase is indicative of OC, while the subsequent mass loss under air is attributable to EC (e.g., ~60%). Under the initial inert atmosphere, weight loss begins at a temperature of approximately 150°C and is near completion at 400–450°C. This range of temperature is similar to that reported for thermal-optical methods. After transitioning to an air environment, weight loss does not begin until a temperature of approximately 450°C with completion near 650°C. This temperature range is similar to that reported for a previous TGA study of the oxidation characteristics of diesel PM and carbon black samples in air (Sharma et al. Citation2012). Overall, this behavior indicates that the inert stage either efficiently removed volatile OC-type material or promoted minor charring of the sample. In addition to providing guidance regarding the OC/EC ratio of the engine-borne PM and a range of approximate split-point temperatures, there was negligible residual inorganic/ash material at the completion of analysis, indicating the turbine engine PM was predominantly carbon-based material. This analysis provided a basis for subsequent TOA method development.
Figure 1. TGA analysis of PM sample from T63 engine operated at cruise condition. Solid lines are under nitrogen environment; dashed lines under air environment.
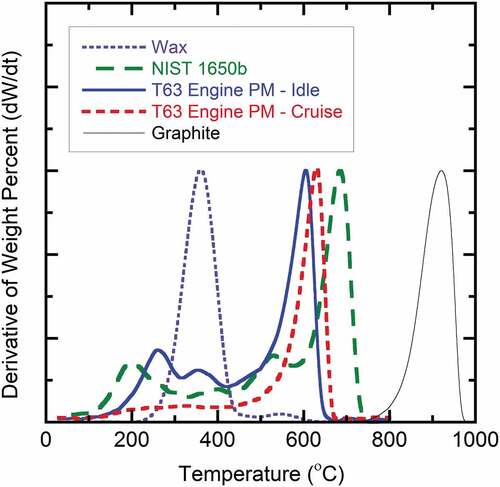
In order to obtain additional guidance to determine an appropriate first-stage TOA temperature for estimation of OC and EC, the TGA method was also performed under an air atmosphere with a single temperature ramp from 30°C to 1000°C at 20°C per minute. The analysis was performed with both reference materials and engine-borne PM. Results for several analyses are shown in . Paraffinic wax (M.W. >400) was almost completely evolved (e.g., volatilized and/or oxidized) by about 425°C; whereas, the pure graphite was resistant to oxidation and did not begin to oxidize until a temperature of approximately 770°C. There was a slight weight loss above 500°C for the paraffin wax, which could indicate a minor amount of charring during analysis. The NIST standard reference material 1605b (composite diesel standard) and the T63 PM sample obtained at the low power condition (Idle) had a much broader oxidation profile, with low (≤200°C), mid-level (200°C to 450°C), and high temperature (>450°C) oxidation phases. The weight loss at high temperature is most likely EC-type material, while the low and intermediate ranges are most likely related to OC-type compounds. On the contrary, the engine PM obtained at the higher power condition (Cruise) had a significant increase in rate of weight loss above approximately 450°C. This is reasonable as the PM produced at cruise is expected to be more highly structured with characteristics consistent with EC. The broad temperature range observed during analysis of actual PM samples is indicative of wide compositional range within the samples. Overall, these results provide insight regarding the compositional characteristics of the various samples and indicate that an approximate split-point temperature within a range of 300–450°C would be reasonable for a two-step TOA using the LECO analyzer. This temperature range is also consistent with that for the aforementioned TOA (Cachier, Brémond, and Buat-Ménard Citation1989) and TGA (Fermo et al. Citation2006) analysis methods used for ambient aerosol PM.
Figure 2. TGA profiles of turbine engine-borne PM samples and reference materials in an air environment; temperature profile of 30 − 1000°C at 20°C/min.
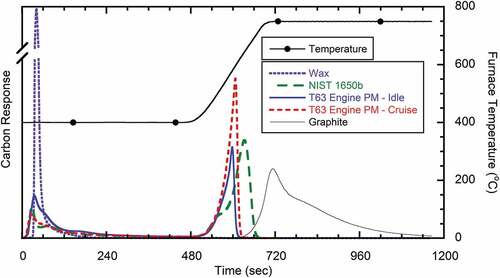
The feasibility for utilizing a two-step temperature oxidation profile for TC and EC analysis was evaluated using the reference materials and engine-borne PM. Primary metrics of interest included the impact of the initial temperature on the approximate EC fraction and comparison to that estimated from TGA analysis. PM sample analyses were performed with the LECO analyzer in a 100% oxygen atmosphere utilizing the two-step temperature program. The initial temperature was varied between 250°C and 450°C with a hold time of 7.5 minutes. The furnace temperature was then rapidly increased (105°C/min) to 750°C and held constant until complete carbon evolution. Results from testing with a first-stage temperature of 400°C are shown in ; results for the other temperature profiles are included in the supplementary material. As shown in , the paraffinic wax completely volatilizes/oxidizes after approximately 150 s of analysis at 400°C, with negligible signal following the temperature increase. Compared to the aforementioned TGA analysis, minimal charring was observed for the wax, indicating the high initial temperature and pure oxygen environment most likely reduce the potential for charring as compared to the slow temperature ramp, lower oxygen atmosphere analysis. The graphite sample did not begin to oxidize until approximately 550°C, indicating that the oxidation rate of highly structured EC is sufficiently slow such that an initial hold time of 7.5 min at 400°C would not result in an artificial loss. The NIST standard reference material 1605b and the T63 PM samples all showed similar carbon evolution profiles, with an initial rapid loss at the first-stage temperature, followed by a low rate of mass evolution until transition to the second stage temperature.
Figure 3. TOA profiles of PM samples from T63 engine and reference materials in a 100% oxygen environment; first-stage hold temperature of 400°C with temperature ramp of 105°C/min to 750°C.
The impact of the first-stage temperature of the TOA analysis on the measured EC fraction, and guidance regarding an appropriate initial temperature for quantification, can be determined via comparison to the EC estimation from two-phase TGA analysis. The TGA analysis was performed by first heating in inert gas (nitrogen), followed by transition to an air environment (e.g., ). TGA mass loss under the inert atmosphere was designated as OC, while the remaining mass loss under oxidative conditions was designated as EC. As previously discussed, the mass loss under each phase can be due to volatilization/oxidation of non-carbon species, but the relative mass losses should be representative of the overall carbon content. Charring of OC is possible during both of these analyses; however, pyrolysis of OC is expected to be negligible or low for turbine engine PM (similar to diesel PM [Khan et al. Citation2012]). shows the calculated EC fraction of turbine engine PM samples as a function of the first-stage TOA temperature, and estimated from two-phase TGA. The approximate EC fraction from TGA provides a basis of comparison for the impact of the first-stage TOA temperature. As shown, the estimated EC fraction for TOA is inversely proportional to the first-stage temperature, and differs by almost a factor of two over the temperature range of 250°C to 450°C. This behavior is qualitatively similar to that reported by Fermo et al. (Citation2006) using oxidative TGA, where either OC charring or pre-oxidation of EC can occur if the initial temperature is too high, while insufficient oxidation of OC can occur at low initial temperatures. The impact of these factors may be intensified for highly loaded PM samples. We have found the EC fraction to be significantly over-estimated using the proposed TOA analysis when the first-stage temperature is only 250°C due to an insufficient oxidation rate of the OC-type material. This is evident upon review of the TOA profiles for the paraffinic wax and PM samples (see Figure S1). A significantly longer hold time would be required at this first-stage temperature to allow sufficient oxidation of the OC material. Improved efficiency in the oxidation of OC-type material, and a more accurate estimation of the EC, is realized with an increasing first-stage temperature (see Figures S2 and S3). Overall, these analyses indicate an optimum first-stage TOA temperature between 300°C and 400°C would be adequate for determination of OC/EC fractions of related PM samples. This range is slightly lower than for a single-phase TGA method, which could be due to the use of pure oxygen rather than air during analysis.
Table 1. EC fraction at varying first-stage TOA temperature and estimated from TGA.
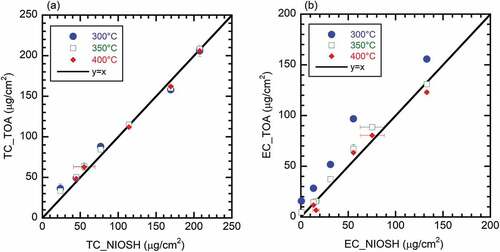
Development of a two-stage TOA methodology for quantifying EC and TC of PM from turbine engines would benefit from the comparison to results from an accepted thermal-optical method. The NIOSH 5040 method was used for comparison in this effort. It should be reiterated that direct source sampling, i.e., from the exhaust exit plane of the engine, even for very short durations of time, can produce PM sample loadings significantly higher than those recommended for use in the NIOSH 5040 method. Analysis was performed on turbine engine PM obtained during operation of a T63 engine at idle and cruise conditions, while operating on three fuels with varying aromatic content of near zero, 12.5% and 25.5% by volume. These conditions and fuels were used to produce PM at varying concentrations and carbon type as described in previous efforts (DeWitt et al. Citation2008; Speth et al. Citation2015). The focus of this current effort was to compare TC and EC results from each method for a wide range of PM concentrations rather than to identify engine power or fuel-specific correlations. Based on the comparison to TGA analyses, TOA was performed using three different first-stage temperatures: 300°C, 350°C, and 400°C. For TOA, average TC and EC values were determined based on analysis of 1–4 filter samples (typically 2–4 samples, see supplemental information for complete listing) from each engine/fuel condition for each respective first-stage temperature condition. For the NIOSH analysis, two sample filters for each condition underwent replicate analysis (i.e., two filter punches for each filter) and the results were averaged.
Parity plots comparing the TC and EC quantified with the NIOSH method and TOA with varying first-stage temperatures, are shown in and , respectively. The results are reported in carbon mass per sample area. The NIOSH 5040 analyzed sample area was based on the punch size, while the TOA results were normalized to the total sample spot size. Error bars represent an uncertainty of one standard deviation for the replicate analyses; the uncertainty was within the symbol size for several of the samples indicating good repeatability for both analysis methodologies. There was excellent agreement in the quantified TC for both methods independent of the first-stage TOA temperature, with the root-mean-squared error (RMSE) ranging from about 5 to 9 µg/cm2. This result is consistent with similar agreement for NIOSH with both IMPROVE (Chow et al. Citation2001) and TGA (Fermo et al. Citation2006) analyses, and demonstrates the detection methods used for both techniques have a wide range of linearity, even for heavily loaded sample filters. The EC estimated with each method () showed good agreement with first-stage temperatures of 350°C and 400°C (RMSE of 7.3 and 7.6 µg/cm2, respectively), but was significantly biased to the TOA analysis with a first-stage temperature of 300°C, which gave a mean bias error (MBE) of +23 µg/cm2. The bias at the lowest temperature was most likely related to incomplete oxidation of OC-type material under this condition. It should be noted that the NIOSH EC content for the highest loaded filter (i.e., 133 µg/cm2) was determined via a manual split-point technique as there was insufficient initial transmittance to perform the standard automated measurement. This was due to the high mass loading on the filter under this condition. This is one of the shortcomings of the NIOSH 5040 technique when applied to heavily loaded engine samples.
Figure 4. Parity plots of (a) total carbon, and (b) elemental carbon from turbine engine-borne PM samples (at various engine conditions and fuel types) with respect to initial temperature of TOA analysis; data points are averaged values, error bars represent one standard deviation.
Overall, these results demonstrate that the two-step TOA method with a first-stage temperature of 350–400°C can provide excellent agreement and be a viable alternative to the NIOSH 5040 method for quantification of TC and EC (OC via difference) of engine-borne PM. Additional studies can be performed to investigate if and to what extent charring or pre-oxidation of EC occurs for these type of PM samples.
Conclusion
The use of a two-step thermal-oxidative analysis (TOA) technique for quantification of TC and EC of turbine engine-borne PM has been evaluated. This technique can be used as an alternative to analysis methods, such as the thermal-optical NIOSH 5040, which were primarily developed to quantify workplace aerosol PM from dilute sources. Turbine engine PM typically has a higher EC content than most ambient PM, and filter sample mass loadings can be significantly higher than recommended for existing analysis techniques. Analyses were performed under a pure oxygen environment using a two-step temperature profile; reference carbon and actual PM samples were used to identify appropriate test conditions for the analysis. Thermal gravimetric analysis (TGA) methods were used to provide guidance on the nature of the carbon in several of the materials. This was necessary as a standard reference material does not exist for determination of the EC fraction in PM. In addition, TGA was used to identify an appropriate temperature range for the first-stage of the TOA method. Quantification of TC and EC for turbine engine PM samples using TOA was compared to results obtained using the NIOSH 5040 method. For first-stage TOA temperatures of 350°C and 400°C, excellent agreement was observed in both the quantified TC and EC, which is in agreement with prior research and supports the viability for using TOA. A primary benefit of using TOA for these types of PM samples is that filters with relatively high PM mass loadings (sampled at the emission source) can be readily analyzed. In addition, an entire filter sample can be evaluated, as compared to use of a filter punch sample for the NIOSH technique, which introduces experimental error as it both disrupts the sample and requires the assumption of homogeneous PM coating of the filter. While the feasibility of using a TOA method for engine PM samples has been demonstrated, future studies to estimate potential OC charring and oxidation of EC-type material may provide additional data to assess its impact on the OC/EC fractions for more accurate carbon-type measurements.
Supplemental Material
Download PDF (381.7 KB)Acknowledgment
The authors thank Drew Allen and Joe Mantz of the University of Dayton Research Institute (UDRI) for contributions during PM sampling, and Dr. M.D. Cheng of Oak Ridge National Laboratory (ORNL) and John Kinsey of the U.S. Environmental Protection Agency (EPA) for initial NIOSH 5040 analyses. Joshua Dixon of Sunset Laboratory, Inc. is also thanked for performing NIOSH 5040 analyses and for useful discussion regarding the analysis technique and methodology for determining OC/EC split-point ratios. The authors thank the manuscript reviewers for their thorough and helpful feedback. This work was completed under Air Force Research Laboratory (AFRL) contract numbers FA8650-10-2-2934 and FA8650-16-2-2605.
Supplementary material
Supplementary data can be accessed publisher’s website.
Additional information
Funding
Related Research Data
References
- Apte, J. S., M. Brauer, A. J. Cohen, M. Ezzati, and C. A. Pope III. 2018. Ambient PM2.5 reduces global and regional life expectancy. Environ. Sci. Technol. Lett. 5:546–51. doi:10.1021/acs.estlett.8b00360.
- ARP 1179D. 2011. Aircraft gas turbine exhaust smoke measurement. Warrendale PA, USA: SAE aerospace recommended practice.
- Baumgardner, D., O. Popovicheva, J. Allan, V. Bernardoni, J. Cao, F. Cavalli, J. Cozic, E. Diapouli, K. Eleftheriadis, P. J. Genberg, et al. 2012. Soot reference materials for instrument calibration and intercomparisons: A workshop summary with recommendations. Atmos. Meas. Tech. 5:1869–87.
- Birch, M. E. 2016. Monitoring diesel exhaust in the workplace. NIOSH manual of analytical methods (NMAM), 5th edition, Chapter DL. Atlanta, GA. USA: Centers for Disease Control and Prevention.
- Birch, M. E., and R. A. Cary. 1996. Elemental carbon-based method for monitoring occupational exposures to particulate diesel exhaust. Aerosol. Sci. Technol. 25:221–41. doi:10.1080/02786829608965393.
- Cachier, H., M. P. Brémond, and P. Buat-Ménard. 1989. Thermal separation of soot carbon. Aerosol. Sci. Technol. 10 (2):358–64. doi:10.1080/02786828908959273.
- Chow, J., J. Watson, D. Crow, D. Lowenthal, and T. Merrifield. 2001. Comparison of IMPROVE and NIOSH carbon measurements. Aerosol. Sci. Technol. 34 (1):23–34. doi:10.1080/02786820119073.
- Corporan, E., T. Edwards, L. Shafer, M. J. DeWitt, C. Klingshirn, S. Zabarnick, Z. West, R. Striebich, J. Graham, and J. Klein. 2011. Chemical, thermal stability, seal swell, and emissions studies of alternative jet fuels. Energy Fuels 25:955–66. doi:10.1021/ef101520v.
- Cross, E. S., T. B. Onasch, A. Ahern, W. Wrobel, J. G. Slowik, J. Olfert, D. A. Lack, P. Massoli, C. D. Cappa, J. P. Schwarz, et al. 2010. Soot particles studies-instrument-inter-comparison-project overview. Aerosol. Sci. Technol. 44:592–611. doi:10.1080/02786826.2010.482113.
- DeWitt, M. J., E. Corporan, J. Graham, and D. Minus. 2008. Effects of aromatic type and concentration in Fischer-Tropsch fuel on emissions production and material compatibility. Energy Fuels 22:2411–18. doi:10.1021/ef8001179.
- Fermo, P., A. Piazzalunga, R. Vecchi, G. Valli, and M. Ceriani. 2006. A TGA/FT-IR study for measuring OC and EC in aerosol samples. Atmos. Chem. Phys. 6:255–66. doi:10.5194/acp-6-255-2006.
- Hays, M. D., and R. L. Vander Wal. 2007. Heterogeneous soot nanostructure in atmospheric and combustion source aerosols. Energy Fuels 21 (2):801–11. doi:10.1021/ef060442h.
- Jiang, M., Y. Wu, G. Lin, L. Xu, Z. Chen, and F. Fu. 2011. Pyrolysis and thermal-oxidation characterization of organic carbon and black carbon aerosols. Sci. Total Environ. 409:4449–55. doi:10.1016/j.scitotenv.2011.07.016.
- Khan, B., M. D. Hays, C. Geron, and J. Jetter. 2012. Differences in the OC/EC ratios that characterize ambient and source aerosols due to thermal-optical analysis. Aerosol. Sci. Technol. 46:127–37. doi:10.1080/02786826.2011.609194.
- National Institute for Occupational Safety and Health (NIOSH). 2016. Diesel particulate matter (as elemental carbon) NIOSH 5040: Issue 4 NIOSH manual of analytical methods (NMAM), 5th edition. Atlanta, GA. USA: Centers for Disease Control and Prevention.
- Pahalagedara, L., H. N. Sharma, C. H. Kuo, S. Dharmarathna, A. Joshi, S. L. Suib, and A. B. Mhadeshwar. 2012. Structure and oxidation activity correlations for carbon blacks and diesel soot. Energy Fuels 26:6757–64. doi:10.1021/ef301331b.
- Petzold, A., R. Marsh, M. Johnson, M. Miller, Y. Sevcenco, D. Delhaye, A. Ibrahim, P. Williams, H. Bauer, A. Crayford, et al. 2011. Evaluation of methods for measuring particulate matter emissions from gas turbines. Environ. Sci. Technol. 45:3562–68. doi:10.1021/es103969v.
- Petzold, A., J. A. Ogren, M. Fiebig, P. Laj, S. M. Li, U. Baltensperger, T. Holzer-Popp, S. Kinne, G. Pappalardo, N. Sugimoto, et al. 2013. Recommendations for reporting black carbon measurements. Atmos. Chem. Phys. 13:8365–79. doi:10.5194/acp-13-8365-2013.
- Sharma, H. N., L. Pahalagedara, A. Joshi, S. L. Suib, and A. B. Mhadeshwar. 2012. Experimental study of carbon black and diesel engine soot oxidation kinetics using thermogravimetric analysis. Energy Fuels 26:5613–25. doi:10.1021/ef3009025.
- Speth, R. L., C. Rojo, R. Malina, and S. R. H. Barrett. 2015. Black carbon emissions reductions from combustion of alternative jet fuels. Atmos. Environ. 105:37–42. doi:10.1016/j.atmosenv.2015.01.040.
- Stratakis, G. A., and A. M. Stamatelos. 2003. Thermogravimetric analysis of soot by a modern diesel engine run on catalyst-doped fuel. Combust. Flame. 132:157–69. doi:10.1016/S0010-2180(02)00432-7.
- Subramanian, R., A. Y. Khlystov, and A. L. Robinson. 2006. Effect of peak inert-mode temperature on elemental carbon measured using thermal optical analysis. Aerosol Sci. Technol. 40:763–80. doi:10.1080/02786820600714403.
- Turpin, B., R. Cary, and J. Huntzicker. 1990. An in-situ time resolved analyzer for aerosol organic and elemental carbon. Aerosol. Sci. Technol. 12:161–71. doi:10.1080/02786829008959336.
- U.S. Energy Information Administration (EIA). 2017. Monthly energy review. DOE/EIA-0035 (2017/9). Office of Energy Statistics, U.S. Department of Energy Washington.
- Vander Wal, R. L., and A. J. Tomasek. 2003. Soot oxidation: Dependence on initial nanostructure. Combust. Flame. 134 (1–2):1–9. doi:10.1016/S0010-2180(03)00084-1.
- Watson, J. G., J. C. Chow, and L.-W. Antony Chen. 2005. Summary of organic and elemental carbon/black carbon analysis methods and intercomparisons. Aerosol Air Qual. Res. 5 (1):65–102.