
 ?Mathematical formulae have been encoded as MathML and are displayed in this HTML version using MathJax in order to improve their display. Uncheck the box to turn MathJax off. This feature requires Javascript. Click on a formula to zoom.
ABSTRACT
Although biochar addition into the anaerobic digestion of food waste (FW) is an efficient means to enhance methane production, the effects of biochar on various FW components remain unclear. Laboratory batch experiments were conducted to investigate the impact of sewage sludge-derived biochar (SSB) supplementation on the anaerobic digestion (AD) of major FW components, including carbohydrate-rich, protein-rich, and lipid-rich substrates. The lag phase of AD with the carbohydrate-rich substrate was 48.6% shorter when SSB was added, and the cumulative methane yield was 4.74 times higher compared to AD without biochar. SSB supplementation also increased the rate of methane production from the lipid-rich substrate. However, the effect of SSB addition on AD of the protein-rich substrate was minor. Analysis of the microbial communities revealed that methanogen growth was enhanced during AD of the carbohydrate-rich and lipid-rich substrates, but not the protein-rich substrate, following SSB supplementation. Also, the most dominant methanogenic genus varied with the substrates. SSB addition promoted the growth of hydrolytic and fermentative bacteria, particularly phylum Bacteroidetes.
Implications: Biochar supplementation has been studied to overcome the shortcomings of anaerobic digestion (AD). However, the effects of biochar on different substrates remain unclear. This study compared carbohydrate-rich, protein-rich, and lipid-rich substrates in anaerobic digestion with sewage sludge-derived biochar (SSB). SSB supplementation improved methane generation from all but the protein-rich substrate. The study results imply that the effect of SSB addition on AD varied with the substrate due to the substrates underwent different degradation processes with different microbial communities.
Introduction
Anaerobic digestion (AD) is considered energetically efficient and promising means by which to manage food waste (FW) (Zhang et al. Citation2014). AD converts organic substrates into biogas comprised of methane (60-70%) and carbon dioxide (30-40%), and the nutrient-rich digestate can be used as fertilizer (Sheets et al. Citation2015). Despite these benefits, AD systems often show long lag phases, low CH4 production rates, and process instability (Chen, Cheng, and Creamer Citation2008; Ye et al. Citation2018). Various conductive materials have been introduced to accelerate methane production and shorten the AD lag phase. Conductive materials include ferriferous oxide (Fe3O4) (Zhang and Lu Citation2016), polyaniline nanorods (Hu et al. Citation2017), and carbon-based materials (activated carbon and biochar) (Cuetos et al. Citation2017; Ko et al. Citation2018b; Yang et al. Citation2017).
Biochar (BC) is a product of biomass pyrolysis. Compared to other conductive materials, BC is cost-effective and environmentally friendly (Masebinu et al. Citation2019). The addition of BC into the AD process can increase alkalinity and pH, which reduces ammonia inhibition and acid stress (Lü et al. Citation2016). With its porous structure and large specific surface area, BC can promote the colonization of bacteria and archaea (Luo et al. Citation2015; Martínez et al. Citation2018; Qin et al. Citation2017). Conductive materials have been shown to facilitate direct interspecies electron transfer (DIET) in co-cultures of Geobacter metallireducens and Geobacter sulfurreducens (Rotaru et al. Citation2014). Wang et al. (Citation2018) also found that BC enhanced the selective enrichment of potential DIET partners, such as Methanothrix and Geobacter spp.
The composition of FW varies with dietary habits, food availability, season, and consumption patterns (Kobayashi et al. Citation2012). The characteristics of the substrates influence AD; therefore, the variations in the composition of FW may affect AD performance. The main components of FW are carbohydrates, proteins, and lipids (Alibardi and Cossu Citation2016). Carbohydrate-rich substrates may have undesirable C/N ratios due to nutrient limitations, and rapid acidification can result from volatile fatty acids (VFAs) accumulation (Paritosh et al. Citation2017; Xu et al. Citation2014). Theoretical biochemical methane potentials (BO-ThOFC) can be presented using proportions of carbohydrates, proteins, and lipid, as shown in Equation (1), which shows Lipid content could have high methane potential (Lesteur et al. Citation2010; Raposo et al. Citation2011). However, the long-chain fatty acids (LCFAs) released during lipid degradation can inhibit the AD process (Sun et al. Citation2014; Wan et al. Citation2011; Yuan and Zhu Citation2016).
Where, %X (X = carbohydrates, proteins, or lipid) indicates each component fraction. The coefficients in this equation are estimated by assuming the stoichiometric conversion of model compounds with average formulae for carbohydrates (C6H10O5), proteins (C5H7O2N), and lipids (C57H104O6) (Raposo et al. Citation2011). Besides, the impacts of BC on AD of each FW component is not well understood.
In this study, the effects of BC supplementation on the AD of carbohydrate-rich rice, protein-rich egg white, and lipid-rich lard substrates were investigated. Biogas production and the pH and VFA contents of the liquid media were monitored in each stage of AD. The microbial communities were also analyzed to better understand the effect of BC addition on AD of the individual substrates.
Materials and methods
Preparation and characteristics of sewage sludge-derived biochar (SSB)
Sewage sludge was collected from a wastewater treatment plant (WWTP) located in Shenzhen, China, and used to produce sludge-derived biochar (SSB). The collected sewage sludge was first dried in an oven at 105°C for 24 h. The dried raw sewage sludge was then placed in a corundum crucible for pyrolysis in a horizontal furnace (Sanli Inc., China). Before heating, the furnace was purged for 15 min with nitrogen gas (99.99%) at a flow rate of 400 mL min−1 to establish an oxygen-free environment. The furnace was then heated at a rate of 10°C min−1 to 500°C and held at this temperature for 30 min (Ko, Wang, and Xu Citation2018a). After completing the pyrolysis of sludge, the biochar was cooled down to room temperature. The biochar was ground and sieved to isolate biochar particles between 0.075 mm and 0.150 mm in size. The obtained SSB was dried at 105°C for 24 h and stored in a dryer.
The physicochemical properties of the raw sludge (RS) were determined via proximate analysis according to standard method GB/T 17664–1999 (China State Bureau of Quality and Technical Supervision Citation1999). Analysis of the inorganic ash content was performed with an EDX-LE energy dispersive X-ray spectrometer (Shimadzu, Japan). The pH of SSB was measured with a FiveEasy Plus pH meter (Mettler Toledo, USA) using the liquid fraction of a 1:10 (w/v, g cm−3) SSB-water mixture. The electrical conductivity (EC) of the biochar was measured in a 1:5 (w/v, g cm−3) SSB-water mixture using a FiveEasy Plus EC meter (Mettler Toledo, USA) (Li, Liang, and Shangguan Citation2017). The Brunauer-Emmett-Teller (BET) surface area of the SSB was determined with an ASAP 2020 surface area analyzer (Micromeritics, USA). The physicochemical properties of the raw sludge (RS) and SSB are summarized in .
Table 1. Physicochemical properties of the raw sludge (RS) and sewage sludge derived biochar (SSB).
Inoculum, substrates, and AD operation
The inoculum was collected from the secondary sedimentation tank of the same WWTP. The collected inoculum was stored at 35°C in an incubator. Cooked rice, cooked egg white, and cooked lard were selected to represent a carbohydrate-rich, protein-rich, and lipid-rich substrate, respectively. Each substrate was thoroughly homogenized before use. The properties of the substrates are shown in .
Table 2. The characteristics of the inoculum, substrates in the batch experiment.
A serum bottle (250 mL) with the 150 mL working volume was used as an anaerobic digester. The inoculum to substrate ratio was 1.5:1 (g VS−1:g VS−1). The total volatile solids(VS) of each digester (VS) was 6 g/L. The anaerobic digesters for the carbohydrate-rich, protein-rich, and lipid-rich substrates were denoted by C-, P-, and L-, respectively. The anaerobic digesters for each substrate were divided into two groups, one with SSB (C-SSB, P-SSB, L-SSB), and the other without SSB (C-control, P-control, L-control). A blank digester containing only the inoculum was also prepared. All experiments were run in triplicate. The anaerobic digesters with SSB were prepared by adding SSB with a concentration of 5 g L−1. Each serum bottle was purged with N2 (99.99%) for 5 min to remove oxygen, then sealed with a butyl rubber stopper and crimped with an aluminum cap. All bottles were incubated at 35°C for 46 days. The volume of biogas produced was measured periodically with a gas-tight glass syringe. Liquid samples (2 mL) were collected periodically for pH and VFA analysis. Solid samples weighing approximately 1.0 g were taken for microbial analysis in the early stage (day 7) and final stage (day 46) of AD.
Analytical methods
The total solid (TS) and volatile solid (VS) contents of the inoculum and substrates were determined according to standard method GB/T 17664–1999 (China State Bureau of Quality and Technical Supervision Citation1999). Methane and carbon dioxide concentrations in the biogas were measured via gas chromatography (GC) on a 7890A gas chromatograph (Agilent Technologies, USA) equipped with a thermal conductivity detector (TCD). Operating temperature at the injector, column, and the TCD of the GC was 50oC, 70oC, and 100oC, respectively. The applied current was 110 mA. A gas chromatograph (7890 A, Agilent, USA) equipped with a flame ionization detector (FID) and a DB-FFAP capillary column (Agilent, USA) was used to determine the concentration of volatile fatty acids (VFAs) in the liquid samples. The analyzed VFAs included acetic acid, propionic acid, iso-butyric acid, n-butyric acid, n-valeric acid, and iso-valeric acid. The membrane filter of 0.45 μm was used to filter the liquid samples before analysis. The oven temperature of the GC was pre-heated to 100°C, and then rose from 100°C to 200°C at a heating rate of 10°C min−1. The injector and detector temperatures were 250°C and 300°C, respectively. The Ammonia-nitrogen concentration of a sample was measured with the Nessler’s reagent colorimetric method using an ultraviolet spectrophotometer (UV2400, Shimadzu, Japan) with
The total DNA in solid samples was extracted using a E.Z.N.A.® soil DNA Kit (Omega Bio-tek, Norcross, GA, USA) according to the manufacturer’s protocol. The concentration and purity of the isolated DNA were determined with a NanoDrop 2000 UV–vis spectrophotometer (Thermo Scientific, Wilmington, USA). The DNA was subjected to gel electrophoresis in 10% agarose gel to isolate the hypervariable V3-V4 regions of the bacterial 16S RNA gene. These regions were amplified with a GeneAmp 9700 thermocycler PCR system (ABI, USA). Each PCR began with denaturation for 3 min at 95°C and continued with 27 of the following cycles: heating for 30 s at 95°C, annealing for 30 s at 55°C, and elongation for 45 s at 72°C. A final extension was performed at 72°C for 10 min. The resulting PCR products were extracted from the 2% agarose gel and further purified using an AxyPrep DNA Gel Extraction Kit (Axygen Biosciences, Union City, CA, USA). The DNA was quantified using a QuantiFluor™-ST fluorometer (Promega, USA). The purified amplicons were pooled in equimolar amounts and paired-end sequencing (2 × 300) was performed on the Illumina MiSeq platform (Illumina, San Diego, USA) according to the standard protocol.
Results and discussion
AD of carbohydrate-rich substrate
AD performance
shows the cumulative methane yields, pH, and VFA profiles of C-SSB and C-control. At the end of the experiment on day 46, the cumulative methane production of C-SSB was 342.9 mL g VS−1, which was 4.74 times higher than that of C-control (72.4 mL g VS−1). The results indicated that the addition of SSB accelerated methane generation from cooked rice. The lag phase of AD in C-SSB lasted 18 days and was shorter than the lag phase in C-control (35 days). The shortening microbial lag phase in AD with biochar addition has been reported by other researchers (Fagbohungbe et al. Citation2016). The shorter lag phase could be because of various biochar effects: supporting methanogenic microflora on biochar (Mumme et al. Citation2014), providing DIET (Wang et al. Citation2020; Wu et al. Citation2020; Zhao et al. Citation2016). Otherwise, it would take time to develop biogenic pili to transfer electrons or to transfer electrons with low H2 partial pressures(Shrestha and Rotaru Citation2014). The reduction of adverse effects of some toxicants (ammonia and acids-buffering) by biochar addition also were reported (Lü et al. Citation2016; Pan et al. Citation2019). As shown in , the pH dropped during the beginning of AD due to excessive hydrolysis and acidification with C-SSB and C-control. The pH in C-SSB then increased rapidly from 4.5 to approximately 7.0. After dropping to pH 4.2, the pH in C-control increased very slowly and finally stabilized at ~5.0, which was below the optimum pH range (6.8–7.8) for AD (Lahav and Morgan Citation2004). The less initial pH drop with SSB and could be results of the SSB buffering effect by Shen et al. (Citation2016) and Zhang et al. (Citation2018).
Figure 1. The change of (a) cumulative methane yield; (b) pH, (c) VFAs in C-SSB, and (d) VFAs in C-control.
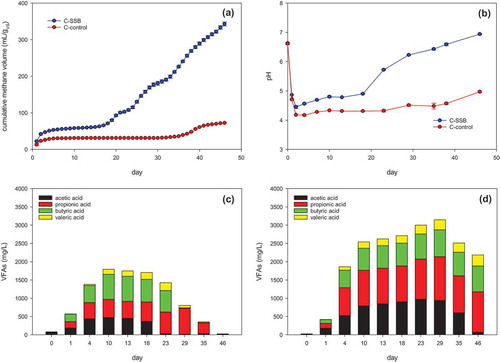
As shown in ,, the VFA contents in both C-SSB and C-control quickly increased in the early stage of AD, suggesting that VFAs accumulated in each. The maximum acetic acid concentration (472 mg L−1) in C-SSB was reached at day 10. The concentration of propionic acid in C-SSB increased from 10.9 mg L−1 to 709 mg L−1 (day 29), then quickly decreased along with the consumption of acetic and butyric acid. The maximum concentration of acetic acid (969 mg L−1) in C-control was reached on day 23, while the propionic acid concentration increased until day 29 to reach 1197 mg L−1. The lower concentration and rapid consumption of propionic acid in C-SSB suggested that SSB addition could facilitate VFA degradation and propionic acid degradation (Ma et al. Citation2019; Zhao et al. Citation2016). Propionic acid is a thermodynamically unfavorable substrate for microbes and can be toxic in an AD system if it accumulates above a specific concentration.
AD microbial community analysis with the carbohydrate-rich substrate
The structure of the bacterial community of AD with the carbohydrate-rich substrate is shown in . The dominant phyla in the inoculum were Chloroflexi (21.81%), Proteobacteria (13.23%), Firmicutes (11.01%), and Bacteroidetes (10.92%). In contrast to the inoculum, the microbial community early in the AD was dominated by Firmicutes, Bacteroidetes, and Fusobacteria. Firmicutes utilize macromolecules, such as polymeric carbohydrates, as substrates to produce VFAs as end products (Amani et al. Citation2011). The relative abundance of Firmicutes in C-control was higher than it was in C-SSB. VFA concentrations in C-control was higher than in C-SSB. In contrast, the relative abundance of Bacteroidetes in C-SSB was higher than in C-control in the early stage of AD. Cardinali-Rezende et al. (Citation2012) addressed that Bacteroidetes species were acidogenic, sugar-fermenting, and saccharolytic bacteria that yielded propionate and acetate as their primary products. Lei et al. (Citation2016) showed that Bacteroidetes species were capable of extracellular electron transfer and became enriched on a carbon cloth surface. The high relative abundance of Bacteroidetes could indicate that SSB addition facilitated DIET. In the final stage of AD, the dominant bacterial phyla were Firmicutes and Bacteroidetes in both C-SSB and C-control. The relative abundance of Firmicutes in C-SSB had decreased from 40.62% to 30.89%. The result might be because of the depletion of macromolecules. However, Firmicutes remained dominant in C-control in the final stage. The relative abundance of Firmicutes in C-control was 68.71%, which was consistent with the acidic pH in C-control. There was a minor change in the abundance of Bacteroidetes between the early stage and the final stage of the AD digesters. However, the abundances of Fusobacteria in C-control and C-SSB at the final stage decreased to 2.6% and 0.0%, respectively.
Figure 2. The comparison of (a) bacteria at the phylum level and (b) archaea at the genus level among the inoculum, C-SSB, and C-control in the early (e), and final (f) stages.
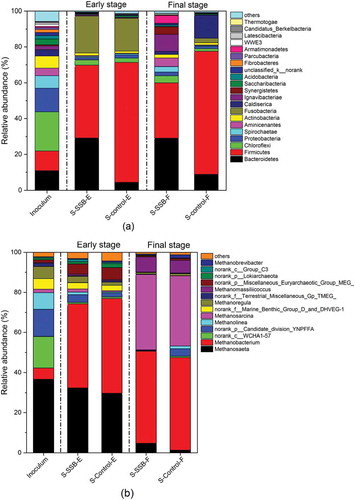
The relative abundance of archaea in the anaerobic digesters containing the carbohydrate-rich substrate is presented at the genus level in . The relative abundance of the methanogenic archaea, including Methanosaeta, Methanobacterium, Methanoliea, Methanosarcina, Methanoregula, Methanomassiliicoccus, and Methanobrevibacter, in the inoculum was 58.80%. In the early stage of AD, the abundances of methanogens in C-SSB and C-control increased to 81.37% and 80.69%, respectively. Methanosaeta and Methanobacterium were dominant in both C-SSB and C-control. The genus Methanosaeta uses acetate as a substrate for methane production (Rotaru et al. Citation2014). The genus Methanobacterium includes a hydrogenotrophic methanogen that utilizes H2 and CO2 exclusively as electron donors for CH4 formation (Algapani et al. Citation2018). In the final stage of AD, there was no considerable difference between the relative abundances of Methanobacterium methanogens in C-SSB (47.34%) and C-control (49.71%). Methanosarcina was dominant in both digesters in the final stage of AD. Methanogens in the genus Methanosarcina are the most metabolically and physiologically versatile. They can convert various substrates, including acetate, hydrogen, and methyl groups, to methane (Kurade et al. Citation2019).
AD of protein-rich substrate
AD performance
As shown in , the cumulative methane yields of P-SSB (456.0 mL g VS−1) and P-control (477.0 mL g VS−1) were similar. Also, no lag phase was observed in either of the reactors containing the protein-rich substrate. The pH in P-SSB and P-control () also indicated that acidic inhibition did not occur in either. The pH in both P-SSB and P-control increased quickly and remained near 7.6 until digestion was complete. The VFA concentrations in P-control () were much lower than those in P-SSB (). The maximum acetic acid concentrations in P-SSB and P-control were 396 mg L−1 (day 29) and 192 mg L−1 (day 23), respectively. This result may be the faster consumption of VFAs in P-control than in P-SSB.
Figure 3. The change of (a) cumulative methane yield, (b) pH, (c) VFAs in P-SSB, and (d) VFAs in P-control.
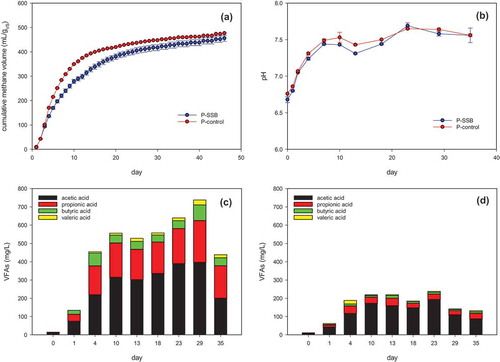
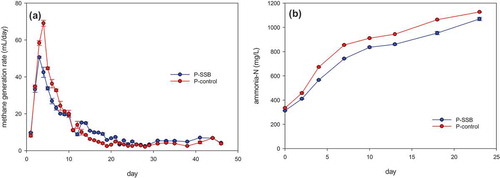
The higher peak daily methane generation was observed in P-control than in P-SSB (). The peak daily methane generation was 69 mL/day on day 5 in P-control but was 50 mL/day on day 3 in P-SSB. Ammonia nitrogen concentrations increased with the progress of proteins hydrolysis through the deamination of amino acids (Liu et al. Citation2012). As shown in , the highest concentration of ammonia nitrogen in P-SSB and P-control was 1069 mg/L and 1127 mg/L, respectively. It was considered that the concentrations of ammonia nitrogen were below the thresholds for AD inhibition(Dai et al. Citation2016). The ammonia nitrogen concentration of P-control was slightly higher than that of P-SSB all the time. This result indicated that the hydrolysis process of proteins in the AD without SSB might be slightly faster than the AD conditions with SSB, or SSB was absorbed a part of ammonia nitrogen(Kizito et al. Citation2015). Thus, the addition of SSB did not enhance methane production under the experimental conditions in the AD with the protein-rich substrate.
Figure 4. (a) Methane generation rate and (b) ammonia-nitrogen concentration in P-SSB and P-control.
Analysis of the AD microbial community with the protein-rich substrate
The dominant phyla in the early stage of AD with the protein-rich substrate were Bacteroidetes, Firmicutes, Chloroflexi, and Proteobacteria (). The relative abundances of Bacteroidetes in P-SSB and P-control were 72.23% and 57.36%, respectively. The higher abundance of Bacteroidetes in P-SSB could have been due to SSB addition. The relative abundances of Bacteroidetes in P-SSB and P-control decreased to 59.60% and 47.93%, respectively, in the final stage of AD with the substrate depletion. The relative abundances of species in the phyla Proteobacteria and Spirochaetae in P-SSB and P-Control were higher in the final stage of AD. The abundance of Proteobacteria was higher in P-SSB, while Spirochaetae was more abundant in P-control. Proteobacteria are commonly found in AD reactors and have essential metabolic functions in the AD process. These bacteria utilize glucose, propionate, butyrate, and other small molecules as substrates (Zou et al. Citation2018). Acetogenic bacteria in the phylum Spirochaetae are capable of accelerating the conversion of VFAs to acetate (Lee et al. Citation2009). However, the enrichment of Bacteroidetes and Proteobacteria species by SSB supplementation for the AD of the protein-rich substrate was not resulted in increasing methane production ().
Figure 5. The comparison of (a) bacteria at the phylum level and (b) archaea at the genus level among the inoculum, P-SSB, and P-control in the early (e), and final (f) stages.
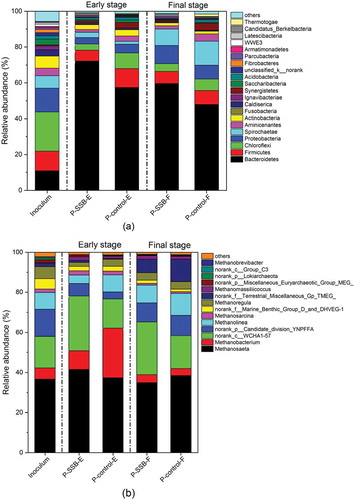
As shown in , the relative abundances of methanogenic archaea in P-SSB and P-control were higher in the early phase of AD than they were in the inoculum (58.80%). The abundance of methanogens in P-control (77.22%) was higher than it was in P-SSB (60.91%). In the early stage, the dominant genera were Methanosaeta, Methanobacterium, and Methanolinea in both P-SSB and P-control. Except for Methanosaeta, the relative abundances of Methanobacterium and Methanolinea in P-control were higher than those in P-SSB. Genus Methanolinea is hydrogenotrophic and plays an essential role in the degradation of propionate and butyrate by scavenging H2 (Li et al. Citation2018). The relative abundances of methanogens in P-SSB (54.24%) and P-control (58.94%) were lower in the final stage of AD and were similar to those in the inoculum.
AD with lipid-rich substrate
AD performance
The cumulative methane yields of AD with the lipid-rich substrate are presented in . The cumulative methane yield of L-SSB and L-control was 834.8(±17.8) mL g VS−1 and 793.4 (±14.2) mL g VS−1, respectively. However, the methane production rate of L-SSB was also faster than that of L-control. The time to recover a 50% of cumulative methane volume was 18 days in L-SSB but was 30 days in L-control. The methane yield obtained with the lipid-rich substrate was higher than the yields obtained with the carbohydrate-rich and protein-rich substrates. Changes in the pH of L-SSB and L-control () were similar. The pH in L-SSB and L-control remained near 7.0 and 6.8, respectively.
Figure 6. The change of (a) cumulative methane yield, (b) pH; (c) VFAs in L-SSB, and (d) VFAs in L-control.
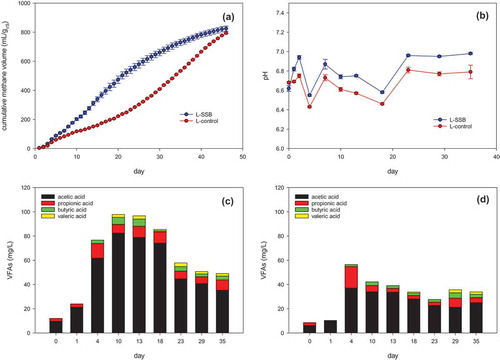
The changes in the VFA concentrations in L-SSB and L-control are compared in ,. L-SSB contained a higher concentration of VFAs, 80% of which was acetic acid. Long-chain fatty acids (LCFAs) are the primary intermediates in lipid digestion. In an AD with a lipid-rich feedstock, LCFAs can either inhibit digestion (Mendes, Pereira, and de Castro Citation2006; Rasit et al. Citation2015) or be degraded by symbiotic acetogens and methanogens (Palatsi et al. Citation2010; Sousa et al. Citation2009). The primary LCFA degradation pathway in acidogens, known as β-oxidation with coenzyme A, produces acetate and hydrogen (Alves et al. Citation2009). This degradation process likely accounted for the high proportion of acetic acid in the VFAs generated during the AD of lard. The higher acetic acid concentration in L-SSB suggested that SSB could facilitate the LCFA degradation process to enhance methane production. The results that SSB addition could improve AD of the lipid-rich substrate and lower the inhibitory effect of LCFA. The VFA concentrations of L-control were much lower than those of L-SSB. The VAF levels are the results of balancing VFA formation and consumption processes. The low VFA concentrations of L-control was considered due to the slow degradation of LCFA (slow VFA formation) than the fast utilization of VFAs.
Analysis of the AD microbial community with the lipid-rich substrate
The bacterial communities in the inoculum, L-SSB, and L-control are compared at the phylum level in . In the early stage of AD, Firmicutes, Bacteroidetes, Chloroflexi, Proteobacteria, and Spirochetes were dominant in both L-control and L-SSB. L-SSB contained slightly higher proportions of Firmicutes and Bacteroidetes than L-control. Spirochetes were slightly more abundant in L-SSB and L-control than in the inoculum. The relative abundance of Proteobacteria in L-SSB was similar to those in the inoculum and L-control. In contrast, the relative abundance of Chloroflexi was lower in both L-SSB and L-control than it was in the inoculum. The relative abundances of bacteria in the phyla Firmicutes and Bacteroidetes decreased in L-SSB and L-control in the final stage of AD, while the relative abundance of Chloroflexi increased. The microbial communities of L-SSB and L-control in the final stage were similar to those of the inoculum.
Figure 7. The comparison of (a) bacteria at the phylum level and (b) archaea at the genus level among the inoculum, L-SSB, and L-control in the early (e), and final (f) stages.
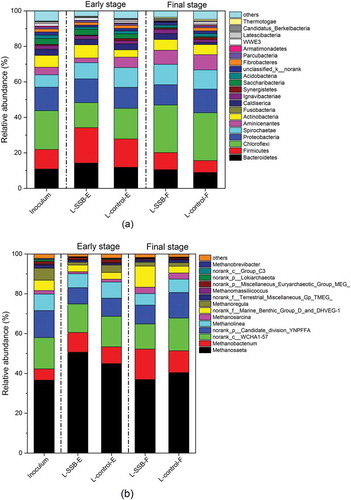
The archaeal community structures in L-SSB and L-control in the early and final stages of AD are illustrated in . In the early stage, the relative abundances of methanogenic archaea in L-SSB and L-control increased to 70.33% and 67.02%, respectively. The genus Methanosaeta predominated in this stage and accounted for 72.04% and 67.01% of methanogens in L-SSB and L-control, respectively. The abundance of the genus Methanobacterium increased in both L-SSB and L-control, although its abundance in L-SSB was slightly higher. However, the abundance of methanogenic Methanolinea was slightly lower in L-SSB than in L-control. These results suggested that higher methane production in L-SSB in the early stage was mainly due to the activities of Methanosaeta and Methanobacterium. The relative abundances of methanogens in L-SSB and L-control in the final stage decreased to 63.84% and 63.24%, respectively, and the genus Methanosaeta remained dominant in both. The abundance of Methanobacterium was also higher in both digesters compared to its abundance in the early stage. The proportion of the genus Methanolinea in the reactors did not change considerably.
Summary and implications
When the results of AD with carbohydrate-rich, protein-rich, and lipid-rich substrates were compared, it was clear that SSB supplementation improved methane generation from all but the protein-rich substrate. These results suggested that the effect of SSB addition on AD varied with the substrate since the substrates underwent different degradation processes with various microbial communities. The effect of SSB addition on AD was most evident with the carbohydrate-rich substrate. SSB supplementation shortened the lag phase, and the optimal pH was established quickly in the presence of SSB. SSB addition also improved methane production during AD of the lipid-rich substrate, particularly in the early stage. The high acetic acid concentration in L-SSB suggested that the SSB could enhance both LCFAs degradation and methane production. No distinct improvement in methane production from the protein-rich substrate was observed by SSB addition.
Firmicutes were the most dominant bacterial phylum in the AD of the carbohydrate-rich feedstock. Firmicutes may have been more tolerant of the unfavorable conditions caused by VFA accumulation. Bacteroidetes were the most dominant bacterial phylum in the AD of the protein-rich substrate. The relative abundance of Bacteroidetes was increased by SSB addition in all digesters regardless of the substrate. However, Bacteroidetes enrichment in P-SSB reactor did not improve methane production. Methanosaeta was the most dominant methanogenic archaeal genus in the AD of the protein-rich and lipid-rich substrates in both the early and final stages. However, Methanobacterium was the most dominant genus in both stages in reactors that contained the carbohydrate-rich substrate. SSB addition enhanced the relative abundances of methanogenic archaea in digesters containing either the carbohydrate-rich or lipid-rich substrate, particularly in the early stage, and it promoted methane generation in C-SSB and L-SSB.
Conclusion
The effects of SSB addition on the AD of three different substrates were investigated. SSB supplementation led to an overall improvement in the AD of the carbohydrate-rich substrate by shortening the lag phase and increasing methane production. SSB supplementation in the AD of the lipid-rich substrate also accelerated methane production. However, SSB addition caused no significant improvement in the AD of the protein-rich substrate. SSB addition promoted the enrichment of Bacteroidetes regardless of the substrate. SSB addition led to increases in the relative abundances of methanogenic archaea in the AD of the carbohydrate-rich and lipid-rich substrates. Methanosaeta was the most dominant genus in the early stage of AD with each substrate, and the relative abundance of Methanosaeta in this stage was enhanced by SSB supplementation. Methanobacterium species also played an essential role in the AD of the carbohydrate-rich substrate.
Disclosure statement
No potential conflict of interest was reported by the authors.
Additional information
Funding
Notes on contributors
Qiyong Xu
Qiyong Xu is an associate professor in the School of Environment and Energy at Peking University Shenzhen Graduate School in Shenzhen, China.
Yuqing Liao
Yuqing Liao is a graduate student in the School of Environment and Energy at Peking University Shenzhen Graduate School in Shenzhen, China.
Eunil Cho
Eunil Cho is a professor in the Department of Environmental Engineering at Jeju National University in the Republic of Korea.
Jae Hac Ko
Jae Hac Ko is an assistant professor in the Department of Environmental Engineering at Jeju National University in the Republic of Korea.
References
- Algapani, D. E., W. Qiao, F. di Pumpo, D. Bianchi, S. M. Wandera, F. Adani, and R. Dong. 2018. Long-term bio-H2 and bio-CH4 production from food waste in a continuous two-stage system: Energy efficiency and conversion pathways. Bioresour. Technol. 248:204–13. doi:10.1016/j.biortech.2017.05.164.
- Alibardi, L., and R. Cossu. 2016. Effects of carbohydrate, protein and lipid content of organic waste on hydrogen production and fermentation products. Waste Manage. 47:69–77. doi:10.1016/j.wasman.2015.07.049.
- Alves, M. M., M. A. Pereira, D. Z. Sousa, A. J. Cavaleiro, M. Picavet, H. Smidt, and A. J. M. Stams. 2009. Waste lipids to energy: How to optimize methane production from long-chain fatty acids (LCFA). Microb. Biotechnol. 2:538–50. doi:10.1111/j.1751-7915.2009.00100.x.
- Amani, T., M. Nosrati, S. M. Mousavi, and R. K. Kermanshahi. 2011. Study of syntrophic anaerobic digestion of volatile fatty acids using enriched cultures at mesophilic conditions. Int. J. Environ. Sci. Technol. 8:83–96. doi:10.1007/BF03326198.
- Cardinali-Rezende, J., L. F. D. B. Colturato, T. D. B. Colturato, E. Chartone-Souza, A. M. A. Nascimento, and J. L. Sanz. 2012. Prokaryotic diversity and dynamics in a full-scale municipal solid waste anaerobic reactor from start-up to steady-state conditions. Bioresour. Technol. 119:373–83. doi:10.1016/j.biortech.2012.05.136.
- Chen, Y., J. J. Cheng, and K. S. Creamer. 2008. Inhibition of anaerobic digestion process: A review. Bioresour. Technol. 99:4044–64. doi:10.1016/j.biortech.2007.01.057.
- China State Bureau of Quality and Technical Supervision. 1999. Wood charcoal and test method of wood charcoal. Beijing, China: Chinese National Standard.
- Cuetos, M. J., E. J. Martinez, R. Moreno, R. Gonzalez, M. Otero, and X. Gomez. 2017. Enhancing anaerobic digestion of poultry blood using activated carbon. J. Adv. Res. 8:297–307. doi:10.1016/j.jare.2016.12.004.
- Dai, X., H. Yan, N. Li, J. He, Y. Ding, L. Dai, and B. Dong. 2016. Metabolic adaptation of microbial communities to ammonium stress in a high solid anaerobic digester with dewatered sludge. Sci. Rep. 6:28193. doi:10.1038/srep28193.
- Fagbohungbe, M. O., B. M. J. Herbert, L. Hurst, H. Li, S. Q. Usmani, and K. T. Semple. 2016. Impact of biochar on the anaerobic digestion of citrus peel waste. Bioresour. Technol. 216:142–49. doi:10.1016/j.biortech.2016.04.106.
- Hu, Q., D. Sun, Y. Ma, B. Qiu, and Z. Guo. 2017. Conductive polyaniline nanorods enhanced methane production from anaerobic wastewater treatment. Polymer 120:236–43. doi:10.1016/j.polymer.2017.05.073.
- Kizito, S., S. Wu, W. Kipkemoi Kirui, M. Lei, Q. Lu, H. Bah, and R. Dong. 2015. Evaluation of slow pyrolyzed wood and rice husks biochar for adsorption of ammonium nitrogen from piggery manure anaerobic digestate slurry. Sci. Total Environ. 505:102–12. doi:10.1016/j.scitotenv.2014.09.096.
- Ko, J. H., J. Wang, and Q. Xu. 2018a. Impact of pyrolysis conditions on polycyclic aromatic hydrocarbons (PAHs) formation in particulate matter (PM) during sewage sludge pyrolysis. Chemosphere 208:108–16. doi:10.1016/j.chemosphere.2018.05.120.
- Ko, J. H., N. Wang, T. Yuan, F. Lü, P. He, and Q. Xu. 2018b. Effect of nickel-containing activated carbon on food waste anaerobic digestion. Bioresour. Technol. 266:516–23. doi:10.1016/j.biortech.2018.07.015.
- Kobayashi, T., K.-Q. Xu, -Y.-Y. Li, and Y. Inamori. 2012. Evaluation of hydrogen and methane production from municipal solid wastes with different compositions of fat, protein, cellulosic materials and the other carbohydrates. Int. J. Hydrogen Energy 37:15711–18. doi:10.1016/j.ijhydene.2012.05.044.
- Kurade, M. B., S. Saha, E.-S. Salama, S. M. Patil, S. P. Govindwar, and B.-H. Jeon. 2019. Acetoclastic methanogenesis led by Methanosarcina in anaerobic co-digestion of fats, oil and grease for enhanced production of methane. Bioresour. Technol. 272:351–59. doi:10.1016/j.biortech.2018.10.047.
- Lü, F., C. Luo, L. Shao, and P. He. 2016. Biochar alleviates combined stress of ammonium and acids by firstly enriching Methanosaeta and then Methanosarcina. Water Res. 90:34–43. doi:10.1016/j.watres.2015.12.029.
- Lahav, O., and B. Morgan. 2004. Titration methodologies for monitoring of anaerobic digestion in developing countries—a review. J. Chem. Technol. Biotechnol. 79:1331–41. doi:10.1002/jctb.1143.
- Lee, D. H., S. K. Behera, J. W. Kim, and H.-S. Park. 2009. Methane production potential of leachate generated from Korean food waste recycling facilities: A lab-scale study. Waste Manage. 29:876–82. doi:10.1016/j.wasman.2008.06.033.
- Lei, Y., D. Sun, Y. Dang, H. Chen, Z. Zhao, Y. Zhang, and D. E. Holmes. 2016. Stimulation of methanogenesis in anaerobic digesters treating leachate from a municipal solid waste incineration plant with carbon cloth. Bioresour. Technol. 222:270–76. doi:10.1016/j.biortech.2016.10.007.
- Lesteur, M., V. Bellon-Maurel, C. Gonzalez, E. Latrille, J. M. Roger, G. Junqua, and J. P. Steyer. 2010. Alternative methods for determining anaerobic biodegradability: A review. Process Biochem. 45:431–40. doi:10.1016/j.procbio.2009.11.018.
- Li, S., C. Liang, and Z. Shangguan. 2017. Effects of apple branch biochar on soil C mineralization and nutrient cycling under two levels of N. Sci. Total Environ. 607-608:109–19. doi:10.1016/j.scitotenv.2017.06.275.
- Li, Y., Y. Sun, L. Li, and Z. Yuan. 2018. Acclimation of acid-tolerant methanogenic propionate-utilizing culture and microbial community dissecting. Bioresour. Technol. 250:117–23. doi:10.1016/j.biortech.2017.11.034.
- Liu, H., J. Wang, X. Liu, B. Fu, J. Chen, and H.-Q. Yu. 2012. Acidogenic fermentation of proteinaceous sewage sludge: Effect of pH. Water Res. 46:799–807. doi:10.1016/j.watres.2011.11.047.
- Luo, C., F. Lü, L. Shao, and P. He. 2015. Application of eco-compatible biochar in anaerobic digestion to relieve acid stress and promote the selective colonization of functional microbes. Water Res. 68:710–18. doi:10.1016/j.watres.2014.10.052.
- Ma, J., J. Pan, L. Qiu, Q. Wang, and Z. Zhang. 2019. Biochar triggering multipath methanogenesis and subdued propionic acid accumulation during semi-continuous anaerobic digestion. Bioresour. Technol. 293:122026. doi:10.1016/j.biortech.2019.122026.
- Martínez, E. J., J. G. Rosas, A. Sotres, A. Moran, J. Cara, M. E. Sánchez, and X. Gómez. 2018. Codigestion of sludge and citrus peel wastes: Evaluating the effect of biochar addition on microbial communities. Biochem. Eng. J. 137:314–25. doi:10.1016/j.bej.2018.06.010.
- Masebinu, S. O., E. T. Akinlabi, E. Muzenda, and A. O. Aboyade. 2019. A review of biochar properties and their roles in mitigating challenges with anaerobic digestion. Renewable Sustainable Energy Rev. 103:291–307. doi:10.1016/j.rser.2018.12.048.
- Mendes, A. A., E. B. Pereira, and H. F. de Castro. 2006. Effect of the enzymatic hydrolysis pretreatment of lipids-rich wastewater on the anaerobic biodigestion. Biochem. Eng. J. 32:185–90. doi:10.1016/j.bej.2006.09.021.
- Mumme, J., F. Srocke, K. Heeg, and M. Werner. 2014. Use of biochars in anaerobic digestion. Bioresour. Technol. 164:189–97. doi:10.1016/j.biortech.2014.05.008.
- Palatsi, J., J. Illa, F. X. Prenafeta-Boldú, M. Laureni, B. Fernandez, I. Angelidaki, and X. Flotats. 2010. Long-chain fatty acids inhibition and adaptation process in anaerobic thermophilic digestion: Batch tests, microbial community structure and mathematical modelling. Bioresour. Technol. 101:2243–51. doi:10.1016/j.biortech.2009.11.069.
- Pan, J., J. Ma, L. Zhai, T. Luo, Z. Mei, and H. Liu. 2019. Achievements of biochar application for enhanced anaerobic digestion: A review. Bioresour. Technol. 292:122058. doi:10.1016/j.biortech.2019.122058.
- Paritosh, K., S. K. Kushwaha, M. Yadav, N. Pareek, A. Chawade, and V. Vivekanand. 2017. Food waste to energy: An overview of sustainable approaches for food waste management and nutrient recycling. Biomed. Res. Int. 2017:2370927–2370927. doi:10.1155/2017/2370927.
- Qin, Y., H. Wang, X. Li, J. J. Cheng, and W. Wu. 2017. Improving methane yield from organic fraction of municipal solid waste (OFMSW) with magnetic rice-straw biochar. Bioresour. Technol. 245:1058–66. doi:10.1016/j.biortech.2017.09.047.
- Raposo, F., V. Fernández-Cegrí, M. A. De la Rubia, R. Borja, F. Béline, C. Cavinato, G. Demirer, B. Fernández, M. Fernández-Polanco, J. C. Frigon, et al. 2011. Biochemical methane potential (BMP) of solid organic substrates: Evaluation of anaerobic biodegradability using data from an international interlaboratory study. J. Chem. Technol. Biotechnol. 86:1088–98. doi:10.1002/jctb.2622.
- Rasit, N., A. Idris, R. Harun, and W. A. Wan Ab Karim Ghani. 2015. Effects of lipid inhibition on biogas production of anaerobic digestion from oily effluents and sludges: An overview. Renewable Sustainable Energy Rev. 45:351–58. doi:10.1016/j.rser.2015.01.066.
- Rotaru, A.-E., P. M. Shrestha, F. Liu, M. Shrestha, D. Shrestha, M. Embree, K. Zengler, C. Wardman, K. P. Nevin, and D. R. Lovley. 2014. A new model for electron flow during anaerobic digestion: Direct interspecies electron transfer to Methanosaeta for the reduction of carbon dioxide to methane. Energy Environ. Sci. 7:408–15. doi:10.1039/C3EE42189A.
- Sheets, J. P., L. Yang, X. Ge, Z. Wang, and Y. Li. 2015. Beyond land application: Emerging technologies for the treatment and reuse of anaerobically digested agricultural and food waste. Waste Manage. 44:94–115. doi:10.1016/j.wasman.2015.07.037.
- Shen, Y., J. L. Linville, P. A. A. Ignacio-de Leon, R. P. Schoene, and M. Urgun-Demirtas. 2016. Towards a sustainable paradigm of waste-to-energy process: Enhanced anaerobic digestion of sludge with woody biochar. J. Clean. Prod. 135:1054–64. doi:10.1016/j.jclepro.2016.06.144.
- Shrestha, P. M., and A.-E. Rotaru. 2014. Plugging in or going wireless: Strategies for interspecies electron transfer. Front. Microbiol. 5: doi: 10.3389/fmicb.2014.00237.
- Sousa, D. Z., H. Smidt, M. M. Alves, and A. J. M. Stams. 2009. Ecophysiology of syntrophic communities that degrade saturated and unsaturated long-chain fatty acids. FEMS Microbiol. Ecol. 68:257–72. doi:10.1111/j.1574-6941.2009.00680.x.
- Sun, Y., D. Wang, J. Yan, W. Qiao, W. Wang, and T. Zhu. 2014. Effects of lipid concentration on anaerobic co-digestion of municipal biomass wastes. Waste Manage. 34:1025–34. doi:10.1016/j.wasman.2013.07.018.
- U.S. Department of Agriculture, Agricultural Research Service. 2019. Accessed March 1, 2019. https://ndb.nal.usda.gov/
- Wan, C., Q. Zhou, G. Fu, and Y. Li. 2011. Semi-continuous anaerobic co-digestion of thickened waste activated sludge and fat, oil and grease. Waste Manage. 31:1752–58. doi:10.1016/j.wasman.2011.03.025.
- Wang, C., Y. Liu, X. Gao, H. Chen, X. Xu, and L. Zhu. 2018. Role of biochar in the granulation of anaerobic sludge and improvement of electron transfer characteristics. Bioresour. Technol. 268:28–35. doi:10.1016/j.biortech.2018.07.116.
- Wang, G., Q. Li, Y. Li, Y. Xing, G. Yao, Y. Liu, R. Chen, and X. C. Wang. 2020. Redox-active biochar facilitates potential electron tranfer between syntrophic partners to enhance anaerobic digestion under high organic loading rate. Bioresour. Technol. 298:122524. doi:10.1016/j.biortech.2019.122524.
- Wu, Y., S. Wang, D. Liang, and N. Li. 2020. Conductive materials in anaerobic digestion: From mechanism to application. Bioresour. Technol. 298:122403. doi:10.1016/j.biortech.2019.122403.
- Xu, Z., M. Zhao, H. Miao, Z. Huang, S. Gao, and W. Ruan. 2014. In situ volatile fatty acids influence biogas generation from kitchen wastes by anaerobic digestion. Bioresour. Technol. 163:186–92. doi:10.1016/j.biortech.2014.04.037.
- Yang, Y., Y. Zhang, Z. Li, Z. Zhao, X. Quan, and Z. Zhao. 2017. Adding granular activated carbon into anaerobic sludge digestion to promote methane production and sludge decomposition. J. Clean. Prod. 149:1101–08. doi:10.1016/j.jclepro.2017.02.156.
- Ye, M., J. Liu, C. Ma, -Y.-Y. Li, L. Zou, G. Qian, and Z. P. Xu. 2018. Improving the stability and efficiency of anaerobic digestion of food waste using additives: A critical review. J. Clean. Prod. 192:316–26. doi:10.1016/j.jclepro.2018.04.244.
- Yuan, H., and N. Zhu. 2016. Progress in inhibition mechanisms and process control of intermediates and by-products in sewage sludge anaerobic digestion. Renewable Sustainable Energy Rev. 58:429–38. doi:10.1016/j.rser.2015.12.261.
- Zhang, C., H. Su, J. Baeyens, and T. Tan. 2014. Reviewing the anaerobic digestion of food waste for biogas production. Renewable Sustainable Energy Rev. 38:383–92. doi:10.1016/j.rser.2014.05.038.
- Zhang, J., W. Zhao, H. Zhang, Z. Wang, C. Fan, and L. Zang. 2018. Recent achievements in enhancing anaerobic digestion with carbon- based functional materials. Bioresour. Technol. 266:555–67. doi:10.1016/j.biortech.2018.07.076.
- Zhang, J., and Y. Lu. 2016. Conductive Fe3O4 nanoparticles accelerate syntrophic methane production from butyrate oxidation in two different lake sediments. Front. Microbiol. 7: doi: 10.3389/fmicb.2016.01316.
- Zhao, Z., Y. Zhang, D. E. Holmes, Y. Dang, T. L. Woodard, K. P. Nevin, and D. R. Lovley. 2016. Potential enhancement of direct interspecies electron transfer for syntrophic metabolism of propionate and butyrate with biochar in up-flow anaerobic sludge blanket reactors. Bioresour. Technol. 209:148–56. doi:10.1016/j.biortech.2016.03.005.
- Zou, H., Y. Chen, J. Shi, T. Zhao, Q. Yu, S. Yu, D. Shi, H. Chai, L. Gu, Q. He, et al. 2018. Mesophilic anaerobic co-digestion of residual sludge with different lignocellulosic wastes in the batch digester. Bioresour. Technol. 268:371–81.