
 ?Mathematical formulae have been encoded as MathML and are displayed in this HTML version using MathJax in order to improve their display. Uncheck the box to turn MathJax off. This feature requires Javascript. Click on a formula to zoom.
ABSTRACT
In the spring of 2018, a 10-day field study was conducted in Colorado’s Denver-Julesburg oil and natural gas production basin to improve information on well pad pneumatic controller (PC) populations and identify PCs with potential maintenance issues (MIs) causing excess emissions through a novel optical gas imaging (OGI) survey approach. A total of 500 natural gas-emitting PCs servicing 102 wells (4.9 PCs/well) were surveyed at 31 facilities operated by seven different companies. The PCs were characterized by their designed operational function and applications, with 83% of the PC population identified as intermittent PCs (IPCs). An OGI inspection protocol was used to investigate emissions on 447 working PCs from this set. OGI detected continuous emissions from 11.3% of observed IPCs and these were classified as experiencing some level of MIs. OGI imaging modes were observed to have a significant effect on emission detectability with high sensitivity mode detection rates being approximately 2 times higher compared to auto mode. Fourteen snapshot emission measurements (not including actuations) were conducted on IPCs in this category using a high-volume sampling device with augmented quality assurance procedures with observed emissions rates ranging from 0.1 up to 31.3 scf/hr (mean = 2.8 scf/hr). For PCs with continuous depressurization type (CPC), 36.8% had continuous emissions observed by OGI. Four supporting emission measurements were conducted on CPCs with one unit exceeding the low bleed regulatory emission threshold with an emission rate of 9.9 scf/hr (mean = 4.2 scf/hr). Additional information was collected on PC actuation events, as observed with OGI, which showed a strong correlation between observed actuation events and facility production compared to observed continuous emissions caused by MIs which did not correlate with facility production.
Implications: A novel survey approach of pneumatic controllers at oil and natural gas production facilities in the Denver-Julesburg basin, using optical gas imaging and supporting emission measurements, was demonstrated as an effective method to identify controllers with potential maintenance issues causing excess emissions. The results of the pneumatic controller and optical gas imaging surveys improved information on pneumatic controller populations within the basin and also demonstrated the significant effect optical gas imaging modes have on emission detections.
Introduction
Pneumatic controllers (PCs) are one of the most ubiquitous emission sources at oil and natural gas (ONG) production facilities. As part of normal operations, PCs emit natural gas (NG) when executing temperature, pressure, liquid level, and other production process control functions. PCs come in many forms ranging from integrated systems with the pilot (the control or sensing component) and the actuator (the valve) contained within one device to hybrid designs where multiple individual components including PC pilots, electric switches, and actuators that are spatially separated and connected via tubing to provide the desired process control. PCs of different types and use applications have varying NG emission potential. Core application PCs, such as liquid level/dump valves on high producing wells, may actuate frequently and produce significant emissions, even when operating as intended. PCs in safety applications, such as an emergency well shut-in device, are designed to actuate infrequently and may produce low emissions when properly operating. Some ONG facilities power PCs with compressed air and therefore emit no NG. When a typical PC senses the need for a process change, it will open or close a control valve and gas is released from the combination of PC pilot, the valve bonnet (the pressured body and diaphragm creating the motive force), and the volume of the tubing connecting the two. In a non-actuating state, the emissions from a PC depend on its design and maintenance condition. A continuous PC (CPC) is designed to emit at a relatively constant rate that is modulated during actuation. An intermittent PC (IPC) is designed to achieve de minimis emissions between actuations (Simpson Citation2014).
The 2017 U.S. Greenhouse Gas Inventory identified 836,804 and 629,955 PCs in use at NG and oil production facilities, respectively (U.S. EPA Citation2019a). The composition of gas emitted by PCs is primarily methane but can include other hydrocarbons at varying percentages depending on the composition of the extracted gas stream and details of the ONG process. Due to their vast number, PCs are identified as the largest contributor of methane emissions for onshore ONG production facilities (U.S. EPA Citation2018). The U.S. Greenhouse Gas Emissions Inventory and Greenhouse Gas Reporting Program categorize PCs into three groups, (high bleed CPCs, low bleed CPCs and IPCs) and assign each group a specific emission factor (EF) representative of long-term averages in the source category (U.S. EPA Citation2019b). High bleed and low bleed CPCs are differentiated based on their bleed rates with high bleed CPCs being regulatorily defined as having a bleed rate of greater than 6 standard cubic feet per hour (scf/hr) and low bleeds having bleed rates less than or equal to 6 scf/hr. High bleed and low bleed CPCs were assigned EFs of 37.3 scf/hr and 1.39 scf/hr, respectively, whereas IPCs have an EF of 13.5 scf/hr. The range of real-world PC types and services represented by these EFs is very broad. For example, properly operating IPCs in certain crude service applications can have emissions an order of magnitude lower than the EF (Thoma et al. Citation2017) and at the other end of the spectrum, IPCs at high producing gas facilities can significantly exceed the EF (Allen et al. Citation2014; Luck et al. Citation2019). The number of PCs per well has increased as more processes are pneumatically controlled, and emission inventories have seen a dramatic shift from CPCs to the use of IPCs over the last two decades and they are now the dominate PC type on the national level (U.S. EPA Citation2016, Citation2019a). For this reason, improved understanding of the IPC category is important.
Previous PC emission studies (Allen et al. Citation2014; Luck et al. Citation2019; Thoma et al. Citation2017) have identified skewed population distributions where a relatively small number of devices account for a disproportionately large amount of emissions from a surveyed population. In many cases, these high-emitting devices are associated with leaks, malfunctions, or abnormal production processes. In a multi-basin study, (Allen et al. Citation2014), found that the population average emission rate (ER) was strongly influenced by the 40 highest-emitting devices with 28 of the 40 PCs experiencing “equipment issues.” Using a different definition of a malfunctioning PC, (Thoma et al. Citation2017), found average ER for the PC population was determined in large part by the malfunction frequency and ER. It can be argued that the weaknesses of previous studies include insufficient randomized sampling, short measurement duration, and generally low number of observations, due in part to the implementation burden of the methods employed. Previously utilized techniques, such as installed mass flow meters on PC supply lines, can inform PC ERs, temporal profiles, and activity information but are somewhat invasive and time-intensive to implement. Since previous studies have illustrated the importance of determining the frequency of occurrence and the ERs of malfunctioning PC systems, modified survey approaches that increase study sample size by focusing on potentially malfunctioning PCs have value.
This paper describes a 2018 field study conducted in Colorado’s Denver-Julesburg (DJ) ONG production basin that aimed to improve information on the basin’s PC populations. One objective of the study was to gather information on the types and uses of PCs employed by randomly selecting facilities representative of the overall basin. Another objective was to investigate the use of an expeditious and less invasive PC emissions survey approach based on optical gas imaging (OGI) that could help inform PC operational and maintenance states.
Methods
Well pad selection and representativeness
The study was limited to investigation of PC systems on ONG production well pads located in the Wattenberg field of the greater DJ Basin of Colorado (counties of Adams, Boulder, Broomfield, Denver, Jefferson, Larimer, and Weld). The participating company selection process was conducted by reaching out to the largest operators within the study area and of that group only three chose not to participate. Wells operated by seven participating ONG companies formed a selection pool that represented 24,220 actively producing wells (75.2% of all wells currently producing in the study area). From the selection pool, the study team formed geographically defined regions containing a collection of facilities that could be efficiently visited in a daily field measurement session (to minimize driving time), from which random selections were made. The ONG operators were not involved in the determination of the study area or in the daily selection process and were notified of the facility selections on the day of the field survey.
In total, 31 well pad facilities, with representation from each of the seven different operators, were part of the study. No selected and visited facilities were excluded from the analysis. The facilities included a range of production well pad complexity. The smallest facilities included minimal equipment such as: one wellhead, one separator, and one or two tanks. The facilities increased in complexity up to large-scale facilities with multiple wellheads, separators including second and third stage separation vessels, complex tank batteries with vapor capture systems, multiple control devices, gas lift compressor engines, and vapor recovery units.
The representativeness of the surveyed well pads compared favorably to field-wide profiles for the Wattenberg field for several parameters relevant to PC populations and emissions including: well age, wellbore type, and recent oil and gas production volumes (). For example, ONG production volumes may influence the actuation frequency of PCs associated with production processes and age could play a role in PC condition and the likelihood of malfunction. In terms of well bore type, the study sample size was 50.0% vertical, 33.3% horizontal and 16.7% directional, which also closely matched the field distributions of 42.1% vertical, 38.9% horizontal, and 19% directional. Well counts per facility visited ranged from 1 to 8, with a study average of 3.4 wells per facility. It is typical for non-consolidation production facilities to have one initial separator for each well routed to the facility with potentially additional secondary separation vessels. The separator counts per facility ranged from 1 to 10 with an average of 2.9. Further analysis of facility process equipment and their associated PC populations is found in supplemental information SI-2.
Figure 1. Distributions of well counts from this study (primary ordinates axes, solid bars) with actual field study-selected distributions (secondary ordinated axes, dashed line) for: (a) well spud dates; (b) 2017 well oil production; (c) 2017 well gas production.
PC survey and evaluation methods
This study uses a “snapshot in time” determination of the presence or absence of continuous emissions from PC pilots, using a modified OGI protocol, to assess the basic operational state of the PC systems. Unlike other studies that used installed flow meters and observations of spatially separated actuators and connecting tubing (Allen et al. Citation2014; Luck et al. Citation2019; Thoma et al. Citation2017), this work focuses on the PC pilot with a limited-time observation, and therefore does not represent a comprehensive assessment of PC system emissions. With thoughts toward routine inspection, the OGI method attempts to maximize observation sample size per hour of field time, with a focus on identifying PCs (or driving processes) that may not be well maintained or optimized, and therefore may produce more emissions than intended by design. In this paper, an apparently non-optimized system (as determined by OGI observation) is referred to as a PC (or process) experiencing a potential maintenance issue (MI).
Although not part of an envisioned routine procedure, supporting PC ER measurements were made in this study on a subset of OGI-observed continuously emitting PCs to further inform the OGI method and the severity of the encountered MIs (or malfunctions). To accomplish the OGI survey and MI assessment, engineering data on aspects of well pad operation and the encountered pneumatic systems (PSs), of which PCs are a subset, were determined through information gathering activities. These data also served to meet one of the study objectives to improve understanding of the number and types of PCs used in the DJ Basin. The following sections describe the methods used in this study.
Well pad and PC information gathering
For each well pad surveyed, general information was collected including: major equipment counts and descriptions, meteorological conditions at the time of facility visit, and ONG production levels. Detailed information was gathered on all PSs, a growing number which execute process control functions similar to traditional PCs but do not employ NG or instrument air (IA) emitting PC pilots. For example, a PS that uses an automated electronic signal and solenoids to trigger a final control process element does not require a gas-emitting mechanism, so these systems were not classified here as PCs. Further information on non-PC containing PSs is found in supplemental information SI-1. Information gathered for each PS/PC included: process working status (in use or shut-in), PS/PC identification (make/model), motive gas type of PC pilot (NG, IA, or N/A[non-PC containing PS]), housing type (integrated, pilot-actuator), depressurization type (CPC, IPC, or no vent), actuation type (snap-acting, throttling), process function (control, safety, or both), process equipment application (separator, combustor, compressor, etc.), and sensed process variables (e.g., temperature, pressure, and liquid level). PC-specific information such as model configuration variables, retrofit status, installation date, actuator components, and supply line pressures were also documented to the extent possible. Photos of the PCs were acquired and an interview with the facility operator was conducted to help clarify information. An important aspect of the PC survey was to confirm that the exhaust port of the PC was visible during the OGI inspection so that any continuous emission through the PC pilot could be assessed. In some ONG basins, emissions from multiple PCs, in separator sheds, for example, are grouped together into a common header pipe and exhausted out of the shed making it difficult to assess individual PCs without physically decoupling the tubing. This architecture was not encountered in this study.
Special OGI emissions survey
An OGI video was collected for each working NG-driven PC system using a FLIR GF320 (FLIR Inc., North Billerica, MA, USA). This OGI camera is widely used as a hydrocarbon leak detection technology at ONG production facilities. It is known that many factors including leak size, observation distance, difference between emitted gas and background temperature (ΔT), gas dispersion effects (e.g., wind speed) and operator skill/diligence, affect each OGI camera observation (Concawe Citation2017; Ravikumar et al., Citation2018; U.S. EPA Citation2015; Zeng and Morris Citation2019; Zeng et al. Citation2017). Together these method factors determine the ability of a camera operator to successfully detect a specific leak/emission of a given ER in actual operating conditions. For these reasons, the detection threshold of the OGI is not a specific number but forms a continuum (a performance band). Current research suggests that close-distance OGI inspection by an experienced operator with the equipment and procedures used here should detect continuous ONG hydrocarbon emissions with relatively high confidence at emission rates >30 g/hr (about half of the 60 g/hr EPA OGI base sensitivity requirement) under typical conditions on a working well pad (Ravikumar et al., Citation2018; Zeng and Morris Citation2019). We define this as the detection threshold band upper limit for this study and equates to 1.3 scf/hr for typical ONG gas compositions related to PC operation (assumed molecular weight of 20 g/mol). Using the specific OGI protocol described, this study assumes that all continuous emissions from observed PC pilots above the detection threshold upper bound (regardless of imaging mode) are detected. As discussed subsequently, the OGI detection threshold lower bound can be well below 1.0 scf/hr under favorable conditions. Under certain conditions, such as high wind or low (ΔT), the emission detection capability of OGI can seriously degrade and approach zero (Zeng and Morris Citation2019), invalidating the stated detection threshold upper bound assumption. For inspection procedures used and conditions encountered in this study, these OGI method limitations were not believed to play a major factor.
Although not present in all OGI cameras, the FLIR GF320 has a normal or “auto” imaging mode and a high sensitivity mode (HSM), where onboard differential image processing can enhance an operator’s ability to identify lower ERs (approaching 0.5 scf/hr NG or even lower under ideal conditions). This study used both auto and HSM imaging in most cases and we explored using the difference in detection capability between these modes, (executed under the same conditions), as a rough indicator of emission level. As part of the special OGI protocol, physical observing geometries and inspection dwell times were designed to maximize both OGI detection performance and PC operation assessment information gathering value. The OGI operator in this study was experienced at ONG inspections. The OGI inspections were conducted close to the PC under observation (typically <3 m) with observation angles optimized to maximize ΔT and minimize background interferences and dispersion from the wind where possible. OGI inspections were not conducted when wind speeds exceeded 9 m/s, even if the PC was housed in a shed. The average wind speed during OGI measurements for this study was 1.8 m/s. An extended OGI observation time of 60 sec for each PC was used to enhance detection capability, to look for anomalous temporal emission profiles indicative of potential malfunctions, and also to document short time duration PC actuation events (AEs) as activity data where possible. If an AE or unusual temporal profile was observed, the observation dwell time was increased up to 120 sec to bound actuation frequency and further diagnose potential malfunction issues. All OGI videos were saved for the post-field inspection review.
The OGI survey data for each PC were classified into one of the following visual observation categories: no continuous emission (NCE), or continuous emission (CE). Additionally, temporally discrete emissions associated with a normal PC AE were also recorded. For example, for a snap-acting type IPC in the NCE category, an AE would appear as a short duration puff of gas visible in OGI with return to the NCE state. The assignment of AE was more challenging for CPCs and throttling process control applications.
PC operational state assessment by OGI observation
The operational state of each PC was determined after a review of the OGI and emissions data (if measured), along with the engineering design and process application information for the PC. provides an illustration of important OGI detection level assumptions and emission information.
Figure 2. Illustration of OGI detection threshold assumptions and important emission level demarcation points for IPCs and CPCs. The IPC designed seepage rate is assumed to be below OGI detection limit in all observing modes.
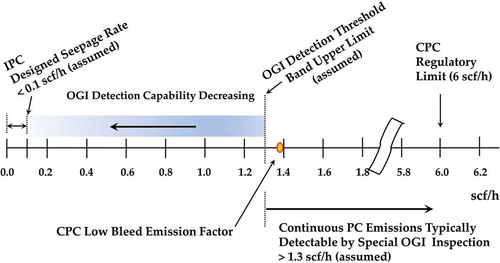
Both IPCs and CPCs exhibit CE by design. For a CPC, the CE level is determined in large part by the orifice (a designed value), with the PC actuation to control the process element representing a modulation of this level (EPA Greenhouse Gas Reporting Program EF for a low bleed CPC is 1.39 scf/hr). For an IPC, a small designed continuous seepage rate of NG is necessary to ensure proper operation (prevent metal to metal seats from seizing) (Simpson Citation2014). This IPC designed seepage rate is not reported by all PC manufacturers but is assumed here to be less than 0.1 scf/hr for well-maintained systems (Simpson Citation2014). For both IPCs and CPCs, the accumulation of dirt and debris and normal wear of parts can change the amount of CE from a PC pilot. The designed seepage rate (<0.1 scf/hr) is assumed here to be below the lower end of the OGI detection threshold band under typical conditions and is therefore not visible by IR camera. Therefore, an OGI observation of CE on a snap-acting IPC is indicative of emissions beyond the designed shut-off rate and is indicative of an MI. Issues with the production process can also cause excessive CE. Higher than designed levels of CE are classified here as MIs.
As indicated in , the observation of CE (or the documentation of NCE) had different implications regarding the determination of an MI condition for IPCs and CPCs. For a low bleed CPC, the observation of CE under OGI carried no information on the presence of a potential MI unless, in the OGI operator’s opinion, the emission appeared abnormally large. A confirming measurement of the ER of the CE, (ideally including the modulations associated with AEs), executed here by high-volume sampler (HVS), or alternatively by installed flowmeter (Allen et al. Citation2014; Luck et al. Citation2019; Thoma et al. Citation2017) or potentially viable emerging techniques like quantitative optical gas imaging (Concawe Citation2017; Zeng et al. Citation2017), would be needed to determine the ER against the low bleed CPC regulatory limit of 6 scf/hr. Conversely, if a CPC had no observable emissions under careful OGI inspection (categorized as NCE), it was considered MI-free at the time of observation, as the base bleed rate was likely well below the CPC EF of 1.39 scf/hr.
Similarly, an IPC that was categorized as NCE was designated as nominally operating as per design (no obvious MI). An IPC that was found to be in the CE OGI category was judged to be experiencing MI since the continuous ER was likely above the upper end of the designed seepage rate of 0.1 scf/hr (). An HVS emission measurement (if executed), confirmed the severity of the issue. Additionally, an IPC that was in snap-acting service and observed to be exhibiting significant prolonged/ramping emissions around AEs was defined as MI because it is not operating as designed. In these cases, HVS measurements were not used to establish emission levels because accurate measurement of these temporally variable emissions was not possible with the equipment employed. As discussed in the results section, the difference in OGI detection performance under auto and HSM imaging provided some information regarding the emission level. It is emphasized that these OGI-only MI surveys are indicative of potential issues and differ in diagnostic power compared to, for example, recent longer-term installed flowmeter studies at larger gathering facilities (Allen et al. Citation2014; Luck et al. Citation2019).
Supporting PC emission measurements
To support the OGI survey, emission measurements were conducted on a subset of PCs that were observed to be CE during the OGI survey using a commercial HVS (Bacharach, Inc., New Kensington, PA, USA). The HVS measures a snapshot ER (not including actuations) of a PC by sampling the NG emission source at a high volumetric flow rate to ensure the capture of all the NG emissions and some of the surrounding ambient air. By directly measuring the volumetric flow rate and the concentration of hydrocarbon gases, the ER of the PC can be directly calculated using eq 1. Where, ER is the NG emission rate from the source (cfm), Q is the sampling flow rate of the HVS (cfm), Leak is the gas concentration (%) measured from the component sampling stream and Background is the gas concentration (%) as measured in the surrounding ambient air.
Standard HVS measurement procedures include daily full calibration, as well as pre-measurement and post-measurement calibration checks using 2.5% and 99.9% methane calibration gases. Additional augmented quality assurance procedures included utilizing the OGI camera to ensure complete leak capture at the emission point and exhaust stream concentration checks using a hand-held probe to protect against a potential known failure mode with the HVS utilized (Thoma et al. Citation2017). In this study, the hand-held probe measurements of the exhaust stream were conducted using a portable flame ionization detector (FID) (TVA 1000B, Thermo Scientific). The FID underwent daily calibrations and multiple calibration checks using zero air, and standard 500 part per million (ppm) and 10,000 ppm methane calibration gases. Although the HVS hydrocarbon sensor and FID observed similar concentrations, the FID measured concentrations were used in combination with the HVS flowrates for calculating the PC ERs due to its faster response time and greater sensitivity. Up to six individual HVS/FID (called hereafter HVS) measurements were made for each PC assessed and the data were averaged to determine the snapshot PC continuous ER. The HVS was not used to measure the ER of short time duration IPC AEs since the device was not capable of temporally resolving these emissions. In two cases (discussed in the results section) it was determined that the HVS produced a low bias measurement, not representative of the average emissions of the PCs, due to highly variable temporal profiles as discovered in the subsequent analysis of OGI data. The method detection limit of the HVS was estimated at 0.1 scf/hr with an estimated uncertainty of ± 30%.
Results and discussion
PC survey results
A total of 31 well pads were visited over 10 field days in March, April, and May of 2018, with the results of the PC information gathering survey summarized by the first four bars of . A total of 615 process control PSs were found on the facilities with 59 of these being of the electronic variety that does not use gas-emitting PC pilots. Of the 556 PSs with gas-emitting PC pilots, 38 of these were IA-driven. Although the use of IA is believed to be a growing trend, NG was found to be the exclusive motive gas type at 30 of the 31 facilities surveyed. One facility used IA on 38 out of 52 PCs with the NG models primarily related to back pressure regulation. This facility illustrated the complexity of PC identification for both inventory and emission inspection purposes.
Figure 3. Breakdown of the PS/PC systems found on facilities (first four bars), along with a summary of OGI survey results pertaining to the primary dataset of working, NG emitting PCs (N = 453). The OGI-observed data set was 447 and includes both auto and HSM/auto observations.
Excluding the IA-driven units, the count of PCs with the potential to emit NG encountered in the study was 518. A total of 18 of these PCs (3.5%) were of the “no-vent” design where the NG-emitted from the pilot is fully captured. These integrated pilot-actuator PCs have the potential to emit NG only by diaphragm or connector leaks that would be classified as equipment leaks and therefore are not considered part of the primary analysis for this study. The survey of 31 facilities therefore found 500 NG-emitting PCs servicing 102 wells (average of 4.9 PCs/well). For the OGI survey to provide an effective assessment of a NG-driven PC’s operational state, it was important to understand if the PC was part of an operating process (e.g., not shut-in/depressurized). The survey found that 453 of the 500 NG PCs were part of a working process, forming the primary count of the PCs for the OGI assessment (N = 453).
It was critical to determine the designed depressurization type of the PC (IPC or CPC) during the on-site survey because the type assignment played a role in the assessment of potential MI conditions. The IPC or CPC assignment was accomplished by engineering analysis combined with operator technical discussion and was independent of the OGI or HVS measurement. National emissions inventories have identified a substantial increase over the last several decades in the use of IPCs compared to CPCs (U.S. EPA Citation2019a). The results of this study support that point with 377 of 453 (83.2%) of working NG PCs surveyed identified as IPCs. Further details on the classifications of PCs surveyed can be found in supplemental information SI-2.
OGI survey results – as obtained
From the primary dataset of 453 (377 IPCs and 76 CPCs) working, NG-emitting PCs, a total of 447 (371 IPCs and 76 CPCs) were observed by OGI with six IPCs not surveyed due to wind speeds exceeding the 9 m/s method limit. Additionally, 22 duplicate OGI surveys (not included in the 447 OGI surveys analyzed here) were conducted at one location on different field days and the results are discussed in SI-3. As shown in , which includes all observations without regard to OGI imaging mode utilized (auto-only and HSM/auto), a total of 42 IPCs (11.3%) and 28 CPCs (36.8%) were found to emit continuously (classified as CE under OGI). As detailed in the Effects of OGI Settings section, these percentages may be underestimated due to difference in imaging modes utilized but, they serve as a base for discussion of the “as obtained” OGI survey results.
As discussed in methods, without an ER measurement, it is unknown what portion of 36.8% of CPCs exhibiting CE are experiencing a potential MI, since they may have been operating as designed at some level near the category average EF of 1.39 scf/hr. By definitions employed, 63.6% of CPCs surveyed were NCE under OGI inspection so were classified as likely free of gross MI (nominally operating as designed). These CPCs possessed a continuous component of emissions (from the PC pilot emission port) that was below the detection limits of OGI, the upper bound of which is close to the category EF. Without knowledge of emissions over time that includes AEs, it is not possible to understand the overall emissions of the PC system. However, since the CPC is orifice-based, the component of continuous emission from the pilot would be assumed to be a significant fraction of the total, so an OGI NCE finding implies relatively low pilot emissions. Additionally, due to the extended nature of the OGI detection threshold band to values below 1.0 scf/hr, some portion of the CPCs classified as CE under OGI likely also possessed continuous component of emission below the EF, although this determination cannot be made without direct emission measurement.
For IPCs, 11.3% (42 of 371) exhibited CE, but as explained in the Effects of OGI Settings section, this number could be underestimated. Based on definitions employed, 11.3% of IPCs have continuously observable emissions by OGI which, are likely above the maximum potential designed seepage rate of 0.1 scf/hr and are therefore experiencing some level of MI. The severity of the MIs is unknown without ER measurement.
Effects of OGI settings
This OGI survey dataset (N = 447) consisted of two subgroups. Early in the study the OGI protocol was conducted using only auto imaging mode (N = 85 PCs, 9 facilities and 26 wells). Based on a low CE observation rate, the OGI protocol was adjusted to include both HSM imaging and auto mode (HSM/auto), which was used for the majority of the PC assessments (N = 362 PCs, 22 facilities, and 76 wells). summarizes the CE observation rates encountered during OGI survey.
Table 1. Summary of OGI survey operational modes results.
The CE detection rates for the auto-only and HSM/auto subgroups differed significantly. For the auto-only subgroup, 1 of 16 CPCs (6.3%) and 1 of the 69 IPCs (1.4%) exhibited CE emissions. For the HSM/auto subgroup, 27 of 60 CPCs (45%) and 41 of 302 IPCs (13.6%) exhibited CE emissions. There are three potential explanations for the these observed differences: (1) the sites surveyed with auto-only OGI at the beginning of the study had lower PC emissions (i.e. sample populations differed), (2) the meteorological conditions, ΔT, and other OGI method factors affecting OGI detection thresholds for the auto-only subgroup were less favorable, and/or (3) the HSM/auto subgroup had superior detection performance primarily due to the use of HSM imaging.
Because HSM imaging is designed to improve detection performance for most applications, it is likely the dominant factor contributing to this detection rate difference between the subgroups. Since both HSM and auto mode were used as part of the HSM/auto surveys and were executed under the same conditions, paired comparisons of detections within this subgroup were possible. For observations of CPCs in the HSM/auto subgroup, 27 CE detections were found in HSM with 13 of these also detectable in auto mode. The HSM detection count was a factor of 2.1 times higher than auto mode for CPCs. For IPCs in the HSM/auto subgroup, 41 CE detections were found in HSM with 26 visible in auto mode yielding a HSM detection factor 1.6 times higher than the auto mode. These findings demonstrate an emissions detectability advantage for HSM over auto mode.
Due to the differences in HSM and auto mode sensitivity, it is likely the case that the auto-only subset had a significantly underestimated detection rate (affecting 20% of all data) compared to the HSM/auto subset. As a lower bound estimate of the significance of this effect, the HSM to auto mode detection factors of 2.1 and 1.6 can be applied to the as discovered CE emissions for the auto-only subset yielding an estimated value of 2 detections for both IPCs and CPCs (as opposed to 1 each). Ignoring potential PC population differences between the subsets, an upper bond estimate of the effect can be found by applying the CE detection rates from the HSM/auto subset (45% for CPCs and 13.6% for IPCs) to the auto-only subset. This approach increases projected detection for the auto-only subset to 7 for CPCs and 9 for IPCs. The adjusted IPC study-wide detection rates for the lower and upper bound estimates are 11.6% and 13.6%, respectively, compared to the “as observed” CE detection rate of 11.3%. For CPCs, the lower and upper bound study-wide adjusted CE detection rates are 38.2% and 45.0% compared to 36.8% for the unadjusted observations.
An analysis was conducted to evaluate potential environmental and facility characteristics that could have impacted the auto mode CE detection rates between auto-only and HSM/auto OGI survey subgroups. There does not appear to significant differences in the meteorological conditions between the subgroups as shown in . Both subgroups had very similar average wind speeds and temperatures during the OGI surveys. Facility characteristics such as wells per facility and PCs per well were also similar between the two OGI survey subgroups. There were slight differences in average well age and average facility-wide normalized oil production (i.e. 2017 oil production normalized by facility inlet separator count). The average well age for auto-only OGI surveyed facilities is January 2003 compared to February 2005 for the HSM/auto subgroup. The facility-wide normalized oil production for auto-only and HSM/auto subgroups was 1696 and 2661 BBLs/separator/yr, respectively. It is expected that older wells will have lower production; however, it is not immediately clear if the differences in average well age and normalized oil production are the cause of the differences in auto mode CE detection rates.
Table 2. Summary of OGI survey facility characteristics and meteorological conditions.
Another potential contributing factor to the difference in auto mode detection rates between the subgroups was emission population differences due to operators’ PC inspection and maintenance procedures. A well maintained and regularly inspected facility would be expected to have lower CE detection rates. This potential factor could not be evaluated because inspection and maintenance records were not included in this study. Records of this nature would provide significant value in future work.
Supporting HVS emission measurements
Supporting HVS emission measurements were conducted on 18 total PCs (14 IPCs and 4 CPCs) with CE detected during the OGI survey. In general, the measurements were conducted on PCs that appeared to have the most significant OGI gas signature, as determined by the OGI operator, thus we believe that we focused on the largest emitting PCs within the population.
The measured snapshot ERs (not including actuations) for the four low bleed CPCs ranged from 0.7 to 9.9 scf/hr (: blue bars) with an average ER of 4.2 scf/hr. These four measurements came from three different CPC make and models including: Fisher 4660 (2 PCs), Fisher DVC 6200, and Wellmark 6900 Cantilever. Three of the CPCs exhibited ERs above EF of 1.39 scf/hr (: gray bars), with one considered a serious MI (malfunctioning PC or process as it exceeded the State regulatory PC emission limit of 6 scf/hr at 9.9 scf/hr). Two of the measured CPCs had measured emissions above 1.39 scf/hr and below 6 scf/hr.
Figure 4. HVS measured IPC (gray bars) and CPC (blue bars) ERs. The detection limit of the technique is 0.1 scf/hr and IPCs 13 and 14 do not represent accurate measurements due to variable emission from the IPCs.
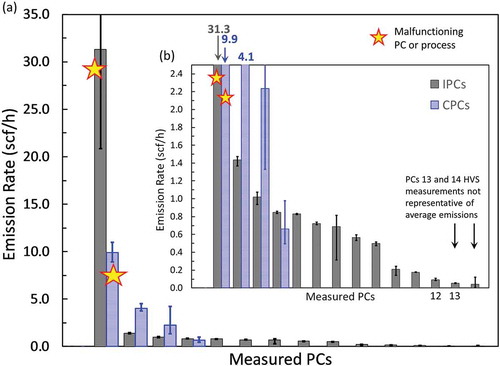
Snapshot HVS measurements were conducted on 14 IPC systems that were observed under OGI to exhibit CE (). Three of the measurements were near or below the estimated method detection limit of the technique at (0.1 scf/hr), so are approximate. In two of the cases indicated in (PCs 13 and 14), the snapshot HVS measurement was believed to be conducted when the emissions from the PCs were low, so the values are not representative of average emissions. In these two cases, the IPCs were cycling between actuations with the OGI video showing steadily increasing emissions prior to actuating, followed by a sharp drop in emissions below the OGI detection threshold. These significantly variable (heavy ramping and temporally sustained) emissions were observed by the OGI survey, so these snap-acting IPCs were categorized as experiencing MI events though there were time periods (as evidenced by HVS) where the CE was likely below the designed 0.1 scf/hr seepage rate MI threshold. These may be similar to some recent PC/process malfunction examples found at gathering stations (Luck et al. Citation2019).
The highest measured IPC ER (31.3 scf/hr) was from a serious malfunction and was more than 20 times larger than the second-highest IPC measurement. In fact, the sum of all 13 other IPC measurements only accounted for 7.3 scf/hr, compared to the highest emitter at 31.3 scf/hr. This high-emitting IPC was used to manage back pressure on the low-pressure side of a high-low pressure separator. The operator described the situation as a process control issue where a bleeding valve upstream of the low-pressure vessel was causing the Kimray 212 SGT-BP to continuously actuate because the low-pressure vessel was continually exceeding the pressure set point of the PC. In this situation, the IPC unit itself was not malfunctioning, as the excessive emissions were caused by a process issue.
Actuation events
The total emissions produced by a PC and actuator represent a combination of CE and emissions during AEs. When a PC effects a process change during an AE, a typically short duration increase in emissions from the pilot and actuator occurs as the component body volumes (diaphragms/bonnets), and supply lines are cleared of NG to provide the motive force for process change (e.g., to open a valve). The increase in emissions caused by AEs can be, in some cases, identified by OGI and the emissions produced by these events can contribute significantly to the average PC ER.
Quantifying AE relative importance on the PC population’s average ER requires knowledge of both AE emission volume and frequency of occurrence. The frequency of AEs depends on the PC process function (e.g., safety or control), process design, and facility production rate. Typically, PCs that are used for safety functions actuate very infrequently compared to process controlling PCs at high producing facilities. For normally functioning PCs, actuation volumes are dependent on several factors including supply gas pressure, PC pilot geometries, tubing length, and primary service (i.e. throttling vs. snap acting). Although measurements required to quantify actuation volumes were outside the scope of this study, the OGI survey provided information on the frequency of occurrence for actuations. The following discussion focuses on IPCs and CPCs with NCE where the observation of an AE against an NCE background is more readily discernable.
Using the base one-minute duration OGI PC observation protocol, that was extended up to 2 min on AE detection, a total of 33 AEs were observed from 22 different PCs (N = 447). Assuming all AEs were above OGI detection threshold, and accounting for the random start time of each OGI observation, likely only a few percent of IPCs in this basin have actuation frequencies > 1/min, with many PCs (e.g., safety category) very infrequently actuating. Using the engineering estimated actuation volumes for similar make and model PCs from Thoma et al. (Citation2017), actuation volumes ranged from 0.005 to 0.185 scf per AE. This indicates that potential emissions from CE due to MI can be the dominant factor in overall ERs for infrequently actuating PC populations.
shows the distribution of actuations observed per facility ranked by facility-wide 2017 oil production normalized by facility inlet separator count (i.e. “normalized oil production”). AEs were observed at only 9 of 31 facilities with the top two highest oil producing facilities accounting for 54.5% (12 of 22) of the PCs with actuations. The highest producing facilities had five separate IPCs exhibiting AEs with a total of 13 observed, whereas the second-highest producing facilities had 7 PCs and 8 total AEs. There were a total of six PCs surveyed that had multiple actuations observed during the OGI survey (extended up to 2 min). Three of those PCs were located at the highest producing facility, and one PC with multiple actuations was located at the second, fifth, and sixteenth highest producers.
Figure 5. (a) Comparison of PC actuations per facility ranked by production (black bars) to facility oil production normalized by inlet separator count (dashed gray line). (b) Comparison of facility MI rates (black bars) to facility oil production normalized by separator count (dashed gray line).
The OGI survey indicates an expected relationship between normalized oil production and OGI-observed actuations. At a high producing facility, the same PC and process will require more actuations than at a lower producing facility. However, PCs with MI don’t show the same correlation with facility production. shows the percentage of PCs at each facility that were identified as MI compared to normalized oil production, with little correlation evident. At lower producing facilities, the CE component of emissions for IPCs with MIs becomes a more significant factor effecting average PC emissions rates for lower producing facilities.
Summary and conclusion
In the spring of 2018, a 10-day field study was conducted on 31 upstream ONG well pads operated by seven different companies in Colorado’s DJ Basin to improve information on the PC populations. The facilities were typical of the DJ Basin and the operators were not privileged to the survey locations prior to the visit to ensure conditions representative of normal operations. Although the findings of this study are representative of the DJ Basin, they are not intended to be representative of PC operating characteristics at a national level and therefore should be used with caution at that scale. The study found 556 gas-driven PC pilots, 38 of which used IA and 18 of which were of the “no vent” design, for total of 500 NG-emitting PCs servicing 102 wells (4.9 PCs/well). The observed PCs per well are reasonably consistent with the 2018 data from EPA’s Greenhouse Gas Reporting Program for the Denver Basin with an average of 3.1 PCs per well and is significantly higher than the national average of 1.6 PCs per well (U.S. EPA Citation2019c). Additionally, Allen et al. (Citation2014) found 91% of the PCs in the Rocky Mountain region to be IPCs. The work conducted exclusively in the DJ Basin found consistent results with 83% of the PCs surveyed as IPCs.
The use of an OGI-based emissions survey was evaluated and found to be an approach that could help inform PC maintenance states. OGI inspections were performed on 447 working PCs with an “as observed” CE detection rate of 11.3% for IPCs. Factoring in the effects of OGI settings an adjusted IPC CE detection rate was estimated to range between 11.6% and 13.7%. These IPCs were classified as experiencing some level of MI since the CE was likely above the designed seepage rate. One IPC exhibited a high HVS-measured ER of 31.3 scf/hr; however, this was not caused by a malfunction in the controller itself but instead by a process issue. For CPCs, the “as observed” CE detection rate was 36.8% and the adjusted CE detection rate, factoring in the effects of OGI settings, was estimated to range between 38.2% and 46.0%. As opposed to IPCs, it is unknown what portion of CPCs were experiencing a potential MI, without measurement. The supporting HVS emissions measurements identified one CPC that was classified as malfunctioning, with measured ER of 9.9 scf/hr, above the 6.0 scf/hr State regulatory limit for the DJ Basin. The observation of NCE, using the described OGI protocol, for the majority of CPCs is an indication that the continuous component of emission in these systems is likely below the EF of 1.39 scf/hr, and therefore clear of gross MI at the time of observation.
The type of imaging mode (i.e. Auto vs HSM) utilized during the OGI survey was observed to significantly affect the detection rate of CE. The detection rate of CE using HSM occurred at rates 1.6 and 2.1 times more than auto-mode imaging for IPCs and CPCs, respectively. The difference between observation capability in HSM and auto modes could be used in an inspection approach to approximately separate the PC populations (e.g., minor MI and significant malfunctions), so that repairs can be prioritized to minimize unnecessary emissions. As an example, an OGI inspection of an IPC starts with HSM imaging and if no CE is observed the IPC is likely optimized with regard to excessive seepage. If CE is observed in HSM and not auto mode it is potentially a relatively minor MI. If CE from an IPC is robustly observed in auto mode further increases confidence that the CE is above the designed seepage rate and can be documented and prioritized for repair. However, additional research needs to be done to quantify the difference in detectability of HSM vs auto mode imaging. Ultimately, emerging tools like quantitative optical gas imaging (Concawe Citation2017; Zeng et al. Citation2017) may assist in understanding the severity of MIs for both IPCs and CPCs.
Utilizing the OGI surveys, it was demonstrated that PC actuations from process control-based PCs correlate with facility production. Facilities with lower production will have lower AE rates among its PC population increasing the importance of CE from PCs with MIs on determining the average operational PC ER. For higher producing facilities that cause PCs to actuate much more frequently, actuations will be a significant contributor to the overall average operational PC ER. Additional research on PC actuation frequency and emission volumes needs to be conducted to quantify these events such that their importance relative to continuous bleed rates and malfunction ERs can be determined.
Disclaimer
This document has been reviewed in accordance with U.S. Environmental Protection Agency policy and approved for publication. Any mention of trade names, manufacturers or products does not imply an endorsement by the United States Government or the U.S. Environmental Protection Agency.
Supplemental Material
Download PDF (340.9 KB)Supplemental Material
Download PDF (1.5 MB)Acknowledgment
The authors want to acknowledge the time and efforts of the cooperating oil and gas operators throughout this study. The authors thank Colorado Department of Public Health and the Environment’s (CDPHE) Mark McMillan and Sean Hackett for their helpful discussions and outreach to operators and Colorado Oil and Gas Conservation Commission. A special thanks to U.S. EPA’s Adam Eisele and Jason Dewees for their helpful discussions and review of this project. Funding for this effort was provided by CDPHE and U.S. EPA Region 8.
Disclosure statement
No potential conflict of interest was reported by the authors.
Supplementary material
Supplementary data for this article can be accessed on the publisher’s website.
Additional information
Notes on contributors
Michael Stovern
Michael Stovern is a physical scientist with the U.S. Environmental Protection Agency, Region 8 located in Denver, CO, USA. Michael can be contacted at [email protected].
Jeramy Murray
Jeramy Murray is an environmental protection specialist with Colorado Department of Public Health and Environment located in Denver, CO, USA
Colin Schwartz
Colin Schwartz is a physical scientist with the U.S. Environmental Protection Agency, Region 8 located in Denver, CO, USA.
Cindy Beeler
Cindy Beeler is a physical scientist with the U.S. Environmental Protection Agency, Region 8 located in Denver, CO, USA.
Eben D. Thoma
Eben D. Thoma is a physical scientist with the U.S. Environmental Protection Agency, Office of Research and Development, Center for Environmental Measurement and Modeling located in Durham, NC, USA.
References
- Allen, D. T., A. P. Pacsi, D. W. Sullivan, D. Zavala-Araiza, M. Harrison, K. Keen, M. P. Fraser, A. D. Hill, R. F. Sawyer, and J. H. Seinfeld. 2014. CH4 emissions from process equipment at natural gas production sites in the United States: Pneumatic controllers. Environ. Sci. Technol. 49 (1):633–40. doi:10.1021/es5040156.
- Concawe. 2017. An evaluation of an optical gas imaging system for the quantification of fugitive hydrocarbon emissions. Report no 2/15. Accessed July 23, 2019. https://www.concawe.eu/publication/an-evaluation-of-an-optical-gas-imaging-system-for-the-quantification-of-fugitive-hydrocarbon-emissions-report-no-217/.
- Luck, B., D. Zimmerle, T. Vaughn, T. Lauderdale, K. Keen, M. Harrison, A. J. Marchese, L. L. Williams, and D. T. Allen. 2019. Multi-day measurements of pneumatic controller emissions reveal frequency of abnormal emissions behavior at natural gas gathering stations. Environ. Sci. Technol. Letters 6:348–52. doi:10.1021/acs.estlett.9b00158.
- Ravikumar, A. P., J. Wang, M. McGuire, C. S. Bell, D. Zimmerle, and A. R. Brandt. 2018. “Good versus good enough?” Empirical tests of methane leak detection sensitivity of a commercial infrared camera. Environ. Sci. Technol. 52 (4):2368–74. doi:10.1021/acs.est.7b04945.
- Simpson, D. 2014. Pneumatic controllers in upstream oil and gas. Oil Gas Facil. 3(5):83–96. Accessed July 24, 2019. doi:10.2118/172505-PA.
- Thoma, E. D., P. Deshmukh, R. Logan, M. Stovern, C. Dresser, and H. L. Brantley. 2017. Assessment of uinta basin oil and natural gas well pad pneumatic controller emissions. J. Environ. Prot. 8:394. doi:10.4236/jep.2017.84029. 10.4236/jep.2017.812088 (Erratum).
- U.S. EPA. 2015. Technical support document: Optical gas imaging protocol, 40 CFR part 60, Appendix K, EPA-HQ-OAR-2010-0505-4949. Accessed July 23, 2019. https://www.regulations.gov/document?D=EPA-HQ-OAR-2010-0505-4949
- U.S. EPA. 2016. Inventory of U.S. greenhouse gas emissions and sinks: 1990–2014. EPA Report 430-R-16-002, Washington, D.C., Accessed July 23, 2019. https://www.epa.gov/sites/production/files/2016-04/documents/us-ghg-inventory-2016-main-text.pdf.
- U.S. EPA. 2018. 2011–2017 Greenhouse gas reporting program industrial profile: Petroleum and natural gas systems (October 2018). Accessed July 23, 2019. https://www.epa.gov/sites/production/files/2018-10/documents/subpart_w_2017_industrial_profile.pdf.
- U.S. EPA. 2019a. Natural gas and petroleum systems in the GHG inventory: Additional information on the 1990–2017 GHG inventory (published April 2019); Annex 3.5 and 3.6: Methodology for estimating CH4, CO2, and N2O emissions from petroleum systems and natural gas systems respectively. Accessed July 23, 2019. https://www.epa.gov/ghgemissions/natural-gas-and-petroleum-systems-ghg-inventory-additional-information-1990-2017-ghg.
- U.S. EPA. 2019b. Basic information of air emissions factors and quantification. Accessed July 23, 2019. https://www.epa.gov/air-emissions-factors-and-quantification/basic-information-air-emissions-factors-and-quantification
- U.S. EPA. 2019c. Envirofacts GHG customized search for reporting year 2018 data. Accessed November 19, 2019. https://www.epa.gov/enviro/greenhouse-gas-customized-search.
- Zeng, Y., J. Morris, A. Sanders, S. Mutyala, and C. Zeng. 2017. Methods to determine response factors for infrared gas imagers used as quantitative measurement devices. J. Air Waste Manage. Assoc. 67 (11):1180–91. doi:10.1080/10962247.2016.1244130.
- Zeng, Y., and J. Morris. 2019. Detection limits of optical gas imagers as a function of temperature differential and distance. J. Air Waste Manage. Assoc. 69 (3):351–61. doi:10.1080/10962247.2018.1540366.
Acronym glossary
| AE | = | – Actuation Event |
| CDPHE | = | – Colorado Department of Public Health and the Environment |
| CE | = | – Continuous Emission |
| CPC | = | – Continuous Pneumatic Controller |
| DJ | = | – Denver-Julesburg |
| EF | = | – Emission Factor |
| EPA | = | – Environmental Protection Agency |
| ER | = | – Emission Rate |
| FID | = | – Flame Ionization Detector |
| HSM | = | – High Sensitivity Mode |
| HVS | = | – High Volume Sampler |
| IA | = | – Instrument Air |
| IPC | = | – Intermittent Pneumatic Controller |
| MI | = | – Maintenance Issue |
| NCE | = | – No Continuous Emission |
| NG | = | – Natural Gas |
| OGI | = | – Optical Gas Imaging |
| ONG | = | – Oil and Natural Gas |
| PC | = | – Pneumatic Controller |
| PS | = | – Pneumatic System |