
ABSTRACT
Ultrafine particles (UFPs) pose a human health risk as they can penetrate deep into the respiratory system. The Harvard supersite in Boston, MA provides one of the longest time series of UFP concentrations. This study examined the hypothesis that long-term reductions in PM2.5 mass and sulfur have influenced UFP trends by limiting the ability of UFPs to coagulate onto the accumulation mode via polydisperse coagulation with larger particles. The study used Generalized Additive Models (GAMs) to assess whether changes in PM2.5 mass and sulfur concentrations resulted in smaller than expected (assuming no change in PM2.5 mass or sulfur) decreases in daily UFP trends over the 20-year period from 1999 to 2018. The impact of PM2.5 mass and sulfur changes were represented as UFP penalties. Bootstrapping was applied to calculate standard errors for the different trend and penalty estimates. Results showed that PM2.5 mass and sulfur concentrations declined significantly over the study period. The analysis found an estimated 7.3% (95% CI: 3.5, 11.1%) UFP penalty due to long-term PM2.5 mass trends, and a 9.9% (95% CI: 6.2, 13.7%) UFP penalty due to long-term sulfur trends. Findings from this study suggest that future UFP control efforts should account for the role of PM2.5 mass and sulfur changes.
Implications
Using one of the longest available time series of UFP concentrations (1999 to 2018), this study examined the hypothesis that long-term trends of PM2.5 mass and sulfur concentrations have an impact on UFP trends. We found that PM2.5 mass and sulfur reductions had a small but significant impact, i.e., penalty, on UFP trends. Improved understanding of the impact of PM2.5 mass and sulfur concentrations on UFP trends can inform future air quality control efforts.
Introduction
Epidemiological studies have established an association between particle pollution exposure and adverse respiratory and cardiovascular outcomes (Baldauf et al. Citation2016; HEI Citation2013). Ultrafine particles (UFPs), less than 100 nm in diameter, represent the smallest size fraction on the particle continuum. Early animal and in vitro evidence led to the hypothesis that UFPs have greater toxicity than larger particles due to their ability to: a) penetrate deep into the respiratory system; and b) provide a large surface area for transmitting toxics (HEI Citation2013). Recent studies have suggested evidence of short-term respiratory and cardiovascular effects attributable to UFPs (Baldauf et al. Citation2016). Large cohort studies in the Boston area have demonstrated links between exposure to traffic-related particles such as UFPs and multiple cardiovascular effects including impacts on cardiac autonomic function, increased systemic cytokine-mediated inflammation and pro-thrombotic activity, and increased risk of hypertension and ischemic stroke (Jhun et al. Citation2019).
Historically, UFPs have been challenging to study for a variety of reasons. First, they are not routinely monitored in most locations. Second, relative to larger particles, UFPs tend to have more varied number, size and spatial distribution. This variability may be due to factors such as wind speed and direction, seasonality, and boundary layer height (Kumar et al. Citation2014). Finally, UFPs have negligible mass. Therefore, they contribute little to fine particulate matter (PM2.5) mass. Instead, they are the main contributors to Particle Number (PN). PN concentrations indicate the number of particles per unit volume of air and act as a proxy for UFPs (HEI Citation2013).
UFPs are emitted by combustion sources such as traffic-related emissions, industrial activities, waste incineration, biomass burning and home heating via natural gas, as well as non-combustion sources (Masiol et al. Citation2018, Massachusetts Government Citation2020). They are also formed by nucleation. One of the UFP removal mechanisms is polydisperse coagulation with larger particles, especially those present in the accumulation mode. The difference in particle sizes in polydisperse coagulation allows for faster coagulation, even at relatively low concentrations (Hinds Citation1999). A higher concentration of accumulation mode particles creates a larger condensation sink for precursor vapors of particle formation and hinders nucleation (McMurry and Friedlander Citation1979). The result is less UFP formation and lower UFP concentrations (Wu et al. Citation2007). Regional nucleation events have also been documented in U.S. cities when PM2.5 mass is low (Baldauf et al. Citation2016). Other studies have applied modeling approaches to data in Europe and the eastern U.S. to identify an inverse association between the accumulation mode and UFPs. Specifically, they have found that a decrease in PM2.5 mass can lead to an increase in UFPs through: 1) slower polydisperse coagulation of PM2.5 mass and UFPs and 2) accelerated nucleation (Gaydos, Stanier, and Pandis Citation2018; Patoulias et al. Citation2018). Our study adds to this body of work by utilizing long-term monitoring data. Therefore, due to the tendency toward polydisperse coagulation, it is expected that UFP levels depend on the concentrations of PM2.5 mass and sulfur (S), which are mostly present in the accumulation mode. As a result, the effectiveness of UFP control strategies depends on changes in PM2.5 mass and S. This study aimed to improve understanding of the relationship between PM2.5 mass, S, and UFPs, given the relevance to potential air quality control efforts in the future. Both PM2.5 mass and S concentrations have declined significantly over the past several decades due to national and regional regulatory changes such as the National Ambient Air Quality Standards, power plant controls, and low S fuel requirements (Hand et al. Citation2012; Jhun et al. Citation2013). Others have suggested that the relationship between PM2.5 mass and UFP concentrations is complex, and that regulations targeting PM2.5 control do not necessarily translate to UFP reductions (de Jesus et al. Citation2019). We hypothesized that reductions in PM2.5 mass and S concentrations may have impacted UFP levels, resulting in the unintended consequence of a smaller than expected decline in UFP concentrations over the 20-year study period from 1999 to 2018.
Materials and Methods
Data collection
Daily concentrations of UFPs, PM2.5 mass, and S were estimated using measurements conducted at the Harvard-EPA Clean Air Research Center monitoring site (Harvard supersite), located atop the Countway Library of Harvard Medical School near downtown Boston, from October 1999 through October 2018. The Harvard supersite is uniquely positioned to study UFPs as it provides one of the longest time series with data available as early as 1999. PN concentrations as a surrogate of UFP were measured continuously using a Condensation Particle Counter (CPC Model 3022A, TSI Incorporated, St. Paul, MN). This was averaged over the daily PM2.5 collection hours for further analysis. Daily integrated PM2.5 mass samples were conducted using Harvard Impactor samplers (Kang, Koutrakis, and Suh Citation2010). PM2.5 mass and S levels were measured using gravimetric analysis and Energy Dispersive X-Ray Fluorescence (EDXRF, Model Epsilon 5, PANalytical, The Netherlands) spectroscopy (Kang et al. Citation2014; Kang, Koutrakis, and Suh Citation2010; Masri, Kang, and Koutrakis Citation2015). Relative humidity and wind speed data were measured at the Logan International Airport weather station. In addition, boundary layer height data were obtained from the NOAA Eta Data Assimilation System (EDAS). All analyses were conducted at the Harvard School of Public Health.
Regression analysis
Long-term daily trends for UFPs were assessed by fitting Generalized Additive Models (GAMs) to log-transformed daily concentrations using R 3.5.1 software. GAMs have been used in other pollutant trend analyses as they offer flexibility that is not possible in a linear regression model. GAMs do not impose any assumptions on the shape or nature of the relationship between predictors such as weather variables and outcome (Dominici et al. Citation2002). We applied GAMs to accommodate non-parametric relationships between some of the predictors and the outcome through the application of smoothing splines. We estimated the impacts of PM2.5 mass and S changes on UFP concentrations from 1999 to 2018. The analytical steps included: 1) calculating central estimates, and; 2) conducting bootstrap analysis to calculate standard errors (Requia et al. Citation2019; Jhun et al. Citation2015).
Central estimates
In step 1 (central estimates), we utilized two models to estimate long-term UFP trends. EquationEquation (1)(1) was used for the unadjusted model, which did not include either PM2.5 mass or S. EquationEquation (2)
(2) shows the adjusted model, which included PM2.5 mass or S.
and
are the regression intercepts for the adjusted and unadjusted models, respectively.
and
are the coefficients for pollutant-adjusted and unadjusted trends (percent change in UFPs per day). Models included two types of time variables: daily (
and categorical (
. Adjustment for categorical time accounted for baseline shifts in data collection at the Harvard supersite over the study period. Four distinct time periods were defined based on breakpoints identified by the “segmented” package in R: 1) October 1999-June 2009; 2) June 2009-February 2014; 3) February 2014-October 2015; and 4) October 2015-October 2018. The baseline shifts are believed to be related to economic activity and are discussed in more detail in the Results and Discussion sections.
Models also controlled for month and weekday. Month accounts for expected seasonal variations in UFP concentrations, with January as the reference month. Weekday controls for differences in workday versus weekend pollutant concentrations, given that traffic conditions and associated motor vehicle emissions are often worse on weekdays. Sunday was the reference day of the week. Finally, models incorporated several weather-related covariates known to influence particle concentrations, namely, wind speed (, relative humidity (
, and planetary boundary layer (
height. s() represents the smoothing spline function to characterize non-parametric relationships between certain predictors (wind speed, relative humidity, boundary layer height, PM2.5, and S) and daily UFP concentrations. These were estimated using the MGCV package’s GAM function, which uses Generalized Cross Validation (GCV) as the default method for choosing the smoothing parameters.
To estimate the daily impact of the past PM2.5 mass and S-related changes on UFP trends (“UFP penalty”), we calculated the difference between the daily time coefficient in the unadjusted model, , and the daily time coefficient in the adjusted model,
, as shown in EquationEquation (3)
(3) .
The PM2.5 mass or S impact on UFP concentrations is captured by the daily time coefficient () in the unadjusted model. After adjusting for PM2.5 mass or S in model (2), we are left with trends that assume PM2.5 mass or S remained constant during the study period. This is not the case for the unadjusted model (1), where the impact of PM2.5 or S is incorporated into
(Jhun et al. Citation2015). Therefore, the difference between the unadjusted and adjusted trends
represents the daily impact of the long-term PM2.5 mass or S changes, respectively. A positive penalty indicates changes in PM2.5 mass or S led to UFP increases. In contrast, negative penalties point out that PM2.5 mass or S led to UFP decreases. (Jhun et al. Citation2015). Since UFP concentration is on the log scale, the penalties can be interpreted as percent daily changes after multiplying by 100 as shown in EquationEquarion (3
(3) ). For ease of interpretation since we were using daily time variables, the estimated daily percent penalties were transformed into: a) annual penalties by multiplying by 365 days; and b) penalties over the 20-year study period by multiplying by the number of days in the study period (6,959).
Bootstrap analysis and standard error
In step 2 (bootstrap analysis), bootstrapping was used to estimate standard errors for the UFP penalties. The bootstrap was based on 100 randomized subsets (pseudo-datasets), which accounted for serial correlation structures among the UFP observations (Jhun et al. Citation2015; Requia et al. Citation2019). The adjusted and unadjusted regression models were applied for each pseudo-dataset and the penalty was estimated. Using the standard deviations from the 100 pseudo-datasets, standard errors were estimated for the daily-unadjusted trend, adjusted trend and penalty. Corresponding standard error estimates were calculated for the annual and study period trends and penalties by multiplying by 365 days and 6,959 days, respectively.
Sensitivity analysis was conducted to assess whether the model was robust to the exclusion of the categorical time variables. The same bootstrapping analysis methods described above were applied to estimate the standard errors for the penalties.
Results
Ultrafine concentration trends, 1999-2018
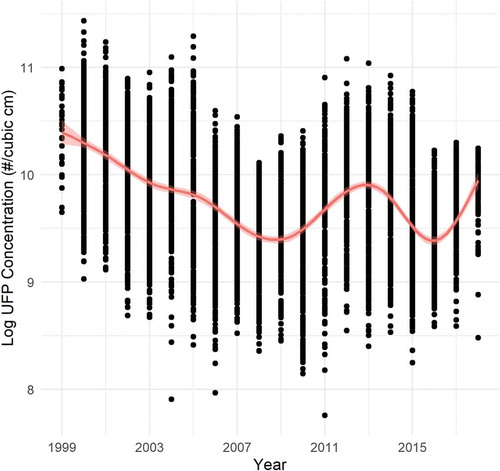
presents a time series of the log of the UFP concentrations (number cm−3), which demonstrated a general decline over the study period. However, patterns were observed in the data due to changing baselines in data collection at the supersite. Time was accordingly categorized into four distinct periods as described in the Methods section with jumps likely attributable to recovery-related activity following the economic recession, and local construction in the Longwood medical area in 2015.
Figure 1. Time series of log UFP, 1999–2018.
PM2.5 mass and S concentration trends, 1999-2018
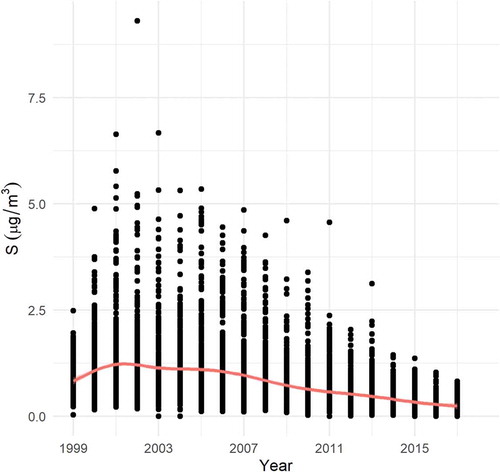
As expected, PM2.5 mass and S concentrations in Boston both demonstrated a significant decline over the study period because of air pollution regulations ( and ). Applying a linear trend line, PM2.5 mass declined at an average rate of 0.38 μg m−3 annually (3.7%). Over the study period, average PM2.5 mass declined by an estimated 7.57 μg m−3. Applying a linear trend line, S declined at an average rate of 0.06 μg m−3 annually (6.9%). Over the study period, average S concentrations declined by an estimated 1.10 μg m−3.
Figure 2. Time series of PM2.5 mass, 1999–2018.
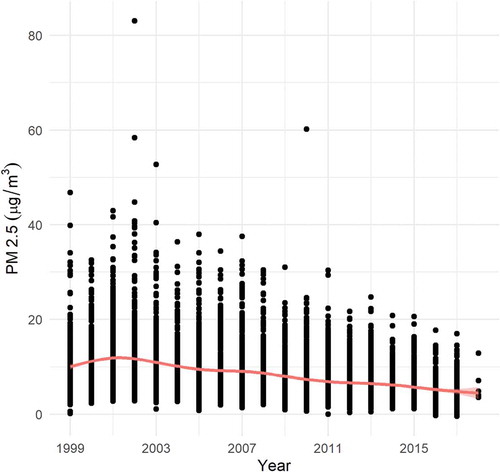
Figure 3. Time series of S, 1999–2018.
UFP penalties due to PM2.5 mass and S
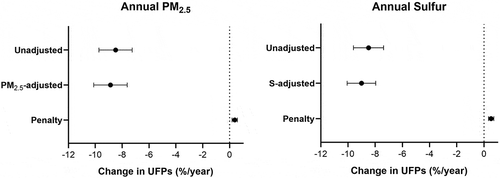
The best fitting unadjusted model for changes in UFP concentrations had an R2 of 0.64. The time and weather covariates were statistically significant predictors at the 0.01 alpha level. depicts the estimated annual UFP penalties associated with PM2.5 and S reductions. Study period penalties were calculated over the 6,959 sample observations. All penalties were positive, indicating that there was an effect where changes in PM2.5 mass or S led to UFP increases. If PM2.5 mass levels had not changed, UFP concentrations would have declined by an additional 0.4% (95% CI: 0.2%, 0.6%) per year, or 7.3% (95% CI: 3.5%, 11.1%) over the 20-year study period. A slightly steeper UFP penalty was observed for S. In the absence of changes in S levels, there would have been an additional 0.5% (95% CI: 0.3%, 0.7%) annual reduction in UFP concentrations, adding up to an additional 9.9% (95% CI: 6.2%, 13.7%) reduction over the study period.
Figure 4. Estimated Annual UFP Penalties Due to PM2.5 Mass and S Trends.
Sensitivity analysis
Overall, the penalty results were robust to the removal of the date categories. As shown in , the estimated UFP penalties due to PM2.5 mass and S were in the same direction and of similar magnitude to those obtained in the full model with the categorical date variables included. The confidence intervals for the estimated penalties were overlapping for PM2.5 mass. The study period penalty due to PM2.5 mass in the full model was 7.3% (95% CI: 3.5%, 11.1%), compared to 9.7% (95% CI: 7.4%, 11.9%) in the model without categorical time. The study period penalty due to S in the full model was 9.9% (95% CI: 6.2%, 13.7%), compared to 17.4% (95% CI: 14.9%, 19.9%) in the model without categorical time.
Table 1. Comparison of estimated annual and study period UFP penalties in full model vs. model without date categories.
Discussion
This study aimed to evaluate the long-term trends in PM2.5 mass, S and UFP concentrations in the Boston area from 1999 to 2018, and to test the hypothesis that PM2.5 mass and S concentration decreases had a significant impact on UFP concentrations. To accomplish this, unadjusted and adjusted GAM regression models were built and compared to estimate UFP penalties associated with PM2.5 mass and S changes, respectively. Subsequently, bootstrapping methods were applied to estimate standard errors. This section first addresses the long-term concentration trends, then the estimated penalties, and finally the sensitivity analysis and study limitations.
Overall, this study identified significant long-term reductions in PM2.5 mass and S concentrations in the Boston area from 1999 to 2018. This result is consistent with national level policy changes aimed at air pollution control. The United States has seen substantial declines in S emissions due to acid rain regulations and emissions standards for on-road vehicles (Masiol et al. Citation2018). The highway diesel fuel S program has resulted in a national transition from low S diesel (LSD) to ultra-low sulfur diesel (ULSD) fuel starting in 2006 (Wang et al. Citation2011). Diesel fuel regulations also affect particle emissions, as diesel vehicles emit more particles per vehicle-km than those with gasoline engines (Kumar et al. Citation2014).
Furthermore, eastern Massachusetts has implemented several regulatory changes, which have lowered S and particle pollution concentrations, including bus retrofits, heating oil regulations, and a green taxi program in Boston. In 2006, the Metropolitan Boston Transportation Authority (MBTA) retrofitted or replaced its buses with lower-emission models. The MBTA introduced its first fuel cell bus into service in 2016. As of 2017, the MBTA operated more than 200 diesel-hybrid buses (MBTA Citation2019). In the state of Massachusetts, heating oil retailers were required to meet a low-S requirement effective July 1, 2014. The Massachusetts Department of Environmental Protection (DEP) limited S to 550 ppm in distillate oil (MA DEP Citation2019). Locally in the city of Boston, the Clean Air Cabs program was launched in April 2007. The program encourages the replacement of older taxis with hybrid and alternative fuel models. As of March 2009, 10% of taxis were hybrids. In 2012, the largest taxis company had 400 hybrid cars in its fleet of 500 (BPHC Citation2019).
As for consistency with other pollutant trend analyses in the region, significant decreases in PM2.5 mass, S and UFPs have been reported for New England for 2000–2008. This analysis builds on that earlier work by examining data through 2018. Though our study considered S rather than sulfate trends, we can directly compare the percentage decline. From 2000 to 2008, the PM2.5 mass concentrations decreased by 2.29 μg m−3 at an annual rate of 3.2% (Lee et al. Citation2014). We found a comparable PM2.5 mass concentration decline of 3.7% per year. S concentrations fell at an annual rate of 2.4% in New England and 6.2% across the United States (Hand et al. Citation2012; Lee et al. Citation2014). Our study indicated roughly equivalent rates of decline (6.9%).
This Boston area study employed one of the few long-running time series available for UFP data in the United States. In Rochester, NY, investigators found UFP declines of about 5% per year from 2002–2016 (Masiol et al. Citation2018). Although UFP trends are largely driven by local emissions sources, it is instructive to compare the results as there are notable parallels. Both studies found strong declines between 2005 and 2011. The Rochester study observed unexplained UFP increases in the first half of 2012. This Boston study likewise saw an uptick in mid-2011, which may be associated with renewed activity following the economic recession (i.e., prime mortgage crisis). Both studies demonstrated small upward trends between 2015 and 2016, continuing into 2018 for the Boston study. Local construction in the Longwood medical area likely contributed to the UFP increase observed at the Harvard supersite in recent years.
The unadjusted model for UFP concentration changes had an R2 of 0.64, with the time and weather covariates (month, weekday, wind speed, relative humidity, and planetary boundary layer height) all attaining statistical significance at the 0.01 alpha level. Month was used as the proxy for season in this analysis. Other studies have also noted seasonal variations in UFP trends. It is likely that higher UFP concentrations tend to occur in winter months because lower temperatures enhance UFP formation (Wang et al. Citation2011). Low wind speed and boundary layer height also play a role in raising UFP concentrations (Kumar et al. Citation2014). Based on the Harvard supersite data, we know that wind speed in Boston has decreased in recent years. Meanwhile, construction projects in the Longwood area have added to the density of high-rise buildings, while also generating UFPs. This can lead to less room for air exchange and UFP dispersion, and higher UFP concentrations (Kumar et al. Citation2014).
The penalty analysis results corroborated the study hypothesis that long-term reductions in PM2.5 mass and S concentrations led to smaller than expected declines in UFP concentrations over the 20-year study period. The results revealed small but significant penalties, specifically, an estimated 7.3% (95% CI: 3.5, 11.1%) UFP penalty due to long-term PM2.5 mass trends, and a 9.9% (95% CI: 6.2, 13.7%) UFP penalty due to long-term S trends from 1999 to 2018. This study found that UFP levels depend on the concentrations of PM2.5 mass and S, which are mostly present in the accumulation mode. This suggests that the effectiveness of UFP control strategies will depend on changes in PM2.5 mass and S.
The long-term UFP effects associated with S were stronger than the effects associated with PM2.5 mass changes. S is mostly present in the accumulation mode, whereas PM2.5 can include particles >1 μm and <0.1 μm. Therefore, not all PM2.5 is in the accumulation mode. This may explain why UFP trends are more sensitive to S changes.
Since the daily UFP data did not demonstrate a uniform trend, date categories were added to the regression models. The categories were created using the “segmented” package in R and align well with known changes in the equipment performance as well as construction activity and policy changes in the supersite area. Sensitivity analysis was conducted to ensure that the estimated penalties were not an artifact of the date categories that were created for the UFP trend data. This analysis determined that the penalty results were robust to the removal of the categorical time variables. While the full model with date categories included was a better fit, the estimated penalties were in the same direction and of similar magnitude.
This study had several limitations. First, the study relies on data from a single monitoring site. A single site may not always be representative of regional trends, and follow-up studies would be recommended to corroborate these findings. Second, while the Boston supersite provides one of the longest running time series of UFP data, some observations were missing over the 20-year study period. Approximately 11.5% of the UFP data, 10.0% of the PM2.5 mass data, and 10.3% of the S data were missing over the study period. These missing observations were dropped from the penalty and bootstrapping analyses. Third, we were limited in terms of which species we could examine for potential impact on UFP trends based on the data available over the entire 20-year study period at the supersite. For example, we did not look at the role of changing gasoline formulations and a shift in light-duty engines to gasoline direct injection (GDI), which has a sizable effect on secondary organic aerosol formation. Fourth, the weather data (relative humidity, wind speed, and boundary layer) came from nearby weather stations. The Logan International Airport weather station is approximately six miles from the Harvard supersite. Distance between the Harvard supersite and weather stations may have led to weaker correlations between the weather variables and UFP trends.
While this study was conducted in the Boston area, the study results are likely generalizable to other U.S. cities, particularly those in the Northeast region. Still, it would be helpful to explore this generalizability in future research. This study is the first to quantify UFP penalties due to PM2.5 and S changes. If UFP controls are contemplated at the local, regional or national level, it would be advisable to further improve our understanding of the UFP penalties. Given the dynamic nature of UFP trends, one way to approach this would be to investigate short-term UFP concentration changes in relation to the weather, PM2.5 and S predictors as well as construction, equipment and policy changes.
Conclusion
Long-term trends of PM2.5 mass and S concentrations demonstrated significant declines in Boston, MA over the 1999 to 2018 study period. These reductions had a small but significant impact on UFP trends. Improved understanding of the impact of PM2.5 mass and sulfur concentrations on UFP trends can inform future air quality control efforts at the local, regional and national level.
Acknowledgments
The authors thank Isabel Holland for her assistance with graphics preparation. They thank Spyros Pandis for sharing his expertise and advice regarding the behavior of accumulation mode and ultrafine particles. This publication was made possible by the US Environmental Protection Agency (grants RD 835872 and RD 834798). Its contents are solely the responsibility of the grantee and do not necessarily represent the views of the US EPA. Further, the agency does not endorse the purchase of any commercial products or services mentioned in the publication. Melissa Fiffer was supported by NIEHS training grant T32ES007069.
Disclosure statement
No potential conflict of interest was reported by the authors.
Additional information
Funding
Notes on contributors
Melissa Fiffer
Melissa Fiffer is a doctoral student in the Department of Environmental Health at the Harvard School of Public Health in Boston, MA.
Choong-Min Kang
Choong-Min Kang is a research associate in the Department of Environmental Health at the Harvard School of Public Health in Boston, MA.
Weeberb J. Requia
Weeberb J. Requia was a research associate in the Department of Environmental Health at the Harvard School of Public Health in Boston, MA. He is now an Assistant Professor at the School of Public Policy and Government, Fundação Getúlio Vargas Brasília, Distrito Federal, Brazil.
Petros Koutrakis
Petros Koutrakis is a professor of Environmental Sciences in the Department of Environmental Health at the Harvard School of Public Health in Boston, MA.
References
- Baldauf, R. W., R. B. Devlin, P. Gehr, R. Giannelli, B. Hassett-Sipple, H. Jung, G. Martini, J. McDonald, J. Sacks, K. Walker, et al. 2016. Ultrafine particle metrics and research considerations: Review of the 2015 UFP workshop. Int. J. Environ. Res. Public Health 13:1054. doi:10.3390/ijerph13111054.
- Boston Public Health Commission (BPHC). 2019. Climate change and clean air cabs. Accessed July 1, 2019. http://www.bphc.org/whatwedo/healthy-homes-environment/climate-change-clean-air-cabs/Pages/Climate-Change-Clean-Air-Cabs.aspx.
- de Jesus, A. L., M. M. Rahman, M. Mazaheri, H. Thompson, L. D. Knibbs, C. Jeong, G. Evans, W. Nei, A. Ding, L. Qiao, et al. 2019. Ultrafine particles and PM2.5 in the air of cities around the world: Are they representative of each other? Environ. Int. 129:118–35. doi:10.1016/j.envint.2019.05.021.
- Dominici, F., A. McDermott, S. L. Zeger, and J. M. Samet. 2002. On the use of generalized additive models in time-series studies of air pollution and health. Am. J. Epidemiol. 156 (3):193–203. doi:10.1093/aje/kwf062.
- Gaydos, T. M., C. O. Stanier, and S. N. Pandis. 2018. Modeling of in situ ultrafine atmospheric particle formation in the eastern United States. J. Geophys. Res. doi:10.1029/[email protected]/()2169-8996.PMSUPERST1.
- Hand, J. L., B. A. Schichtel, W. C. Malm, and M. L. Pitchford. 2012. Particulate sulfate ion concentrations and SO2 emission trends in the United States from the early 1990s through 2010. Atmos. Chem. Phys. 12:10353–65. doi:10.5194/acp-12-10353-2012.
- Health Effects Institute (HEI). 2013. Understanding the health effects of ambient ultrafine particles. Accessed May 23, 2019. https://www.healtheffects.org/publication/understanding-health-effects-ambient-ultrafine-particles.
- Hinds, W. 1999. Aerosol Technology. New York: John Wiley & Sons Inc.
- Jhun, I., B. A. Coull, J. Schwartz, B. Hubbell, and P. Koutrakis. 2015. The impact of weather changes on air quality and health in the United States in 1994-2012. Environ. Res. Lett. 10 (8):084009. doi:10.1088/1748-9326/10/8/084009.
- Jhun, I., J. Kim, B. Cho, D. Gold, J. Schwartz, B. A. Coull, A. Zanobetti, M. B. Rice, M. A. Mittleman, E. Garshick, et al. 2019. Synthesis of Harvard EPA center studies on traffic-related particulate pollution and cardiovascular outcomes in the greater Boston area. J. Air Waste Manag. Assoc. 69:900–17. doi:10.1080/10962247.2019.1596994.
- Jhun, I., P. Oyola, F. Moreno, M. A. Castillo, and P. Koutrakis. 2013. PM2.5 mass and species trends in Santiago, Chile, 1998 to 2010: The impact of fuel-related interventions and fuel sales. J. Air Waste Manag. Assoc. 63 (2):161–69. doi:10.1080/10962247.2012.742027.
- Kang, C. M., S. Achilleos, J. Lawrence, J. M. Wolfson, and P. Koutrakis. 2014. Inter-lab comparison of elemental analysis for low ambient urban PM2.5 levels. Environ. Sci. Technol. 48:12150–56. doi:10.1021/es502989j.
- Kang, C. M., P. Koutrakis, and H. H. Suh. 2010. Hourly measurements of fine particulate sulfate and carbon aerosols at the Harvard-U.S. environmental protection agency supersite in Boston. J. Air Waste Manag. Assoc. 60 (11):1327–34. doi:10.3155/1047-3289.60.11.1327.
- Kumar, P., L. Morawska, W. Birmili, P. Paasonen, M. Hu, M. Kulmala, R. M. Harrison, L. Norford, R. Britter. 2014. Ultrafine particles in cities. Environ. Int. 66:1–10. doi:10.1016/j.envint.2014.01.013.
- Lee, H. J., C. M. Kang, B. A. Coull, M. L. Bell, and P. Koutrakis. 2014. Assessment of primary and secondary ambient particle trends using satellite aerosol optical depth and ground speciation data in the New England region, United States. Environ. Res. 133 (2014):103–10. doi:10.1016/j.envres.2014.04.006.
- Masiol, M., S. Squizzato, D. C. Chalupa, M. J. Utell, D. Q. Rich, P. K. Hopke. 2018. Long-term trends in submicron particle concentrations in a metropolitan area of the northeastern United States. Sci.Total Environ. 633:59–70. doi:10.1016/j.scitotenv.2018.03.151.
- Masri, S., C. M. Kang, and P. Koutrakis. 2015. Composition and sources of fine and coarse particles collected during 2002-2010 in Boston, MA. J. Air Waste Manag. Assoc. 65 (3):287–97. doi:10.1080/10962247.2014.982307.
- Massachusetts Bay Transportation Authority (MBTA). 2019. MBTA vehicle efficiency. Accessed July 1, 2019. https://www.mbta.com/sustainability/mbta-vehicle-efficiency.
- Massachusetts Department of Environmental Protection (MA DEP). 2019. Accessed July 1, 2019. https://www.epa.gov/sites/production/files/2017-10/documents/ma-310-cmr-7-05.pdf.
- Massachusetts Government. 2020. Accessed February 19, 2020. https://www.mass.gov/service-details/how-massachusetts-households-heat-their-homes.
- McMurry, P., and S. Friedlander. 1979. New particle formation in the presence of an aerosol. Atmos. Environ. 13 (12):1635–51. (1967). doi:10.1016/0004-6981(79)90322-6.
- Patoulias, D., C. Fountoukis, I. Riipinen, A. Asmi, M. Kulmala, and S. N. Pandis. 2018. Simulation of the size-composition distribution of atmospheric nanoparticles over Europe. Atmos. Chem. Phys. Katlenburg-Lindau 18 (18):13639–54. doi:10.5194/acp-18-13639-2018.
- Requia, W. J., I. Jhun, B. A. Coull, and P. Koutrakis. 2019. Climate impact on ambient PM2.5 elemental concentration in the United States: A trend analysis over the last 30 years. Environ. Int. 131:104888. doi:10.1016/j.envint.2019.05.082.
- Wang, Y., P. K. Hopke, D. C. Chalupa, and M. J. Utell. 2011. Long-term study of urban ultrafine particles and other pollutants. Atmos. Environ. 45:7672–80. doi:10.1016/ja.atmosenv.2010.08.022.
- Wu, Z., M. Hu, S. Liu, B. Wehner, S. Bauer, A. Ma ßLing, M. Kulmala. 2007. New particle formation in Beijing, China: Statistical analysis of a 1-year dataset. J. Geophys. Res. 112:D09209. doi:10.1029/2006JD007406.