
 ?Mathematical formulae have been encoded as MathML and are displayed in this HTML version using MathJax in order to improve their display. Uncheck the box to turn MathJax off. This feature requires Javascript. Click on a formula to zoom.
ABSTRACT
Monsoon plays a determinant role in defining the air quality of many Asian countries. Filter-based 24 h ambient PM10 and PM2.5 sampling was performed by using two paralleled medium volume air samplers during pre-and post-monsoon periods. A negligible change in PM2.5 mass concentration from 45.77 to 44.46 µg/m3 compared to PM10 from 74.34 to 142.49 µg/m3 was observed after the monsoon season. The air quality index (AQI) results showed that the air quality of the city retained from good to slightly polluted in both periods, where PM2.5 remained as the main detrimental to air quality in 95% of the total days. The NOAA HYSPLIT model analysis and wind rose patterns showed air trajectories, especially in post-monsoon originated from relatively polluted areas transported higher PM10. Meteorological attributes indicated a more conducive atmospheric condition for secondary pollution in the pre-monsoon. Evidence showed post-monsoon as a more polluted period, compared to the pre-monsoon and would pose an extra 1.07 × 10⁻³ lifetime risk to the local population. Similarly, a higher level of PM10 in the post-monsoon caused 43% more premature mortality and 41% more deaths from all-cause mortality compare to the pre-monsoon period, respectively.
Implications: Pakistan is an under-developing country where pollution monitoring studies are decidedly limited. Notably, studies, concise PM2.5 and health assessment are deficient. The present study may contribute to evaluating the air quality in special events such as monsoon and can also provide scientific and technical support for subsequent air pollution research. Moreover, the results help to develop adequate prevention and pollution control strategies and offer policy suggestions for monsoon observing countries in general and in particular, in Islamabad, Pakistan. These findings provide essential arguments in favor of educating people and raising awareness about the detrimental health effects of air pollution. Improving the quality of life of people with cardiovascular and respiratory disorders requires an immediate and substantial reduction of air pollution.
Introduction
World Health Organization (WHO) reported air pollution results in 7 million deaths worldwide every year (Organization Citation2014). The International Agency for Research on Cancer (IARC) enlists PM as Group 1–human carcinogenic. Several studies have established a link between PM2.5 and PM10 exposure with respiratory and heart diseases (Herman et al. Citation2020; Mehmood et al. Citation2019) lung cancer, stork as well as ischemic heart disease (IHD) (Hadei et al. Citation2017; Hopke et al. Citation2018). Rapid urbanization, industrial growth, overpopulation, poverty, and traffic congestion have increased the susceptibility of Asian countries to PM pollution-related health risks. Forouzanfar et al. (Citation2016) reported that worldwide air pollution causes 5.8 million premature deaths annually, 60% of which take place in Asia. Having a population of 200 million of which 35% reside in urban areas (higher in Asian countries) (Raes et al. Citation2000), and the shortage of clean energy sources with an 11% growth rate of vehicles, indicates Pakistan at the highest risk of urban air pollution in this region (Pakistan Economic Survey Citation2017). Mehmood et al. (Citation2020) reported the excess of PM2.5 and PM10 bound PAHs in Islamabad attributed to 9 and 13 times higher than tolerable cancer risk level respectively. The air quality of Islamabad is being deteriorated by dusty roads and unpaved streets, heavy traffic and pollution from neighboring cities are also contributing to the total pollution budget of Islamabad (Lv et al. Citation2019; Mehmood et al. Citation2018; Shah and Shaheen Citation2010). Recently an upheaval average PM2.5 level of 177 (ranging from 123 to 202 µg/m3) was observed in 2016 by Bulbul et al. (Citation2017) also suggests elevated PM pollution in Islamabad. Despite the fact of higher PM concentration in the mega cities of Pakistan, there is limited discussion available in the literature on the health impact assessment of PM pollution (Bulbul et al. Citation2017; Gurjar et al. Citation2010; Mansha et al. Citation2012).
The potential health risk associated with PM pollution directly relates to the size and the relative concentration in ambient air (Chen et al. Citation2013). Literature reviled specific events significantly changes the regional attributes of PM pollution, such as stable atmospheric condition enhance particulate pollution in the winter; haze promotes the accumulation of particulate in the atmosphere, forest fire, deserts dust storms and firework increase PM concentration in many areas during the specific intervals of the year (Gu et al. Citation2011; Li et al. Citation2017, Citation2019b). Similarly, the monsoon also acknowledges as the main factor which plays a determinant role to shape the air quality of the countries which observe the monsoon such as India, China, and Pakistan. Generally, the monsoon season (mostly extended from 15 July to 15 August) considers as the fifth season in Pakistan (Wu, Wang, and Hsu Citation2018). The monsoon period responsible for bringing significant changes in local weather and air quality due to its distinct characteristics (Iqbal and Athar Citation2018). The highest rainfall observed during the monsoon season in Pakistan (Imran et al. Citation2014). Fundamentally, rainfall washes out the ambient PM and also influences the transboundary movements of PM in the atmosphere.
However, the aftereffects of the monsoon may elevate particulate pollution and can trigger associated human health and safety problems. Similarly, higher ambient pollution was observed in the Himalayan areas and northern Indian cities during the post-monsoon period (Tiwari et al. Citation2014). Many other studies in different parts of the world also discuss the characteristics of PM concerning the monsoon event (Hien, Bac, and Thinh Citation2004; Ramachandran Citation2005; Sulong et al. Citation2019). The comparative analysis of varying PM fractions (PM10 and PM2.5) before and after the monsoon, however, has not been assessed thus far. Moreover, up to the best of our knowledge, the monsoon event has never been evaluated for understanding the PM pollution characteristics in Pakistan. Many previous studies concluded that a short real-time ground-monitoring data is significant to better explore seasonal and diurnal patterns of PM pollution, particularly at the city scale (Li et al. Citation2019a; Scibor, Galbarczyk, and Jasienska Citation2019).
The evaluation of PM characteristics before and post-monsoon may be a promising strategy that may sum up the transboundary movement of PM pollution in such areas, e.g., Islamabad (Qadir et al. Citation2012; Rasheed et al. Citation2014).
Keeping in view the existing gaps in the literature, considering the significance of addressing the health outcomes of PM10 and PM2.5 exposure, and inferring the monsoon effects on air quality based on PM10 and PM2.5 thresholds, the present study was carried out with the following objectives, (1) to evaluate the monsoon role in regulating PM characteristics, a fractional distribution health risk; (2) to elucidate the change in air quality due to the monsoon season observing region; and, finally, (3) to estimate the cause-specific mortality rate due to PM10 and PM2.5 exposure in Islamabad.
The present study will offer scientific and technical evidence to interpret the impact of special regional (monsoon) or global (transboundary transportation) events on air quality characteristics. Moreover, the results help to develop adequate prevention and pollution control strategies and offer policy suggestions for monsoon observing countries in general and in particular, in Islamabad, Pakistan.
Material and Methods
Sampling procedure and sampling Site
The capital city of Pakistan (Islamabad) is situated 500 meters above sea level (latitude 33°49ʹ N; longitude 72°24ʹ E) opposite to the backdrop of the Margalla Hills to the north, to the north while the remaining three sides contain water bodies and plains of the province Punjab (). Islamabad has 2 million population and 906 km2 area (Khan Citation1991). Traffic pollution combined with industrial sectors in Kahuta, I-9 and I-1-0 acknowledge as the main source of pollution in Islamabad. There are various small units of factories (paint, cooking oil, pharmaceutical, pigment, marble, ceramic) and industries (oil refinery, steel mill), etc.
Figure 1. Sampling location, National center for Physics Islamabad, Pakistan
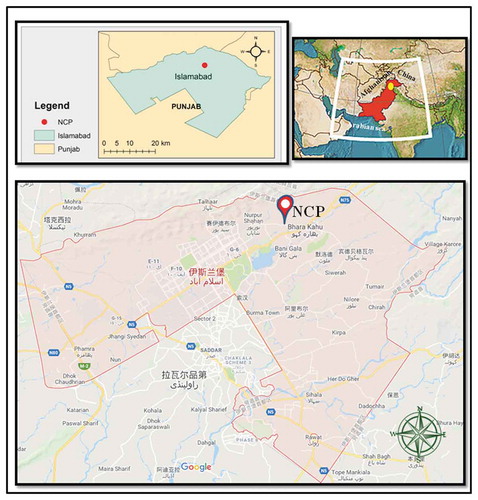
Two parallel medium volume samplers (Qingdao Laoying Environment Technology Co., Ltd, China; flow rate: 100 L/min) were installed on the top roof of a building on the National center for physics (NCP) Islamabad (). The sampling site was about 22 km away from industrial sites (I-10/I-9) and 4 km from the national highway. Daily ambient PM10 and PM2.5 samples with 24 h intervals were collected on Whatman 47 mm quartz filter papers (Munktell, 90 mm, Sweden), across the pre-monsoon and post-monsoon period. A 4 h pre-heating treatment to the quartz filter at 500 c was given to remove any organic pollutants. A total of 80 representative samples (20 of each PM10 and PM2.5 from the pre-monsoon period (13 June-10 July) and a post-monsoon period (20 August-19 September)) were collected. After sampling, each loaded filter was separately placed in an air tied plastic disks and stored in a refrigerator below 0°C before the gravimetric analysis. To avoid any contamination the sampling procedure was performed under strict quality control guidance provided by U.S. Environmental Protection Agency (EPA) (EPA Citation2016).
Gravimetric Analysis
For quality assurance, the quartz filters were equilibrated for 24 h before and after sampling in a controlled temperature (T = 20 ± 1°C) and relative humidity (50 ± 5%) chamber and allow their weights to stabilize before being weighed by an electronic balance (CPA-26P, Sartorius, German; detection limit: 2 µg).
Meteorological information
The weather data was obtained from the Pakistan meteorological department and online source at the given link: www.wunderground.com.
Health impact assessment
Based on the total population of an area, the susceptibility to each health-effect is limited. Thus, in time-series studies, actual distribution remains similar in the statistical Poisson distribution. Many available health risk assessment studies used the relative risk model of Poisson regression for the evaluation of PM exposure-based health effects (Li et al. Citation2019b). The health effect poses for a person due to an increase in every µg/m3 of ambient PM10 and PM2.5 above the threshold limit can be calculated by the use of epidemiological models. Similarly, the Relative Risk (RR) for the whole city can be estimated by using EquationEquation (1)(1)
(1) (WHO Citation2005):
In the above formula, C represents actual PM concentration, C0 represents the threshold concentration of PM2.5 and PM10, and the threshold concentration is 35 and 10 µg/m3 values for PM10 and PM2.5 in WHO (WHO Citation2005). The β is the empirical coefficient, i.e., the percentage increase in health effect by an increment of 1 µg/m3 PM10 and PM2.5 mass concentrations. The β values for this study were obtained from the literature (Atkinson et al. Citation2014; Basagana et al. Citation2015; World Health Organization Citation2003). The total attributable person for each health endpoint was evaluated by using EquationEquation (2)(2)
(2) .
Where P is the total population, while fp and f0 are the rates of incidents in clean and actual ambient air state respectively. Since the baseline incidence rate (f0) of each health-effect endpoint in Islamabad City is difficult to obtain, it can be replaced by the national baseline incidence rate (Yu et al. Citation2019) and by multiplication with a relative risk (RR) we can drive the current incident rate (fp), as shown in EquationEquation (3)(3)
(3) .
We can get E by substituting EquationEquations (2)(2)
(2) into (Equation3
(3)
(3) )
The fp values for the four endpoints were obtained from WHO (Citation2005).
This paper employs the Global Burden of Disease (GBD) approach to estimate the relationship between PM10 and PM2.5 and particle-related mortality in Islamabad (Rabl Citation2003). The health-effect endpoints were selected based on the accessibility and feasibility of required data from reliable sources and have an exposure-response relationship with PM10 and PM2.5. Based on these facts and following the Guanghui Yu et al. (Citation2019), we considered the following four health-effect endpoints, including all-cause deaths, deaths from respiratory and cardiovascular diseases, as well as suffering from chronic bronchitis. For each health-effect endpoint, the exposure-response function represented as the number of cases and the respective measure of precision (95% confidence interval, CI).
Health risk assessment
Lifetime risk
The equation no. 5 was used to calculate the PM pollution caused by lifetime risk (Harrison et al. Citation2003).
Where; Le denotes life expectancy while β and Cobs are the coefficients and current level of PM10 and PM2.5, respectively.
Premature mortality
The equation no. 7 was used to calculate the PM pollution caused by premature mortality (Harrison et al. Citation2003).
Where; Ct denotes WHO permissible limits of giving pollutants while CDR and Tp are crude death rates and a number of the total population while respectively.
Results and Discussion
The impact of monsoon on the PM10 and PM2.5 relative abundance
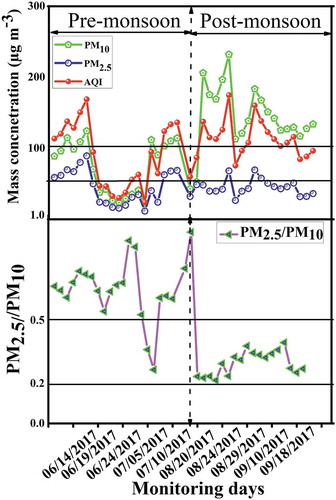
The monsoon significantly altered the fractional and relative abundance of PM in Islamabad (). The average concentrations of PM2.5 in the pre-monsoon and post-monsoon were 45.77 μg/m3 (range: 11.58– 89.24 μg/m3), and 44.52 μg/m3 (range: 26.56–69.31 μg/m3), respectively, and the corresponding average concentrations of PM10 in both periods were 74.35 μg/m3 (range: 21.99–124.17 μg/m3) and to 142.50 μg/m3 (range: 42.82– 231.85 μg/m3), respectively.
Figure 2. Mass concentration, AQI and PM2.5/PM10 ratios in pre-monsoon and post-monsoon periods
The PM2.5 concentration in the present study was above the permissible limits, yet remained lower in the other similar cities such as 55 µg/m3 in Ahmedabad, India; 190 and 75 µg/m3 in Lahore and Karachi, Pakistan; and 67, 193 and 68.5 µg/m3 in Shanghai, Taiyuan and Beijing, China, respectively (Chen et al. Citation2017; Shahid et al. Citation2016). On the other hand, PM10 remained under permissible limits in pre-monsoon, whereas the post-monsoon concentration of PM10 (142.54 μg/m3) is comparable to those 169, 171 and 190 µg/m3 observed in Beijing, China; Ahmadabad, India; and Karachi, Pakistan, respectively (Shahid et al. Citation2016).
Noticeably, the highest PM10 concentration (231 µg/m3) observed in the current study during the post-monsoon was higher than those of 123–202 µg/m3 reported by Bulbul et al. (Citation2017) during characterizing haze formation in Islamabad in 2016., higher than those of 123–202 µg/m3 reported by Bulbul et al. (Citation2017) during characterizing haze formation in Islamabad in 2016. Shah, Shaheen, and Nazir (Citation2012) also reported a substantial increase in ambient TSP levels from 148 to 198 µg/m3 after monsoon during 2005–2006.
Such a significantly higher PM10 concentration (> 50%) in post-monsoon may be linked with a relatively greater contribution of primary sources (Guo et al. Citation2014). Previous studies advocate dominance of primary pollution sources such dust storms, frequent road and street cleaning, road dust resuspension from transportation activities such as the movement of heavy traffic on unpaved roads, wear and tear of tires, soil erosion, forest-fire in Margalla Hills, the open burning of garbage waste in Rawalpindi as well as burning agricultural residual in Islamabad are major contributor of PM10 in local ambient pollution (Hamid et al. Citation2017; Mehmood et al. Citation2019; Shah and Shaheen Citation2010). Of all these except dust storms, peak emission all other sources normally occur in the post-monsoon (Hamid et al. Citation2017; Mehmood et al. Citation2019; Shah and Shaheen Citation2010).
Present findings indicate PM2.5/PM10 ratios (0.3) are lower in post-monsoon than (0.6) in pre-monsoon, respectively, suggesting that owing to secondary formation PM2.5 makes more contribution to ambient PM in the pre-monsoon, which was also observed in the previous studies (Lodhi et al. Citation2009; Lv et al. Citation2019). During a PM2.5 and PM10 characterization study in Islamabad, Lv et al. (Citation2019) ascribed more secondary organic aerosols to the presence of higher SOC/OC ratios of PM10 (0.48) and PM2.5 (0.51) in the summer in Islamabad. Similarly, in a PM2.5 characterization and source appointment study, Lodhi et al. (Citation2009) revealed secondary sources contributed 50% share in PM2.5 in Lahore, which steadily decrease from late June and a steep reduction of PM2.5 concentration observed after the monsoon rainy season. They further explained that monsoon rains washed away suspended particulate and produce long term effects on ambient PM2.5 concentration. However, this could be less effective in the case of course particles originated from road dust. La Paz et al. (Citation2015) explained this process as rain only wash out the preexisting road dust, it does not limit the emission source for new resuspension. They further explained that dry weather conditions also reduced the previous rain effect and increase dust resuspension. Amato et al. (Citation2012) also found the quick recovery of road dust emissions because of the rapid water evaporation process by solar radiation and continuous traffic emission and movement which accelerates the mobilization process.
By assuming the road dust as a major contributor of PM in the present study, we elucidated the monsoon rain’s effect on this source by correlation analysis of PM10 and PM2.5 with rain intensity and elapsed time after the last rain event. The amount of precipitation in pre-monsoon, monsoon and post-monsoon were 45, 260 and 73 mm, respectively (Supplementary material Table S4). The results showed that only PM10 correlated significantly (p < .05) with rain intensity in pre-monsoon and with elapsed time after the last rain event in post-monsoon. These findings suggest that in pre-monsoon lower precipitation could temporarily immobilize particles rather than real wash out, while high temperature and vehicle movement accelerated the remobilization of PM10, which was also observed in previous studies (Amato et al. Citation2012; Keuken, van der Gon, and van der Valk Citation2010). Contrary heavy rainfall in monsoon causes an excessive reduction in road dust, which regenerated or remobilized steadily under low temperature and wind speed as the elapsed time after rain increased.
On the other hand, mutual correlation analyses between PM10 and PM2.5 in both periods showed that the rains in monsoon led to a decrease in the correlation strength of both PM fractions with a significantly (p < .05) higher correlation observed in pre-monsoon (Spearman correlation coefficient, 0.90; R2: 0.78) than the post-monsoon (Spearman correlation coefficient, 0.55; R2: 0.29) (). A decrease in the Spearman correlation coefficient and R2 in the post-monsoon period were attributed to the contrasting emission sources or/and the absence of mutual dependence between both fractions in both periods (Pirie Citation2004).
Figure 3. Statistical interactions between PM2.5 and PM10 in pre-and post-monsoon periods
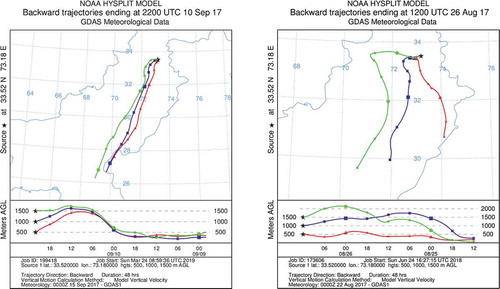
This trend may be explained by the assumption that transboundary pollution from distant sources has a strong influence on PM10 particulate pollution load, especially due to increased in primary sources during post-monsoon (Hamid et al. Citation2017; Mehmood et al. Citation2019; Shah and Shaheen Citation2010). This could be due to the characteristics of trajectories (length and origin) and wind direction in post-monsoon were found associated with more polluted cities compared to those of pre-monsoon period (Draxler and Rolph Citation2015) (, 5 and Supplementary material Figs. S1; see discussion below in back trajectory analyses)).
Figure 4. Pre-and post-monsoon periods time series of wind roses patterns (a); Meteorological parameters (b)
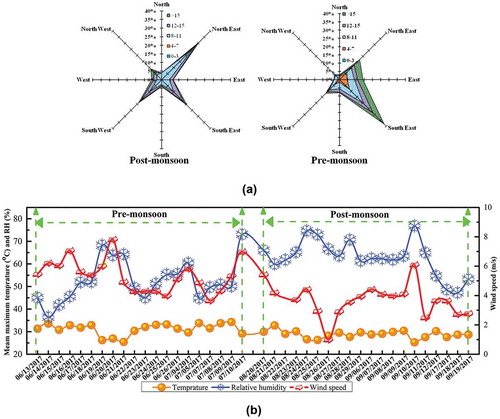
Figure 5. 48 h back trajectories of from (a) pre-monsoon and
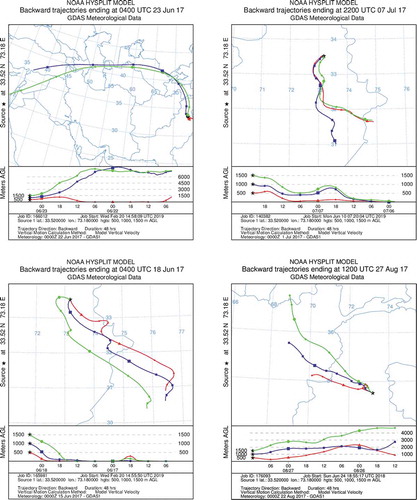
Figure 5. (b) post-monsoon period of 2017 in Islamabad showing low (l), medium (m) and high (h) polluted days
An increase in the coarse particle fraction after the monsoon season suggests that the cleansing effects of monsoon rains do not endure for a long time. Doubtlessly monsoon remains an essential factor that shapes the air quality by changing the fractional distribution of PM and increases the overall pollution level in monsoon regions (Tiwari et al. Citation2014). However, it is a coarse fraction not the fine fraction of PM behind the bad air quality in the post-monsoon period (Mehmood et al. Citation2019; Shah, Shaheen, and Nazir Citation2012). Most probably, the newly formed particulate matter contained a higher proportion of coarse particles due to the dominance of primary sources and lower secondary pollution formation process. At this moment, the vast difference of PM10 and PM2.5 in post-monsoon attributed to the coarse fraction (PM2.5–10) of PM probably comes from the regional transportation of PM from neighboring cities and deserted areas (Rasheed et al. Citation2015; Shahid et al. Citation2016).
It is generally acknowledged that transboundary movements of air masses contained both PM fraction, but are considered largely contained fine particles. In this study, the PM2.5/PM10 ratio in post-monsoon is higher than that in pre-monsoon, evidently indicating that in the post-monsoon period transboundary air pollution sources could make a more PM10 contribution to ambient pollution than pre-monsoon in Islamabad. In other words, there are possibilities of less difference between the relative proportion of PM2.5 and PM10 concentration in post-monsoon trajectories compared to pre-monsoon. Since dominant local pollution sources (road dust, crop residue burning, and vehicular emission) are primary, rains could wash away these particles, but a substantial amount of coarse particles (PM10) remobilized rapidly once the rain stopped. Although this process negatively affects the secondary pollution formation process and reduces the PM2.5 level, the transboundary air pollution source continually replenishes local PM2.5 pollution. Hence owing to changes in the relative contribution of sources (secondary and distant pollution sources), PM2.5 remained approximately similar in both periods. In other words, compare to PM10, emission sources of PM2.5 remain constant or the conditions in post-monsoon (The emission source and meteorological factors) were more conducive to the coarse fraction (Lv et al. Citation2019; Shahid et al. Citation2016).
The results are in agreement with Khodeir et al. (Citation2012), who also reported a lower PM2.5/PM10 ratio (0.33) for Jeddah due to dust storms. Similarly, Karachi, Beirut, and Cairo, where coarse dust particles are dominated and PM2.5/PM10 ratios were 0.4 are close to desert areas, which were reported as a crucial contributor of coarse particulate in neighboring cities.
Meteorological characteristics and implication of monsoon
A substantial fractional variation of PM mass concentration is highly related to seasonal change carrying contrasting meteorological conditions (McNider and Pour-Biazar Citation2020). Compared to temperature, an evident change in relative humidity and wind speed was observed between these two periods ().
As a little change in the average temperature, i.e., 35.1°C (range: 30– 41°C) and 28.8°C (range: 25–32°C) compared with 52.6% (range: 36– 72%) and 62.8% (range: 47– 76%) change in RH was observed in before and after the monsoon periods respectively. The RH remained higher compared to temperature in the post-monsoon period than the pre-monsoon, while wind speed has an opposite trend, i.e., higher in the pre-monsoon and lower in the post-monsoon. More days in the pre-monsoon observed relatively high wind speed (range: 3.6–7.8 m/s; 95% days with > 4 m/s wind speed) compared to the post-monsoon (range: 1–6.1 m/s; 40% days with > 4 m/s wind speed). Resultantly, the highest PM10 concentration (231.86 µg/m3) was observed on 28 August 2017 in the post-monsoon when the wind speeds were lowest (1 m/s) compared to all other days in both periods (Supplementary material Table S1). It was observed that the days in the post-monsoon contained low temperature and high RH which generally support more PM accumulation (both PM10 and PM2.5) in the atmosphere (Peng et al. Citation2005) Similarly, wind speed also influences overall particulate matter pollution where low wind speed, favored their accumulation in post-monsoon (Cao et al. Citation2007) while the high wind speed in pre-monsoon diluted the atmosphere (Shah, Shaheen, and Nazir Citation2012). As in the pre-monsoon period there was less primary sources compared to post-monsoon so windstorms among the major source of coarse fraction in pre-monsoon period. Although windstorms contributed in the ambient coarse fraction during pre-monsoon period, but prevailing of high wind speeds offset their impact rapidly in after days. Thus, meteorological conditions could be the main factor that increased the PM concentration in the post-monsoon.
Back Trajectory Analysis
The possible contribution of PM from distant sources of neighboring cities was evaluated with back trajectory analyses using the NOAA Hysplit model. All trajectories were computed 48 h back in time at 500,1000 and 1500 m heights (Draxler and Rolph Citation2015). Polissar, Hopke, and Harris (Citation2001) identify long period time causes error in judgment of the endpoints of trajectories a 10 day backward time interval is considered useful in case of source region assessment of particulate matter. However 48 h trajectories period is most used and suggested interval for 24 h sampling time. (Bulbul et al. Citation2017; Li et al. Citation2013). The trajectories represent the general wind pattern in three directions: the southeast (western India), northwest (eastern Afghanistan) and southwest (Arabian Sea) of Islamabad (Supplementary material Figs. S1). Of these the trajectory’s pathways, the southeast originated trajectories carried the higher PM concentration followed by the southwest and northeast whether it is in the pre-monsoon or post-monsoon period. The PM2.5 and PM10 concentration in trajectories started from the northeast were found to be lower in the pre-monsoon period than that of post-monsoon (11.58 and 21.99 vs. 26.52 and 42.82 μg/m3, respectively). Overall, these trajectories carried low PM load owing to cleaner hilly areas, Haripur district and Murree hill station in the northeast of Islamabad. Therefore, the air masses entered in Islamabad from these cities contained fresh air except those originated from Kabul (Afghanistan). The eastern Afghanistan (Jalalabad and Kabul) contains industries and vehicular emission, tyres burning, diesel-powered electric generator, and biomass burning as key pollution sources (Wingfors, Hägglund, and Magnusson Citation2011). As is shown in , the wind rose pattern in the pre-monsoon was mainly toward the southeast, which came from hilly areas, hence less affected by transboundary air pollutants. However, the post-monsoon period observed diverse wind rose patterns predominantly northeast, followed by southeast, southwest and northwest, respectively. The PM2.5 and PM10 concentration in trajectories started from the southeast were found to be lower in the pre-monsoon period than that of post-monsoon (89.24 and 124.17 vs. 69.31 and 205.84 μg/m3, respectively). To the southeast of Islamabad lies metropolis Rawalpindi (4th biggest city of Pakistan and the ranked 4th in 20 worst cities worldwide for pollution of PM10). Besides the long distant air masses started from western India transported sand from Rajasthan desert, industrial and vehicular emission as well as pollutants released from coal and biomass burning in Punjab and Gujarat (Lau et al. Citation2009) also enters in Islamabad via Rawalpindi.
Whereas, the air masses come from southwest of Islamabad transported pollutant generated from crop residual burning and field plowing activities in vast agricultural plains of Punjab as well as road dust, vehicular and industrial emission, construction activities in bigger cities like Faisalabad, Lahore and Karachi (Lodhi et al. Citation2009; Mehmood et al. Citation2018; Shah et al. Citation2006). Similarly, the days with high wind speed (> 15 m/s) in the post-monsoon period possessed northwest wind direction that possibly carried sand and dust from the Cholistan desert which is situated on the southeast of Islamabad (Rasheed et al. Citation2015). The trajectories with medium PM concentrations are those that started from the southwest, whether it is in pre-monsoon or post-monsoon.
The trajectories associated with the lowest (l), medium (m) and the highest (h) polluted days in pre-monsoon and post-monsoon is shown in Fig. 5a and 5b respectively. It can perceive by comparing the wind direction () and backward trajectories (Fig. 5) that high transboundary transportation of PM contributed significantly higher in the post-monsoon period than the pre-monsoon.
These trajectories transported both PM2.5 and PM10 whether it is in pre-monsoon or post-monsoon. Fig. S1 (Supplementary material) showed most of the day the air masses entered in Islamabad from neighboring cities, however the number of days with long distance trajectories are more in post-monsoon compared to pre-monsoon period, and those traveled more distance and enters in Islamabad from the major metropolis such as Lahore, Faisalabad and Rawalpindi. Thus, these trajectories usually contained higher PM2.5 and PM10 compared to those trajectories associated with the pre-monsoon period enters from hilly areas.
More probably the difference of the relative proportion of PM2.5 and PM10 in the post-monsoon was less than in the pre-monsoon due to the contribution of more primary sources in the latter period. For instance, trajectories that entered in Islamabad from Rawalpindi were more frequent in the post-monsoon, and fewer in the pre-monsoon period, possibly contained an excessive amount of PM10 due to high road dust and very short distance (15 km) between these two cities. Additional pollution sources such as crop residue burning and plowing activities, road dust resuspension due to vehicle movements as discussed above also loaded higher PM10 in air masses mainly prevailed in the post-monsoon period. Herein, it can be concluded that transboundary transportation affects local PM10 concentration more than PM2.5.
Air quality index
Air quality index (AQI) is a relevant term that explained the ambient pollution level and suggests it’s potential to cause health problems. The EPA Air Quality Standards (EPA Citation2012) recommended by the Ministry of climate change Pakistan, the AQI represent of the pollutant with higher individual air quality indices (IAQIs) at a location ascribed as the AQI of that area (Gurjar et al. Citation2010; Javed et al. Citation2014). The standard values of AQI are categorized into six groups, shown in Supplementary material Table S2.
The daily change in average AQI in Islamabad from both periods is shown in . The highest AQI values in pre-and post-monsoon were 168 and 174, respectively. The general AQI status of air quality in Islamabad remained from good to unhealthy, with an average AQI of 90.17 (range: 23.88– 168.88) and 111.10 (range: 59.94– 174.67) in pre-and post-monsoon respectively. However, the current AQI values are lower than those reported in the other Asian megacities like Delhi (336), India (Kumar and Goyal Citation2011); Sistan (316), Iran (Rashki et al. Citation2012) and Faisalabad (909–715), Pakistan (Javed et al. Citation2014). The absence of significant pollution inventories, cleaner roads and greenery could be a possible reason for the relatively better air quality of Islamabad (Shah and Shaheen Citation2008).
The substantial decrease (35 to 55%) in days of excellent air quality was observed in the post-monsoon. Shen et al. (Citation2017) also reported higher AQI in autumn compared to summer. In Xian, China, the lowest AQI was found in pre-monsoon than other parts of the year during 2015 (Tang et al. Citation2018). Besides August 23 and 25, the AQI for all other days were defined by PM2.5 pollution level due to its higher concentration in both periods as the pollutant with higher AQI represents the overall air quality of a particular location and can be used to delineate the PM-related risk posed to human health (Gurjar et al. Citation2008). Hence, the current study reveals the monsoon changed the factors which define the air quality of Islamabad.
Health impact assessment
showed that apart from PM10 concentration in pre-monsoon, all other PM10 and PM2.5 mass concentration values are above the given threshold limits of WHO, EPA and NEQSAA (Pak). Since PM10 remained below the threshold in the pre-monsoon, only 23% of total sampling days in both periods showed elevated PM10 mass concentration. On the other hand, 60% days of whole sampling days showed a higher level of PM2.5, i.e., 40% and 80% days in pre-and post-monsoon periods respectively. A summary of the estimated health effects due to PM10 and PM2.5 exposure-response (total cases and 95% CI) is given in , with controlling gender, age, weight, height, and the day of the week for adjusting for potential confounders.
Table 1. Different health-effect endpoints in pre-monsoon and post-monsoon season due to PM10 and PM2.5 exposure
The number of estimated cases of all-cause mortality before and after the monsoon was 1030, and 1728 deaths, respectively, indicate the addition of 742 deaths due to increasing in PM10 concentration in the second period. Since there had been no study addressing the health impacts of PM10 and PM2.5 in Islamabad before, we had to compare our results with the findings of other studies conducted in other parts of the world. The number of attributable deaths obtained in this study was higher in the reported cases in less polluted megacities of the world like Osaka, Kobe and Tokyo, Japan, Los Angeles, and New York, USA; and Sao Paulo, Brazil; i.e., 60–500 deaths/year. However, Dhaka, Cairo, Beijing, and Delhi have higher attributable cases, e.g., 14,700, 14,100, 11,500 and 10,500 deaths per year respectively. The exposure of 668 µg/m3 total suspended particulate was estimated to cause higher all-cause mortality, i.e., 15,000 deaths per year (Gurjar et al. Citation2010).
The estimated number of deaths and hospital admissions of the people affected by PM10 and PM2.5 among Islamabad residents in the post-monsoon are 128, 100 deaths, and 426 hospital admissions due to cardiovascular disease, respiratory disease, and chronic bronchitis respectively. Compared with the pre-monsoon period when the PM10 concentration remained below to the threshold level, excess health effects are 88 and 59 death and 276 hospital admissions that of the latter. Our results are by finding previous studies that explained that the deaths due to the exposure-response effects of PM10 and PM2.5 directly relate with the PM concentration, economic status and strength of the exposed population. The megacities of developed countries have a relatively lower death rate compare to the under-developing counties (Gurjar et al. Citation2008; Hadei et al. Citation2018). Asia, including India, China, Iran, Bangladesh, and Pakistan, the death due to the above-mentioned health-effects appeared higher to those found in Japan, Brazil, Europe, and America (Supplementary material Table S5).
Health risk assessment
The Lifetime risk estimation
We calculated the difference in expected lifetime risk poses to residents of Islamabad during both periods. The regulatory standards of PM10 and PM2.5 chronic exposure are given shown in Supplementary material Table S3. Based on these standard values and observed PM10 and PM2.5 mass concentration LTR was estimated by the all-cause mortality endpoint (). A coefficient has been obtained from WHO (Citation2006) for each PM2.5 (4%/10) and PM10 (0.55%/10) (Lu et al. Citation2015), and consider life expectancy 64.4 years (World Life Expectancy Citation2017). The PM2.5 exposure caused health risk in Islamabad is severe in both periods, with an average LTR of 2.76 × 10⁻³ and 2.68 × 10⁻³ in pre-and post-monsoon periods respectively. In the case of PM10, the value increases from 5.60 × 10⁻⁴ in the pre-monsoon to 1.07 × 10⁻³ in the post-monsoon. The present estimate LTR values are higher than EPA and European Commission recommended values (˂10-6 to 10–4 per year) (European Commission Citation2001; Kamal et al. Citation2014). Present values may not represent total pose risk to a resident of Islamabad, as it only based on PM mass concentration and LTR due to other chemical components that may boost overall risk associated with PM pollution (Rasheed et al. Citation2015).
Table 2. Premature mortalities and lifetime risk associated with the mean exposures of PM10 and PM2.5 in pre-and post-monsoon
Premature mortality
The premature mortality causes were calculated for both fractions in two periods. The current population of Islamabad is about 1,502,000, persons and crud death rates of 6.4/1000 persons in Islamabad (World Life Expectancy Citation2017). The estimated premature mortality deaths in pre-monsoon and-post-monsoon were found to be higher for PM2.5 than that of PM10 (176 and 171 vs. 71 and 136 deaths, respectively). Results showed both PM10 and PM2.5 are causing premature mortalities in Islamabad. Although PM2.5 is comparatively more toxic still, a higher concentration of PM10 could be dangerous particularly for children and elderly people (EPA Citation2016). The combined premature mortality rate due to PM10 and PM2.5 exposure in the post-monsoon (307 deaths) is higher than those in the pre-monsoon period (247 deaths), respectively. The estimated premature deaths due to PM2.5 exposure in both periods were lower to the Ahvaz city in Iran, where short-term exposure to PM2.5 with an annual mean concentration of 80.59 µg/m3 caused 278 deaths in 2014 (Nourmoradi Citation2015). The higher premature death rate in Ahvaz possibly attributed to the smaller city size of 200 km2, with a population of 1.13 million residents in 2014. The cases of premature mortality are known to increase with the increase in the exposed population, exposure frequency, and the PM concentration (Harrison et al. Citation2017). Only one death due to PM2.5 exposure was reported in Jiangda (Tibet) by Song et al. (Citation2016) in 2013. They associate this with the lower concentration of PM2.5 (24.17 µg/m3) and a smaller population (3,755, persons) of the city. Contrary, Cairo (Egypt) observed annually 12,520 premature deaths for both a higher population of 22.4 million and a higher PM2.5 concentration (range: 50–100 µg/m3) (Wheida et al. Citation2018). The evidence suggests deaths, hospital admissions, and health risks are higher due to PM2.5 exposure; however, the combined effect of the elevated level of PM10 and PM2.5 results in more severe health outcomes making the post-monsoon period worst (Wang et al. Citation2012).
The present study has some limitations to be addressed in future studies. We relied on PM10 and PM2.5 sampling results obtained from one urban area of the city. The sampling may not represent different population groups of exposure and could result in the underestimation of specific attributable cases of each health-effect endpoint. However, we reduce the uncertainties by taking up following assumptions, firstly (1) the mean PM10 and PM2.5 concentration remained constant over time (Lo et al. Citation2017); (2) the air quality is significantly related to the vehicular emission and road dust in the city and the most likely population exposed to air pollution is the urban population (Hamid et al. Citation2017), (3) considering the available literature current study assumed only urban population as the exposed group (Renjie, Bingheng, and Haidong Citation2010).
Despite these limitations, we’ve been able to evaluate relative health risks due to PM10 and PM2.5 exposure in the residents of Islamabad in both periods. Being aware that there is no minimum level of safe exposure to PM10 and PM2.5, doctors taking care of sensitive patients should give exceptional consideration to the route of illness and control of patients with respiratory and cardiovascular diseases to air pollution, particularly in a specific period of the year such as post-monsoon when the PM pollution level increase rapidly. Future studies should consider the variation of chemical components of PM10 and PM2.5 across the monsoon, and also long term sampling campaigns are suggested for detailed health risk assessment in Islamabad and similar areas (Habeebullah Citation2014).
Conclusion
Using the results of filter-based ambient PM10 and PM2.5 sampling of pre-and post-monsoon in Islamabad, this study examined the air quality of Islamabad, along with a change in PM characteristics and estimated the various health-effects endpoints. The major conclusions are as follows.
With the negligible change, PM2.5 mass concentration remained above-defined threshold values in both pre-and post-monsoon periods. The relatively bad air quality in the post-monsoon is attributed to an increase in PM10 levels above the permissible limits. Substantial increment of PM10 (> 50%) in the post-monsoon could be due to increase of the primary pollution sources, resuspension of road dust and transboundary pollution sources. The pre-monsoon period observed more conducive atmospheric conditions for secondary pollution formation while in the post-monsoon period PM2.5 mainly transported from distant sources. The back trajectory analyses and wind rose patterns showed the origin of trajectories and the directions of the winds were mainly associated with polluted sites in the post-monsoon period.
The cleaning effects of monsoon rains did not produce long-term effects on air quality, which remained good to unhealthy before and after the monsoon. However, an increment of PM10 concentration in post-monsoon resulted in a 20% decrease in the ratio of days with excellent and good air compared to the pre-monsoon period. The health risk associated with PM2.5 remained persistent while the elevated concentration of PM10 caused 59, 68, 59, and 64% increase of total attributable deaths due to all-cause mortality, cardiovascular disease, respiratory disease and hospital admission due to chronic bronchitis in the post-monsoon period. Similarly, estimated death due to premature mortality also increased from 247 in the pre-monsoon to 307 deaths in the post-monsoon, and subsequent estimated LTR increased after the monsoon. The characteristics of PM pollution in context to the monsoon suggest the need for particular management practices to control coarse PM pollution in monsoon facing regions, and in Islamabad, both PM2.5 and PM10 concentrations are needed to be lower down below the respective permissible limits.
Supplemental Material
Download MS Word (2 MB)Acknowledgment
The authors thank the China Section of the Air & Waste Management Association for the generous scholarship they received to cover the cost of page charges, and make the publication of this paper possible.
Disclosure statement
No potential conflict of interest was reported by the authors.
Supplementary material
Supplemental data for this article can be accessed on the publisher’s website.
Additional information
Funding
Notes on contributors
Tariq Mehmood
Tariq Mehmood currently works at the Ministry of Education Key Laboratory of Integrated Regulation and Resource Development on Shallow Lakes, with the college of civil engineering Hohai University, Nanjing, P.R. China, 210098. He is a Postdoctoral fellow at the College of Environment, Hohai University, Nanjing, P.R. China.
Ishaq Ahmad
Ishaq Ahmad is a Director of Experimental Physics at National Center for Physics.
Saira Bibi
Saira Bibi is an Assistant Project Scientist at Institute of Advance Materials, Bahauddin Zakariya University, Multan, Pakistan.
Beenish Mustafa
Beenish Mustafa is a Ph.D. student at the Department of Physics, Nanjing University, Nanjing, China.
Ijaz Ali
Ijaz Ali is a M.Phil student at School of Environmental Science and Engineering, North China Electric Power University, Beijing, 102206, China.
Related Research Data
References
- Amato, F., M. Schaap, H. A. D. van der Gon, M. Pandolfi, A. Alastuey, M. Keuken, and X. Querol. 2012. Effect of rain events on the mobility of road dust load in two Dutch and Spanish roads. Atmos. Environ. 62:352–58.
- Atkinson, R. W., S. Kang, H. R. Anderson, I. C. Mills, and H. A. Walton. 2014. Epidemiological time series studies of PM2. 5 and daily mortality and hospital admissions: A systematic review and meta-analysis. Thorax. 69:204–492.
- Basagana, X., B. Jacquemin n.d., A. Karanasiou, B. Ostro, X. Querol, D. Agis, E. Alessandrini, J. Alguacil, B. A. Artiñano, and M. Catrambone. 2015. Short-term effects of particulate matter constituents on daily hospitalizations and mortality in five South-European cities: Results from the MED-PARTICLES project. Environ Int 75:151–58.
- Bulbul, G., I. Shahid, F. Chishtie, M. Z. Shahid, R. A. Hundal, F. Zahra, and M. I. Shahzad. 2017. PM10 sampling and AOD trends during 2016 winter fog season in the Islamabad Region. Aerosol Air Qual. Res. 18:188–199.
- Cao, J. J., S. C. Lee, J. C. Chow, J. G. Watson, K. F. Ho, R. J. Zhang, Z. D. Jin, Z. X. Shen, G. C. Chen, and Y. M. Kang. 2007. Spatial and seasonal distributions of carbonaceous aerosols over China. J. Geophys. Res. 121:804–810.
- Chen, H., R. T. Burnett, J. C. Kwong, P. J. Villeneuve, M. S. Goldberg, R. D. Brook, A. van Donkelaar, M. Jerrett, R. V. Martin, and J. R. Brook. 2013. Risk of incident diabetes in relation to long-term exposure to fine particulate matter in Ontario, Canada. Environ.Health Perspect. 586:255–264.
- Chen, Y., X. Li, T. Zhu, Y. Han, and D. Lv. 2017. PM2.5-bound PAHs in three indoor and one outdoor air in Beijing: Concentration, source and health risk assessment. Sci. Total Environ. 586:255–64.
- Draxler, R., and G. Rolph. 2015. HYSPLIT (HYbrid Single-Particle Lagrangian Integrated Trajectory) model access via NOAA ARL READY website. College Park, MD: NOAA Air Resources Laboratory.
- European Commission. 2001. Polycyclic Aromatic Hydrocarbons (PAH). Position Paper, Working Group on Polycyclic Aromatic Hydrocarbons, Luxembourg.
- Forouzanfar, M. H., A. Afshin, L. T. Alexander, H. R. Anderson, Z. A. Bhutta, S. Biryukov, M. Brauer, R. Burnett, K. Cercy, and F. J. Charlson. 2016. Global, regional, and national comparative risk assessment of 79 behavioural, environmental and occupational, and metabolic risks or clusters of risks, 1990–2015: A systematic analysis for the Global Burden of Disease Study 2015. Lancet 388:1659–724.
- Gu, J., Z. Bai, W. Li, L. Wu, A. Liu, H. Dong, and Y. Xie. 2011. Chemical composition of PM2.5 during winter in Tianjin, China. Particuology 9:215–21.
- Guo, S., M. Hu, M. L. Zamora, J. Peng, D. Shang, J. Zheng, Z. Du, Z. Wu, M. Shao, and L. Zeng. 2014. Elucidating severe urban haze formation in China. Proc. Natl. Acad. Sci. 111:17373–78.
- Gurjar, B., A. Jain, A. Sharma, A. Agarwal, P. Gupta, A. Nagpure, and J. Lelieveld. 2010. Human health risks in megacities due to air pollution. Atmos. Environ. 44:4606–13.
- Gurjar, B. R., T. M. Butler, M. G. Lawrence, and J. Lelieveld. 2008. Evaluation of emissions and air quality in megacities. Atmos. Environ. 42:1593–606.
- Habeebullah, T. M. 2014. Modeling Particulate Matter (PM10) in Makkah, Saudi Arabia - A view point of health impact. Transit Aust. 54:2778–84.
- Hadei, M., S. S. Hashemi Nazari, A. Eslami, A. Khosravi, M. Yarahmadi, Z. Naghdali, and A. Shahsavani. 2018. Distribution and number of ISCHEMIC HEART DISEASE (IHD) and stroke deaths due to chronic exposure to PM2.5 IN 10 cities of IRAN (2013-2015); an AirQ+ modelling. J. Air Pollut. Health 2 (3):129–136.
- Hadei, M., S. S. H. Nazari, M. Yarahmadi, M. Kermani, M. Farhadi, and A. Shahsavani. 2017. Estimation of gender-specific lung cancer deaths due to exposure to PM2.5 in 10 cities of Iran during 2013-2016: A modeling approach. Aerosol Air Qual Res. 17:2474–2481.
- Hamid, N., J. H. Syed, M. Junaid, A. Mahmood, J. Li, G. Zhang, and R. N. Malik. 2017. Elucidating the urban levels, sources and health risks of polycyclic aromatic hydrocarbons (PAHs) in Pakistan: Implications for changing energy demand. Sci. Total Environ. 619–620:165–75.
- Harrison, R. M., D. Bousiotis, A. Mohorjy, A. Alkhalaf, M. Shamy, M. Alghamdi, M. Khoder, and M. Costa. 2017. Health risk associated with airborne particulate matter and its components in Jeddah, Saudi Arabia. Sci. Total Environ. 590:531–39.
- Harrison, R. M., R. Tilling, M. Ì. A. S. C. N. Romero, S. Harrad, and K. Jarvis. 2003. A study of trace metals and polycyclic aromatic hydrocarbons in the roadside environment. Atmos. Environ. 37:2391–402.
- Herman, D. A., L. M. Wingen, R. M. Johnson, A. J. Keebaugh, S. R. Renusch, I. Hasen, A. Ting, and M. T. Kleinman. 2020. Seasonal effects of ambient PM2. 5 on the cardiovascular system of hyperlipidemic mice. J. Air Waste Manage. Assoc. 70:307–323.
- Hien, P. D., V. T. Bac, and N. T. H. Thinh. 2004. PMF receptor modelling of fine and coarse PM10 in air masses governing monsoon conditions in Hanoi, northern Vietnam. Atmos. Environ. 38:189–201.
- Hopke, P. K., S. S. H. Nazari, M. Hadei, M. Yarahmadi, M. Kermani, E. Yarahmadi, and A. Shahsavani. 2018. Spatial and temporal trends of short-term health impacts of PM2.5 in Iranian cities; a modelling approach (2013-2016). Aerosol Air Qual. Res. 18:497–504sss.
- Imran, A., Q. Zaman, G. Rasul, and A. Mahmood. 2014. An analytical study of the variations in the monsoon patterns over Pakistan. Pak. J. Meteorol. 10:20.
- Iqbal, M. F., and H. Athar. 2018. Validation of satellite based precipitation over diverse topography of Pakistan. Atmos. Res. 201:247–60.
- Javed, W., G. Murtaza, H. R. Ahmad, and M. Iqbal. 2014. A preliminary assessment of air quality index (AQI) along a busy road in Faisalabad metropolitan, Pakistan. Int.l J. Environ. Sci. 5:623–33.
- Kamal, A., R. N. Malik, T. Martellini, and A. Cincinelli. 2014. PAH exposure biomarkers are associated with clinico-chemical changes in the brick kiln workers in Pakistan. Sci. Total Environ. 490:521–27.
- Keuken, M., H. D. van der Gon, and K. van der Valk. 2010. Non-exhaust emissions of PM and the efficiency of emission reduction by road sweeping and washing in the Netherlands. Sci. Total Environ. 408:4591–99.
- Khan, F. K. 1991. A geography of Pakistan: Environment, people and economy. Ann Arbor: University of Michigan.
- Khodeir, M., M. Shamy, M. Alghamdi, M. Zhong, H. Sun, M. Costa, L.-C. Chen, and P. Maciejczyk. 2012. Source apportionment and elemental composition of PM2. 5 and PM10 in Jeddah City, Saudi Arabia. Atmos. Pollut. Res. 3:331–40.
- Kumar, A., and P. Goyal. 2011. Forecasting of daily air quality index in Delhi. Sci. Total Environ. 409:5517–23.
- La Paz, D. D., R. Borge, M. Vedrenne, J. Lumbreras, F. Amato, A. Karanasiou, E. Boldo, and T. Moreno. 2015. Implementation of road dust resuspension in air quality simulations of particulate matter in Madrid (Spain). Front. Environ. Sci. 3:72.
- Lau, W. K., K.-M. Kim, C. N. Hsu, and B. N. Holben. 2009. Possible influences of air pollution, dust and sandstorms on the Indian monsoon, 22–30. Geneva, Switzerland: Bulletin - World Meteorological Organization 2009 World Meteorological Organization (WMO).
- Li, C., Z. Dai, L. Yang, and Z. Ma. 2019a. Spatiotemporal characteristics of air quality across Weifang from 2014–2018. Int. J. Environ. Res. Public Health 16:3122.
- Li, J., T. Xu, X. Lu, H. Chen, S. A. Nizkorodov, J. Chen, X. Yang, Z. Mo, Z. Chen, and H. Liu. 2017. Online single particle measurement of fireworks pollution during Chinese new year in Nanning. J. Environ. Sci. China 53:184–95.
- Li, X., K. He, C. Li, F. Yang, Q. Zhao, Y. Ma, Y. Cheng, W. Ouyang, and G. Chen. 2013. PM2. 5 mass, chemical composition, and light extinction before and during the 2008 Beijing olympics. J. Geophys. Res. 118 (12):158–112,167.
- Li, Y., C. Zheng, Z. Ma, and W. Quan. 2019b. Acute and cumulative effects of haze fine particles on mortality and the seasonal characteristics in Beijing, China, 2005–2013: A time-stratified case-crossover study. Int. J. Environ. Res. Public Health 16:2383.
- Lo, W.-C., R.-H. Shie, -C.-C. Chan, and -H.-H. Lin. 2017. Burden of disease attributable to ambient fine particulate matter exposure in Taiwan. J. Formosan Med. Assoc. 116:32–40.
- Lodhi, A., B. Ghauri, M. R. Khan, S. Rahman, and S. Shafique. 2009. Particulate matter (PM2. 5) concentration and source apportionment in Lahore. J. Braz. Chem. Soc. 20:1811–20.
- Lu, F., D. Xu, Y. Cheng, S. Dong, C. Guo, X. Jiang, and X. Zheng. 2015. Systematic review and meta-analysis of the adverse health effects of ambient PM2.5 and PM10 pollution in the Chinese population. Environ. Res. 136:196–204.
- Lv, D., Y. Chen, T. Zhu, T. Li, F. Shen, X. Li, and T. Mehmood. 2019. The pollution characteristics of PM10 and PM2. 5 during summer and winter in Beijing, Suning and Islamabad. Atmos. Pollut. Res. 10:1159–64.
- Mansha, M., B. Ghauri, S. Rahman, and A. Amman. 2012. Characterization and source apportionment of ambient air particulate matter (PM2.5) in Karachi. Sci. Total Environ. 425:176–83.
- McNider, R. T., and A. Pour-Biazar. 2020. Meteorological modeling relevant to mesoscale and regional air quality applications: A review. J. Air Waste Manage. Assoc. 70:2–43.
- Mehmood, T., Z. Tianle, I. Ahmad, and X. Li. 2019. Integration of AirQ+ and particulate matter mass concentration to calculate health and ecological constraints in Islamabad, Pakistan. 16th International Bhurban Conference on Applied Sciences and Technology (IBCAST), 248–54. Islamabad, Pakistan: IEEE.
- Mehmood, T., Z. Tianle, I. Ahmad, and X. Li. 2020. Ambient PM2.5 and PM10 bound PAHs in Islamabad, Pakistan: Concentration, source and health risk assessment. Chemosphere. 257: 127187.
- Mehmood, T., Z. Tianle, I. Ahmad, X. Li, F. Shen, W. Akram, and L. Dong. 2018. Variations of PM2. 5, PM10 mass concentration and health assessment in Islamabad, Pakistan. IOP Conference Series: Earth and Environmental Science, 012031. Shanghai, China: IOP Publishing.
- Nourmoradi, H. 2015. 8-health impacts of particulate matter in air using AirQ model in Khorramabad City. Iran. J. Basic Res. Med. Sci. 2:44–52.
- Organization, W. H. 2014. 7 million premature deaths annually linked to air pollution. Geneva, Switzerland: World Health Organization.
- Pakistan Economic surveySurvey. 2017. Pakistan economic survey 2016-17. Economic Adviser’s Wing Economic Adviser’s Wing, Finance Division, Government of Pakistan, Islamabad.
- Peng, R. D., F. Dominici, R. Pastor-Barriuso, S. L. Zeger, and J. M. Samet. 2005. Seasonal analyses of air pollution and mortality in 100 US cities. Am. J. Epidemiol. 161:585–94.
- Pirie, W. 2004. Spearman rank correlation coefficient. Hoboken, NJ: John Wiley & Sons, Inc.
- Polissar, A. V., P. K. Hopke, and J. M. Harris. 2001. Source regions for atmospheric aerosol measured at Barrow, Alaska. Environ. Sci. Technol. 35:4214–26.
- Qadir, M. A., J. H. Zaidi, S. A. Ahmad, A. Gulzar, M. Yaseen, S. Atta, and A. Tufail. 2012. Evaluation of trace elemental composition of aerosols in the atmosphere of Rawalpindi and Islamabad using radio analytical methods. Appl. Radiat. Isot. 70:906–10.
- Rabl, A. 2003. Interpretation of air pollution mortality: Number of deaths or years of life lost. J. Air Waste Manage. Assoc. 53:41–50.
- Raes, F., R. Van Dingenen, E. Vignati, J. Wilson, J.-P. Putaud, J. H. Seinfeld, and P. Adams. 2000. Formation and cycling of aerosols in the global troposphere. Atmos. Environ. 34:4215–40.
- Ramachandran, S. 2005. PM2.5 mass concentrations in comparison with aerosol optical depths over the Arabian Sea and Indian Ocean during winter monsoon. Atmos. Environ. 39:1879–90.
- Rasheed, A., V. P. Aneja, A. Aiyyer, and U. Rafique. 2014. Measurements and analysis of air quality in Islamabad, Pakistan. Earth’s Future 2:303–14.
- Rasheed, A., V. P. Aneja, A. Aiyyer, and U. Rafique. 2015. Measurement and analysis of fine particulate matter (PM2. 5) in urban areas of Pakistan. Aerosol Air Qual. Res. 15:426–39.
- Rashki, A., D. G. Kaskaoutis, C. J. D. Rautenbach, P. G. Eriksson, M. Qiang, and P. Gupta. 2012. Dust storms and their horizontal dust loading in the Sistan region, Iran. Aeolian Res. 5:51–62.
- Renjie, C., C. Bingheng, and K. Haidong. 2010. A health-based economic assessment of particulate air pollution in 113 Chinese cities. China Environ. Sci. 30:410–15.
- Scibor, M., A. Galbarczyk, and G. Jasienska. 2019. Living well with pollution? The impact of the concentration of PM2.5 on the quality of life of patients with Asthma. Int. J. Environ. Res. Public Health 16:2502.
- Shah, M. H., and N. Shaheen. 2008. Annual and seasonal variations of trace metals in atmospheric suspended particulate matter in Islamabad, Pakistan. Water Air Soil Pollut. 190:13–25.
- Shah, M. H., and N. Shaheen. 2010. Seasonal behaviours in elemental composition of atmospheric aerosols collected in Islamabad, Pakistan. Atmos. Res. 95:210–23.
- Shah, M. H., N. Shaheen, M. Jaffar, A. Khalique, S. R. Tariq, and S. Manzoor. 2006. Spatial variations in selected metal contents and particle size distribution in an urban and rural atmosphere of Islamabad, Pakistan. J. Environ. Manage. 78:128–37.
- Shah, M. H., N. Shaheen, and R. Nazir. 2012. Assessment of the trace elements level in urban atmospheric particulate matter and source apportionment in Islamabad, Pakistan. Atmos. Pollut. Res. 3:39–45.
- Shahid, I., M. Kistler, A. Mukhtar, B. M. Ghauri, C. Ramirez-Santa Cruz, H. Bauer, and H. Puxbaum. 2016. Chemical characterization and mass closure of PM10 and PM2. 5 at an urban site in Karachi–Pakistan. Atmos. Environ. 128:114–23.
- Shen, F., X. Ge, J. Hu, D. Nie, L. Tian, and M. Chen. 2017. Air pollution characteristics and health risks in Henan Province, China. Environ. Res. 156:625–34.
- Song, Y., X. Wang, B. A. Maher, F. Li, C. Xu, X. Liu, X. Sun, and Z. Zhang. 2016. The spatial-temporal characteristics and health impacts of ambient fine particulate matter in China. J. Clean. Prod. 112:1312–18.
- Sulong, N. A., M. T. Latif, M. Sahani, M. F. Khan, M. F. Fadzil, N. M. Tahir, N. Mohamad, N. Sakai, Y. Fujii, M. Othman, et al. 2019. Distribution, sources and potential health risks of polycyclic aromatic hydrocarbons (PAHs) in PM2.5 collected during different monsoon seasons and haze episode in Kuala Lumpur. Chemosphere 219:1–14.
- Tang, S., Q. Yan, W. Shi, X. Wang, X. Sun, P. Yu, J. Wu, and Y. Xiao. 2018. Measuring the impact of air pollution on respiratory infection risk in China. Environ. Pollut. 232:477–86.
- Tiwari, S., D. S. Bisht, A. K. Srivastava, A. S. Pipal, A. Taneja, M. K. Srivastava, and S. D. Attri. 2014. Variability in atmospheric particulates and meteorological effects on their mass concentrations over Delhi, India. Atmos. Res. 145:45–56.
- U.S. Environmental Protection Agency (EPA). 2012. Revised air quality standards for particle pollution and updates to the Air Quality Index (AQI), EPA R99–010. North Carolina: U.S. Environmental Protection Agency, Office of Air Quality Planning and Standards.
- U.S. Environmental Protection Agency (EPA). 2016. Technical assistance document for the reporting of daily air quality-the Air Quality Index (AQI). In Office of air quality planning and standards, ed. D. Mintz, 1–26. North Carolina: U.S. Environmental Protection Agency.
- U.S. Environmental Protection Agency (EPA). 2016. Ambient air sampling. North Carolina: U.S. Environmental Protection Agency.
- Wang, H., L. Dwyer-Lindgren, K. T. Lofgren, J. K. Rajaratnam, J. R. Marcus, A. Levin-Rector, C. E. Levitz, A. D. Lopez, and C. J. L. Murray. 2012. Age-specific and sex-specific mortality in 187 countries, 1970–2010: A systematic analysis for the Global Burden of Disease Study 2010. Lancet 380:2071–94.
- Wheida, A., A. Nasser, M. El Nazer, A. Borbon, G. A. A. El Ata, M. A. Wahab, and S. C. Alfaro. 2018. Tackling the mortality from long-term exposure to outdoor air pollution in megacities: Lessons from the Greater Cairo case study. Environ. Res. 160:223–31.
- WHO. 2005. World Health Organization. Air quality guidelines global update 2005 – Particulate matter, ozone, nitrogen dioxide and sulphur dioxide. Copenhagen, Denmark: World Health Organization, Regional Office for Copenhagen.
- WHO. 2006. Air quality guidelines: Global update 2005: Particulate matter, ozone, nitrogen dioxide, and sulfur dioxide. Copenhagen, Denmark: World Health Organization.
- Wingfors, H., L. Hägglund, and R. Magnusson. 2011. Characterization of the size-distribution of aerosols and particle-bound content of oxygenated PAHs, PAHs, and n-alkanes in urban environments in Afghanistan. Atmos. Environ. 45:4360–69.
- World Health Organization. 2003. Health aspects of air pollution with particulate matter, ozone and nitrogen dioxide: Report on a WHO working group. Copenhagen, Bonn, Germany: WHO Regional Office for Europe.
- World Life Expectancy. 2017. WORLDHEALTHRANKINGS. Global Life Partners.
- Wu, C. H., S. Y. S. Wang, and -H.-H. Hsu. 2018. Large-scale control of the Arabian Sea monsoon inversion in August. Clim. Dyn. 51:2581–92.
- Yu, G., F. Wang, J. Hu, Y. Liao, and X. Liu. 2019. Value assessment of health losses caused by PM2.5 in Changsha City, China. Int. J. Environ. Res. Public Health 16:2063.