
 ?Mathematical formulae have been encoded as MathML and are displayed in this HTML version using MathJax in order to improve their display. Uncheck the box to turn MathJax off. This feature requires Javascript. Click on a formula to zoom.
ABSTRACT
This study is to analyze geotechnical properties and biological status of undisturbed municipal solid waste (MSW) associated with depth by using a large-diameter borehole sampling method. Through the method, a 28 m-borehole with 0.8 m of the diameter was drilled into the MSW body consisting of ten-lift layers of waste placed over 4000 days in an operating landfill. MSW sample cuttings were collected from the field site, weighted, and transferred to a laboratory for additional experiments to measure various properties such as moisture content, constituent characterization, unit weights, specific gravity, decomposition state, saturation, and compression rates with regard to waste depth. Also, the methane production obtained from MSW decomposition tests indicated that waste mass was relatively consistent throughout the depth of borehole and had not reached the accelerated production phase of methane. The wet and dry unit weights of the MSW sample with different depths produced excellent trends of the first-order rate with vertical stress. First Oder Rate Equation (FORE) analysis indicated that the maximum total and dry unit weight of MSW ( and
) achieved at depth in the waste mass were 12.9 kN/m3 and 10.6 kN/m3, respectively. Based on the waste shrinkage ratio (WSR) defined as the initial dry unit weight divided by succeeding dry unit weight, the height of the original MSW pile was estimated to be 40.5 m. Different compression parameters, including aggregated MSW compression index (Cc), modified compression index (CCE), and compression ratio parameter (Cc’), were comparably evaluated, which can be beneficial to understand compressibility and settlement processes in a landfill.
Implications: Geotechnical properties and biological status of undisturbed municipal solid waste (MSW) associated with depth were analyzed by using a large-diameter borehole sampling method. The wet and dry unit weights of the MSW sample with different depths produced excellent trends of the first-order rate with vertical stress. Based on the waste shrinkage ratio (WSR) defined as the initial dry unit weight divided by succeeding dry unit weight, the height of the original MSW pile was estimated to be 40.5 m. Different compression parameters, including aggregated MSW compression index (Cc), modified compression index (CCE), and compression ratio parameter (Cc’), were comparably evaluated, which can be beneficial to understand compressibility and settlement processes in a landfill.
Introduction
US Environment Protection Agency (US EPA) reports that more than 137 tons of municipal solid waste (MSW) were landfilled in more than 1700 sites in the US in 2015 (US EPA Citation2019). The size of the landfill becomes larger, especially in urban areas, since it is difficult to obtain governmental approval and public acceptance in the area for securing new landfill sites (Dooley et al. Citation1993). To increase the life cycle of a landfill and enhance the efficiency of landfilling, it is useful to more fully understand the disposed waste behavior because MSW typically includes organic fraction as well as compressible material such as plastic and paper. The volume will be changed dramatically with time and the degree of the decomposition of MSW (Bareither, Benson, and Edil Citation2012; Bjarngard and Edgers Citation1990; Edil, Ranguette, and Wuellner Citation1990; McDougall Citation2007; Park, Lee, and Do Citation2002; Sharma and De Citation2007; Sowers Citation1973). However, the geotechnical aspect of designing landfills has always been challenging for engineers because the heterogeneous nature of MSW makes predicting accurate mechanical behavior difficult. Accordingly, there have been many design-related problems in landfills, such as slope stability failure, unpredicted differential and total settlement, cracking, and leachate seepage. Furthermore, large compressibility, biological decomposition and the change in MSW properties associated with the temporal variability such as aging and overburden pressure challenge the accurate determination of geotechnical properties (Dixon and Jones Citation2005; Gabr and Valero Citation1995; Landva and Clark Citation1990; Machado et al. Citation2010; Reddy et al. Citation2009; Zekkos et al. Citation2005; Zhan, Chen, and Ling Citation2008). Thus, there is a strong need for improving our understanding of the undisturbed properties of MSW.
However, there are limited efforts to successfully measure undisturbed geotechnical index properties of MSW associated with depth. Gabr and Valero (Citation1995) conducted a comprehensive geotechnical testing program for aged samples. They collected a total of 1.13 m3 of 100 mm inside diameter hollow stem auger cuttings used for borings of 30 and 42 m deep. However, the result showed a weak trend of the properties with borehole depth due to highly disturbed samples. The mechanical and biological behavior of MSW was investigated and formulated to predict waste behavior by several researchers (Daniel Citation1993; Dixon and Langer Citation2006; Dixon, Langer, and Gotteland Citation2008; Landva and Clark Citation1990; Mehta et al. Citation2002). Reddy et al. (Citation2011) measured the geotechnical properties of synthetic MSW based on different stages of biodegradation. They evaluated geotechnical properties such as hydraulic conductivity, compressibility, and shear strength of synthesized MSW before and after degradation in bioreactor cells. Their results indicated significant changes in geotechnical properties with the advancement in biological decomposition. Zekkos et al. (Citation2010) classified the physical and geotechnical characterization of MSW using large boreholes. However, their research lacked a geotechnical analysis of MSW materials, specifically with respect to borehole depth.
The objective of this research is to accurately quantify and analyze the geotechnical properties and biological status of undisturbed MSW depending on depth. Various engineering properties, including wet and dry unit weight, moisture content (MC), field capacity, which is the volumetric moisture content after a prolonged period of gravity drainage, void ratio, degree of saturation, waste composition, and degree of degradation, were determined and analyzed from large diameter auger paddle bucket MSW samples, which were collected from an operating landfill. Also, biodegrading MSW and production phase of methane were evaluated associated with the depth of the borehole. Based on the results, the relationship between the variables and burial depth or vertical total stress was suggested. A waste shrinkage ratio (WSR) was proposed to estimate the theoretical height of the original MSW pile were no compression to have occurred following placement of waste. Also, aggregated MSW compression index (Cc), modified compression index (CCE), and compression ratio parameter (Cc’) were used to evaluate compressibility and settlement processes in piled layers of MSW.
Materials and methods
Municipal solid waste samples obtained from a Borehole assessment method
Through MSW Borehole Assessment (MBA), which is the procedure used to evaluate the MSW cuttings extracted from the boring, a 28 m− deep borehole out of 31.9 m waste thickness with a large diameter of 0.8 m, shown in , was completed by using a large auger machine at Bluff Road Landfill (Lincoln, NE). To reduce the uncertainty of the heterogeneity of MSW nature, the large diameter of the borehole was used. The boring location was chosen based on the information of waste aging in the landfill. The total depth of the cell at the time the boring was performed was comprised of 10 lifts of approximately 4.0 m (± 0.9 m), with one lift being the insulating layer (22.3 years old), the bottom five lifts were placed approximately every 1–1.5 years, and the last lift was placed 2.3 years before borehole completion. shows graphically the progress of waste fill versus time. The overall average rate of placement of fill or soil cover and MSW combined is 0.8 kg/day over the nearly 4000 days interval in which waste was placed.
Figure 1. 81.2 cm OD Auger Bucket
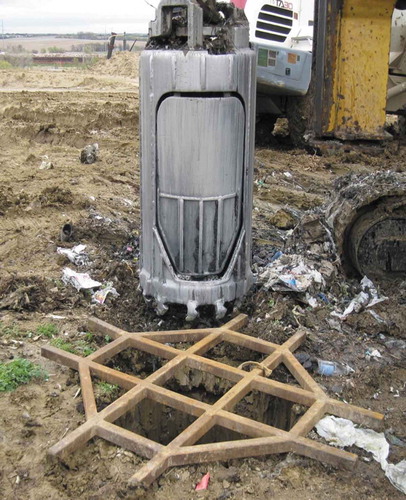
Figure 2. Depth vs age of waste at time of borehole completion
The MSW cuttings segment sample was collected over regular depth intervals. The boring depth was directly measured after the collection of each borehole segment sample. The typical borehole segment length was 3.05 m, as this volume was sufficient to assure a reasonable degree of precision ~ ±1% in determining the segment mass and volume. The MSW cuttings collected for each borehole segment were weighed and, after that stockpiled for collection of laboratory sub-sampling and further characterization. Nine MSW cutting segments with an average weight of 2,086 kg batch were loaded into a dump truck, which was conveyed to the landfill scale house to be weighed. By subtracting the truck or roll-off tare weight from the gross loaded vehicle weight, the gross wet weight (WMSW gross wet) of the segment cuttings is determined. The gross wet weight consisted of both MSW and buried soil cover layers intermixed in the segment samples.
Representative samples of 3.0% to 5.0% of the gross wet segment cutting weight were immediately packaged in 208 L drums and returned to the laboratory for further classification and testing. These representative samples had an average wet weight of 77.6 kg and consisted exclusively of MSW material. These drummed MSW samples were tested for other waste characteristics such as moisture content, composition, and other visual, physical properties. Identifiable buried soil cover layers identified in the soil stockpiles were separately sampled, containerized and transferred to a private geotechnical testing laboratory.
Specific gravity and unit weight of MSW samples
Each of the nine segments prepared from stockpile MSW drum samples was transported to the University of Nebraska-Lincoln Geotechnical laboratory for further tests of moisture content, constituent characterization. An average moisture content of each MSW contained in each drum was obtained by the dry gravimetric moisture content of several representative drum sub-samples. The average the weight of these sub-samples was about 8.8% of the total drum wet weight. Specific gravity was computed by calculating the dry volume of each constituent based on known specific values of each constituent category and borehole geometric dimensions. It is assumed that each soil layer within each segment has the same moisture content and unit weight properties as the samples obtained from the corresponding segment waste cutting stockpile. The total wet weight and dry weight of MSW ( and
) within each segment can be computed.
MSW constituent
Representative average moisture content (MC) for each segment drum was determined, and the remainder of waste in each drum sample was sorted into twelve major constituent categories. The constituent types considered consisted of wood, cardboard, paper, plastic, textiles, concrete, rubber, metal, aluminum, glass, tin, soil, and other or soil-like unidentifiable waste. The MSW segment constituent wet weights were used to calculate constituent dry weights. Subtracting the weight of water attributed to the porous (non-soil) MSW from the wet weight of the porous (non-soil) MSW yields the dry weight of the porous (non-soil) MSW that constitutes the remainder of the drum contents. The dry weights of each constituent category were compared to the relative proportion of MSW constituents to the US, Nebraska Department of Environmental Quality, and other states, as shown in (Bareither, Benson, and Edil Citation2012; NDEQ Citation2009, US EPA Citation2006).
Table 1. Constituent comparison of benchmarks studies of MSW with borehole samples
The benchmark studies included waste disposal trends during years when the borehole waste profile was being deposited, and therefore, represent the potential average character of the waste placed in the vicinity. Constituent studies in Nebraska show a high proportion of paper waste disposed in landfills. However, the major difference between the current sample with the other studies is a shift of paper waste to the “other” category due to degradation and/or vagaries of heterogeneity. The “other” category generally included wood, food scraps, yard waste and miscellaneous inorganics. However, in the Nebraska study, “other” included food scraps, yard waste, diapers as well. In the borehole characterization, “other” included wood, concrete, and unidentifiable soil-like fines as well as miscellaneous material.
MSW decomposition test
Representative samples of the segment drum samples obtained from the borehole stockpiles were transferred at 4°C to North Carolina State University for determination of the decomposition stage. The laboratory testing involved the quantification of methane yield, and the cellulose (C), hemicellulose (H) to lignin (L) ratio. The employed methodologies are described by Wang, Byrd, and Barlaz (Citation1994), Hossain, Gabr, and Barlaz (Citation2003), and Wang et al. (Citation2015). According to Hossain, Gabr, and Barlaz (Citation2003), cellulose and hemicellulose are the main decomposable contents of the waste, and lignin is the other organic constituent of waste. Lignin is at best only slowly degradable under methanogenic conditions and interferes with the decomposition of cellulose and hemicellulose by physically impeding microbial access to these degradable carbohydrates. According to Barlaz, Schaefer, and Ham (Citation1989), MSW decomposition occurs in four phases that are initiated upon burial of the waste. These phases are described as an aerobic phase, anaerobic acid phase, accelerated methane production phase, and decelerated methane production phase. In the aerobic phase (Phase 1), the oxygen entrained in the refuse at burial is consumed. CO2 will be the major gaseous product, and there will be little to no cellulose and hemicellulose biodegradation. In the anaerobic acid phase (Phase 2), carboxylic acids (acetic, propionic, butyric) accumulate and the pH decreases. Phase 2 is characterized by acidic leachate, little gas production, and little to no cellulose and hemicellulose decomposition because environmental conditions are not suitable for the decomposing bacteria. In the accelerated methane production phase (Phase 3), suitable environmental conditions develop, and the methane production rate increases to a maximum value; the accumulated carboxylic acids are converted to CH4 and CO2; the pH increases; and cellulose and hemicellulose decomposition begin. In the decelerated methane production phase (Phase 4), the methane production rate decreases, carboxylic acids are depleted, and there is an increase in the rate of cellulose plus hemicellulose hydrolysis. Cellulose and hemicellulose hydrolysis limits methane production in Phase 4.
Experimental results
MSW specific gravity and unit weight
shows the resulting wet and dry unit weights of each segment for MSW layers. The wet unit weight of MSW was calculated by subtracting the soil segment wet weights from the gross cuttings segment wet weight. Using the aggregated moisture content for each segment allows the computation of the dry unit weight of MSW in each segment.
Table 2. Wet and dry unit weights by MSW segment
shows the specific gravity, void ratio, and degree of saturation of MSW layers within each segment. Specific gravity for segment 6 was considered outlier due to the disproportionate amount of wood in the drum sample. The aggregated specific gravity, wet and dry sample weights of each segment allows us to compute the dry unit weight of each drum segment sample. Bareither, Benson, and Edil (Citation2012) reported that specific gravity increased linearly with higher levels of decomposition (i.e., higher methane yield), corresponding to the loss of organic materials (e.g., paper) that have high volume and low mass. The range in MSW specific gravity reported was from 1.65 to 1.90. Duraisamy, Huat, and Aziz (Citation2007) also reported data and a series of equations formulated by other researchers that show a linear correlation of increasing specific gravity with decreasing organic content. A lack of a downward trend in Gs with increasing depth and a corresponding increase in age of waste is a useful observation in that it may indicate that the waste column is of similar age from a degradation standpoint. Hanson et al. (Citation2010) evaluated the range in specific gravity () for the waste compaction study and estimated that
ranged from 1.4 to 1.6 and concluded it was likely closer to 1.55 using a line of optimums analysis to estimate the appropriate position of the zero air voids curve. The computed average Gs for the MSW encountered in borehole was 1.63, which is consistent with the back-calculated value (Hanson et al. Citation2010).
Table 3. Specific gravity, void ratio and degree of saturation by MSW segment
Waste compressibility index
The Waste Compressibility Index (WCI) was calculated according to the definition by Bareither, Benson, and Edil (Citation2012):
where OW is organic waste, which is the sum of biodegradable material percentage, γw is the unit weight of water, and γ MSW id is the initial dry unit weight of MSW. According to Bareither, Benson, and Edil (Citation2012), a high WCI represents more compressible waste with high dry weight and low dry density and/or high organic waste. shows that there is no strong correlation of organic waste with depth (), but the WCI decreases with increasing depth (
). This is consistent with the expectation that waste should become less compressible with increasing depth.
Figure 3. Organic waste (OW) and waste compressibility index (WCI) variation with depth
MSW biological degradation
shows the relative consistency of the C, H, L, and the (C + H)/L ratio vs. depth as presented by the linear dashed trend lines for each variable. The outliers were excluded from the trend line generation. With the exception of segment 3, the remaining segments produced test results that fell in a relatively tight grouping. Cellulose (C), hemicellulose (H) and lignin (L) percentages averaged 15.2%, 4.46%, and 10.7%, (St Dev was 2.7%, 1.3% and 2.3%) respectively. The average (C + H)/L ratio was 1.73 with a standard deviation of 0.514 including outlier and was 1.90 with a standard deviation of 0.35, excluding outlier, and the Biochemical Methane Potential (BMP), including outlier, averaged 0.087 with a standard deviation of 0.036 and averaged 0.094 with a standard deviation of 0.032, excluding outlier. The implication is that biodegradation is relatively uniform throughout the entire profile.
Figure 4. Variations of (a) Cellulose, hemicellulose and lignin; (b) (C + H)/L ratio with borehole depth
The degree of biodegradation of the borehole waste was evaluated by comparing the literature results obtained from the same tests with representative samples of MSW (Hossain, Gabr, and Barlaz Citation2003). According to Hossain et al., it was found that the (C + H)/L ratio decreases as the degradation advances from 2.5 for Phase 1 (aerobic) to 0.4 for Phase 4 (decelerated methane production). Similarly, the BMP increases from 0 liters when the fresh waste is first buried, to peak production >100 L in Phase 3 (accelerated methane production). Thereafter, the BMP subsides to near 0 L at the end of Phase 4.
shows the borehole results compared to Hossain, Gabr, and Barlaz (Citation2003) results for synthesized samples in each of the four degradation phases. Based on the (C + H)/L ratios and the BMP for the specimen tested for the borehole, each segment appears to be in Phase 2, with the exception of segment 3. In segment 3, the (C + H)/L ratio fits into Phase 3, while the BMP is clearly within Phase 2. Based on this testing, the waste profile encountered in borehole appears to still be in the anaerobic acid phase and has not yet transitioned into the accelerated methane generation phase.
Table 4. MSW segment biodegradation
The waste mass is relatively consistent throughout the full depth of the boring, and that the waste has not yet progressed to the accelerated methane production phase. According to , more than 70% of waste constituent are among the category of “other” which mostly includes non-readily biodegradable material. Based on the results, the slow biodegradation process of MSW borehole samples can be related to the waste constituent. Also, this means that the observed settlement of the waste profile is mostly due to primary compression and mechanical creep, and that the waste has experienced only minimal settlement due to biological compression.
Analysis of MSW properties with depth
Relationship between MSW unit weight and total vertical pressure
shows various unit weights versus vertical stress. Gross unit weight is the aggregate wet unit weight of all waste and soil cuttings by segment. This includes both the wet weight of MSW and the wet weight of soil. After extracting the wet weight soil layers in each segment based on the lithology observed in the borehole photo log, the result is the MSW only wet unit weight (
). Finally, the MSW only dry unit weight (
) is depicted. Trend lines using the first-order rate equation produces excellent R2 correlation in the MSW unit weights when the effect of the soil layers has been removed and appears to reflect the impact of increasing vertical loads on the compression of the relatively compressible MSW. The correlation coefficient (R2) of the gross unit weight plot is much lower due to the random vertical distribution of the buried soil layers.
Figure 5. MSW unit weights variations with vertical stress
A First-Order Rate Equation (FORE) analysis proposed by Handy (Citation2002) was used to present the relationships between the wet and dry unit weight of waste vs. vertical stress. In this analysis, the measured quantity (Y) that is believed to approach an ultimate value () is either the wet (
) or dry (
) unit weight of waste. The independent variable is the formation of vertical pressure (
). The results of these analyses indicate that the maximum
and
achieved at depth in the waste mass would be 12.9 kN/m3 and 10.6 kN/m3, respectively. In this case, the
had maximum correlation coefficients (
) of 0.975 and 0.99, respectively, at the noted wet and dry unit weights. Based on the FORE equations of wet and dry unit weights versus vertical stress 95% of the ultimate unit weight predicted by the FORE analyses are achieved at 38.1 m and 41.8 m, respectively, for wet and dry unit weights. The FORE analysis for
results in an equation where the value plotted on the y axis is log10 (
) and the linear equation that is equal to the y value is
, where
in this case is the vertical stress
. Having performed a trial and error evaluation on this relationship the maximum correlation coefficient is achieved when
is 10.59 kN/m3. Solving for
in terms of
results in EquationEquation (2)
(2)
(2) :
The results of FORE analysis show a to be −0.002354 and b is 1.567458 while is in kPa. Similarly, the FORE analysis for
results in EquationEquation (3)
(3)
(3) :
FORE analysis results showed an equal to −0.00126 and b equal to 1.606 while is in kPa. EquationEquation (3)
(3)
(3) is representative of MSW that remains unsaturated with depth. This is most likely not a realistic expectation for landfills in non-arid environments or for landfills that have been moisture augmented to enhance and accelerate biodegradation. These high moisture content landfills will potentially produce a waste mass that becomes saturated with depth. In this circumstance, the maximum
will be limited to a maximum moisture content at saturation expressed by
. To estimate the
at saturation, we return to the EquationEquation (2)
(2)
(2) and add the weight of moisture required to achieve saturation. Therefore, the maximum possible wet unit weight that can be anticipated with increasing vertical stress is obtained when EquationEquation (2)
(2)
(2) is rewritten as EquationEquation (4)
(4)
(4) as:
The relationships are shown in . The usefulness of this series of equations is that they can be employed in predicting the unit weights of waste columns having varying waste and soil layer profiles. This is particularly useful in developing an understanding of the impact of lift thickness and soil cover thickness on the efficient use of landfill airspace.
Figure 6. MSW unit weights versus vertical stress extrapolated using FORE analysis
The intercept for dry unit weight at kPa is approximately 4.79 kN/m3. This is theoretically the unit weight of MSW at the time the waste is compacted into the working face. This seems to be a reasonable value considering the study performed by Hanson et al. (Citation2010) where field compaction tests resulted in MSW maximum dry unit weights ranging from 4.40 kN/m3 to 6.20 kN/m3 for compactive energy levels of low and high, respectively, at optimum moisture contents on the order of 30%. The moisture content in segment 1 at the time the borehole was completed was approximately 32%. Hanson et al. (Citation2010) further reported that laboratory compaction tests imparting 1 to 4 times of Modified Proctor (ASTM D1557-12e1 Citation2012) for MSW samples having moisture contents between 30% and 32% attained a compacted dry unit weight ranging from 4.44 kN/m3 to 5.25 kN/m3. The current MC in segment 1 MSW was 32.5%, and the last lift (Lift #10) of waste was placed on 29 January 2012. This agrees very well with Hanson et al. (Citation2010), who reported that winter field placement conditions resulted in the field moisture content of about 31%. The predicted initial compacted dry unit weight at the surface of the working face or at zero depth of embedment compares favorably with the ranges reported by Hanson et al. (Citation2010) for both the laboratory and field testing.
It is reasonable to assume that the surface of the final Lift #10 or segment 1 was placed at an initial MC near the observed segment average MC of 32.5%, which results in the imputed wet unit weight [ kN/m3] is 6.35 kN/m3. The FORE analysis for the wet MSW segment unit weights recorded for the borehole results in a wet unit weight at the surface of 6.57 kN/m3, which in turn results in the moisture content of 36.8%.
Relationship between MSW unit weight and Borehole depth
As depicted in , by removing the randomizing impact of randomly positioned soil layers in the waste profile, a highly correlated relationship between MSW unit weight variations with the change in vertical pressure was established. Using the correlation between vertical stress and depth in EquationEquation (5)(5)
(5) , the variation of MSW unit weights were correlated with depth as shown in EquationEquations (6
(6)
(6) ) and (Equation7
(7)
(7) ).
Waste shrinkage ratio
A Waste Shrinkage Ratio (WSR) is defined as the initial upper most dry MSW unit weight () divided by succeeding dry MSW unit weights (
):
The WSR can be determined at the midpoint of each segment and plotted versus the midpoint vertical stress (), as shown in . It is useful to be able to consider any portion of an existing column of MSW and estimate the original thickness of that portion of the column as it was initially compacted in place prior to having experienced compression due to its subsequent burial with successive lifts of waste. This can be accomplished since the dry unit weight of the entire waste column is known. It is assumed that the waste mass is nominally uniformly biodegraded, without substantial loss of waste mass. The same mechanical compaction process (e.g., compactive energy) has been imparted by the use of the same trash compact or equipment being operated in the same fashion throughout the period that waste was placed in the area. Based on the prior data analysis, the change in vertical stress over time can influence the change in unit weight with depth. The age of waste buried at the borehole ranges from over 800 days to more than 5000 days.
Figure 7. Vertical stress variations with waste shrinkage ratios (WSR)
By dividing the total thickness of the MSW layers in each segment by the, the original MSW layer thickness just after waste placement can be determined. The initial height of waste before any settlement would have been 45% greater than the current borehole depth of 27.9 m; this column would have been 40.5 m high.
Field capacity and degree of saturation
Field capacity is defined as the moisture content that represents the total amount of liquid that is retained in waste subject to pull of gravity. Field capacity varies with the vertical pressure within the waste mass and is estimated using an equation proposed by Tchobanoglous, Theisen, and Vigil (Citation1993), Huitric, Raksit, and Haug (Citation1979) and Huitric, Raksit, and Haug (Citation1980):
where MCFC is the field capacity and σv is the overburden pressure (in kPa) calculated at the mid-height of the subject waste lift. shows that the field capacity of typical MSW decreases with increasing dry unit weight and depth. The moisture content of the waste mass is typically well below the estimate of the field capacity (about 65% of MCFC), except for segments 4 and 8, which are 80% and 100% of MCFC, respectively. In the case of the borehole the average segment also decreases with depth, although this is not as pronounced as the decrease in computed field capacity moisture content. This results in a slight trend of the
gradually approaching the field capacity with depth in the segments that do not contain perched leachate (outlier segments 4 and 8). As the field capacity and
diminish and converge, there is a predictable corresponding increasing trend in the degree of saturation with depth. The high saturation observed in segments 4 and 8 appears to be related to leachate seeps. These seeps are perched on intermediate cover layers (identified in the downhole photo-log and videography at these locations) that act as confining layers that interrupt the downward migration of excess moisture. These field capacity exceedances are treated as outliers.
Figure 8. Moisture content variables versus borehole depth
After removing the outliers related to the most productive leachate seeps in segment 4 and above segment 8, a good correlation results between percent saturation of MSW () with borehole depth (d) which can be expressed with the following equation:
where d is depth in m, none of the segments approached 100% saturation even though segment 4 and lower portion of segment 8 and the uppermost portion of segment 9 (soil layer) contained the most significant leachate seeps. The average MCMSW indicate that the saturated portion of these MSW layers was relatively thin but that the residual moisture content approaches the field capacity and, in the case of outlier segment 8 is observed to be precisely 100%.
There is a considerable gap between the average moisture content of the waste in each segment and the imputed field capacity where is approximately 60% of field capacity, except for the two segments where active leachate seeps were noted on the downhole video record. While the fresh surficial waste layer (working face) is exposed to the weather elements prior to receiving daily cover, it is expected that the free moisture would migrate downward relatively uniformly across the entire surface. The vertical penetration would progress as the FC was exceeded and free moisture was advectively pulled downward through tortuous porous channels. However, following the placement of cover soil this diffused flow path would be considerably reduced, and vertical migration of free moisture would occur episodically only where the soil cover was thin or completely absent. Thereafter, advective leachate flow would be lateral, and the direction of flow would be dictated by the orientation of the underlying buried cover layer.
The relatively consistent moisture content in each segment across the full depth of the borehole may have less to do with advective free fluid flow and more to do with the transport of water vapor in the form of humidity. Anecdotally, newspaper taken from the cuttings stockpiles at various depths appeared to be damp but far from saturated, almost like it had been recently taken from a massive humidor. This observation may be useful in better understanding how moisture moves through the waste mass as landfill management continues to look for ways to enhance the production of methane.
Estimation of MSW compression parameters
A useful means of evaluating the compressibility of MSW is to plot the change in void ratio (e) versus total vertical pressure (). shows the changes in void ratio vs. log
. The slope yields the compression index Cc. The
correlation is at 0.90, and Cc yields 1.26, which is consistent with values reported by Duraisamy, Huat, and Aziz (Citation2007) for the more highly decomposed hemic peat that was 1.43 to 2.99 and for sapric peat was 1.24 to 2.63. The less decomposed fabric peat soils that they studied had Cc ranging from 1.878 to 3.627 due to the significantly higher proportion of recognizable vegetative organic matter.
Figure 9. A compression curve associated with aggregated void ratio versus vertical pressure for borehole sample segments
Since initial conditions are not available to allow tracking of the settlement of the buried lifts present within the borehole profile, the rate of settlement of either individual MSW layers or the entire column of waste cannot be recreated. Only the current state of waste is available, and only limited inferences can be made as to the processes these layers experienced to arrive at their current positions and conditions. For this reason, immediate (primary or elastoplasticity) settlement cannot be separated from secondary (visco-plastic and bio-degradation – induced) settlement. The aggregated compression index for MSW was estimated as depicted in , where Cc = 1.26. However, comparing the Cc obtained from with other values obtained from literature might provide some insight into the role of secondary settlement as a part of the settlement process.
Zekkos et al. (Citation2006) investigated waste compressibility by developing a modified compressibility index (CCE) which is defined “as the slope of the volumetric strain-log versus vertical stress plot assuming no degradation,” it can be shown that for material that has a total unit weight of at an initial vertical effective stress
and a total unit weight of
at vertical effective stress
The equivalent modified compression index is:
In the case of the borehole sample, there is no significant saturated condition and the pore pressure (u) = 0, therefore, Since
is known at the midpoint of each segment, the gross wet unit weight (
) for each segment and the void ratio (e) for the MSW portion of each segment, a modified compression indices for the gross MSW and soil mixture and for the MSW can be computed separately. The average CCE gross for the nine segments is 0.21 with a standard deviation of 0.10, which corresponds with the range reported by Zekkos et al. (Citation2006) of typical waste between 0.13 and 0.22.
The CCE for only the MSW component of the waste column is calculated using the MSW void ratio. The average of CCE was found to be 0.38, with a standard deviation of 0.051 for the nine cuttings segments. This falls into the range reported by Zekkos et al. (Citation2006), corresponding with low near-surface in-place waste. However, the borehole values excluded the buried soil layer components, while the data set Zekkos included the buried soil layers and the intervening MSW layers commingled.
The compression rate of MSW was estimated, while the potential intermediate cover layers corresponding to lift sequences placed in the area of borehole were demarked. A reasonable record of the date of waste placement was obtained since the time that the particular segment of waste was placed. This is a cursory evaluation because it cannot be ensured that the intermediate cover layers noted above are actually the layers marking the top of the identified buried lifts. It is useful to explore the rate of waste compression of MSW within the borehole profile.
Given the assumption that the soil layers denote the top of successive buried lifts, an age of waste to each of the underlying waste intervals can be ascribed. To determine a compression strain that corresponds to the lift interval, the dry unit weights within each MSW segment that constitute the lift interval are prorated based on the total thickness of MSW layers in the comprising segments. The compressive strain for each lift at the time of completion of the borehole () is computed using the following equation:
where is the dry unit weight of MSW immediately following working face compaction, and
is the prorated dry unit weight of MSW within lift i at the time borehole was completed. A plot of
vs. the log of the age of waste in days (t) is shown in . There is a strong relationship between aggregated immediate compression strain changes and the age of waste.
Figure 10. Aggregated immediate compression strain (EquationEquation 11(11)
(11) ) changes with age of waste
The period that MSW has had to undergo compression is typically long (~ >1000 days) so that it is likely that each lift of waste has experienced the primary settlement typically occurs within the first four months after load placement (Sharma and De Citation2007). MSW then experiences secondary settlement that can come in two forms; Settlement under self-weight that is caused by the imposition additional waste lifts on the underlying waste layers and settlement induced from externally imposed loads such as a structure or additional earthen fill (i.e., final cover soil layer). The main difference between these is that in the case of waste self-weight, the overlying waste also undergoes settlement. Sharma notes that frequently external loads are applied long after waste is applied at closure in the case of final cover and long after closure in the case of additional structures. Sharma concludes that typically self-weight settlement is completed by the time externally applied loads are introduced and that they can, therefore, be considered separately. The implication is that self-weight settlement occurs over a period of years.
Bareither et al. (Citation2011a) developed a conceptual model for MSW settlement in bioreactor landfills, which encompasses three processes: immediate compression; mechanical creep; and biocompression. McDougall (Citation2007) also proposes a model for load-induced (immediate compression of primary settlement), creep, and biodegradation induced settlement. These processes are brought about by environmental factors such as the amount and nature of organic matter, moisture content, moisture quality, microbial populations and pH, which are not constrained to evolve in a simple time-dependent manner.
A compression ratio parameter (Cc’) suggested by Bareither, Benson, and Edil (Citation2011b) was used to comparably evaluate the compressibility of MSW:
where is immediate compression strain, whereas the strain inferred in the borehole is an aggregated strain, which includes immediate strain but also encompasses considerable mechanical creep and a modicum of biodegradation induced settlement. Cc’ is the compression ratio and
is the existing vertical effective stress (total stress here since the column of waste is predominantly unsaturated and no significant pore pressure exists). The
is the additional vertical effective stress that induces compression.
Computing Cc’ for each segment by setting the uppermost segment as the base compressive state with which to compare all underlying segments, a Cc’ for each segment is obtained. The range in the compression ratio is from 0.62 to 0.82, with an average of 0.72 and a standard deviation of 0.066. The range in values obtained for the borehole appears to be about three times those reported by Bareither, Benson, and Edil (Citation2011b), which ranges from 0.18 to 0.39. shows the variation in Cc’ versus waste age and does not show any significant trend with age. This can be expected since the borehole is in a relatively similar decomposition phase, therefore the compression index of waste materials is not significantly changed by the effect of decomposition.
Figure 11. MSW compression ratio parameter (Cc’) (EquationEquation 13(13)
(13) ) versus age of waste by lift
Conclusion
MSW borehole assessment was used to evaluate mechanical and biological properties of a waste column in Lincoln Bluff Road Landfill, Nebraska, up to 28 m-depth. This method allowed the segregation and subsequent measurement of MSW and soil buried cover layer properties and, therefore accurate determination of segment unit weights, field capacity, saturation, specific gravity and biological properties versus depth and total vertical stress. The analysis of biological properties and specific gravity showed that the waste column is in a similar stage of biodegradation, despite that deeper layers had been deposited years before top layers. This similar biodegradation stage can be related to the low organic waste portion in the waste column.
The Waste Shrinkage Ratio (WSR), which is the ratio () by comparing uppermost segment MSW dry unit weight versus succeeding deeper segment MSW dry unit weights, was developed to back-calculate the thickness that a buried MSW layer would have been original. The potential intermediate cover layers were able to be demarked in order to estimate the possible rate of compression. Also, an aggregated MSW compression index (Cc) for the entire waste column was determined to be 1.26 with an R2 = 0.90. The average of CCE was found to be 0.38 with a standard deviation of 0.051 for the nine cuttings segments, which is in the range reported by Zekkos et al. (Citation2006), corresponding with low near-surface in-place waste. The compressive strain was calculated based on dry unit weights and was related to the age of waste. The compression ratio parameter (Cc’) was calculated for each segment according to Bareither, Benson, and Edil (Citation2011b); however, due to the relatively constant decomposition stage of each segment, Cc’ was not found to be correlated to the waste age. Even though the comparison of MSW compressibility showed relatively good agreement that this study was similar to those of other existing results in the estimation of the MSW compressibility, the potential exists to expand the testing cases to be generalized or extrapolated to other landfills.
Nomenclature
| MSW | = | municipal solid waste |
| = | MSW wet unit weight | |
| = | MSW dry unit weight | |
| MC | = | moisture content |
| MCFC | = | field capacity moisture content |
| C | = | cellulose |
| H | = | hemicellulose |
| L | = | lignin |
| = | specific gravity of MSW | |
| Vmsw | = | MSW volume |
| Ve | = | volume of void |
| Vm | = | volume of the liquid phase filled voids |
| WCI | = | waste compressibility index |
| OW | = | organic waste |
| = | water unit weight | |
| = | initial dry unit weight | |
| = | wet soil unit weight | |
| = | initial upper most dry MSW unit weight | |
| = | succeeding dry MSW unit weights | |
| = | vertical pressure | |
| = | additional vertical effective stress | |
| d | = | borehole depth |
| e | = | void ratio |
| Cc | = | aggregated MSW compression index |
| CCE | = | modified compressibility index |
| Cc’ | = | compression ratio parameter |
| = | initial vertical stress | |
| = | total unit weight at | |
| = | total unit weight at | |
| WRC | = | waste shrinkage ratio |
| SMSW | = | MSW saturation |
| = | immediate compression strain | |
| = | compressive strain at the time of completion of borehole | |
| = | dry unit weight of MSW following working face compaction | |
| = | prorated dry unit weight of MSW at lift i |
Disclosure statement
No potential conflict of interest was reported by the authors.
Additional information
Notes on contributors
John Hartwell
John Hartwell, Ph.D., P.E. has over 45 years of experience as a consulting civil engineer in private practice providing expert and forensic consulting geotechnical, geo-environmental, solid waste and civil engineering services. Dr. Hartwell earned his BSCE and MSCE from Iowa State University in 1971 and 1974, respectively, and earned his Ph.D. in civil engineering at the University of Nebraska at Lincoln in 2015. Dr. Hartwell has more than 40 years of consulting engineering experience. He specializes in geotechnical, geo-environmental, solid waste and civil engineering consulting and engineering management. He has provided environmental engineering and scientific consulting services throughout the central and western United States. He was a senior consultant with SCS Engineers from 2012 through March of 2020 specializing in solid waste engineering. He acted as the Chief Engineer, Senior Consultant with Aquaterra Environmental Solutions (AES) from 2003 until its merger with SCS in 2012. Prior to AES, Dr. Hartwell was with The Terracon Companies for nearly 20 years where he was a Senior Principal Engineer, President of Terracon Environmental, and Chief Engineer of the Terracon Companies. He was a Project Engineer and Senior Project Manager with Friendswood Development Co, a wholly owned affiliate of Exxon USA between 1977 and 1980 in Houston Texas. Dr. Hartwell also simultaneously had a parallel engineering consulting career as a commissioned Regular Army officer in the US Army Corp of Engineers from 1974 through 2001. He retired in 2001 with a rank of lieutenant colonel.
M. Sina Mousavi
M. Sina Mousavi is a Ph.D. candidate in the Department of Civil and Environmental Engineering at the University of Nebraska-Lincoln. He received his bachelor’s degree in civil engineering from University in Tehran, Iran in 2013 and the M.Sc. degree in civil and environmental engineering from Tarbiat Modares University in Tehran, Iran 2015. He has been working on the evaluation of the multi-physical behavior of municipal solid waste and related projects.
Jongwan Eun
Jongwan Eun, Ph.D., P.E. is an Assistant Professor in the Department of Civil and Environmental Engineering at the University of Nebraska-Lincoln since 2016 fall. Dr. Eun received an M.S. from the University of Texas at Austin, and received his Ph.D. degree from the University of Wisconsin-Madison focused on Geoenvironmental Engineering. Before joining the UNL, he worked as a lecturer and a research associate at New York University Abu Dhabi (NYUAD) with the responsibility of teaching fundamental engineering subjects and leading a global research project related to oil recovery enhancement and innovative farming system with renewable energy. His research interest is focused on waste containment system, GHG emission controls, and radioactive material disposal.
Shannon Bartelt-Hunt
Shannon Bartelt-Hunt, Ph.D., P.E. is the Donald R. Voelte, Jr. and Nancy A. Keegan chair of the Department of Civil and Environmental Engineering at the University of Nebraska-Lincoln. She also maintains a courtesy appointment in the Department of Environmental, Agricultural and Occupational Health in the UNMC College of Public Health. She received her BS from Northwestern University and her MS and PhD from the University of Virginia. Her research focuses on understanding physical and chemical transport processes for contaminants in soil and water, including steroid hormones, antibiotics and microplastics. Her research has a particular focus on contaminant behavior in agroecosystems.
References
- ASTM D1557-12e1. 2012. Standard Test Methods for Laboratory Compaction Characteristics of Soil Using Modified Effort. ASTM International, West Conshohocken, PA. www.astm.org.
- Bareither, C. A., C. H. Benson, and T. B. Edil. 2011b. Compression behavior of municipal solid waste: Immediate compression. J. Geotech. Geoenviron. 138 (9):1047–62. doi:10.1061/(ASCE)GT.1943-5606.0000672.
- Bareither, C. A., C. H. Benson, and T. B. Edil. 2012. Compression of municipal solid waste in bioreactor landfills: Mechanical creep and biocompression. J. Geotech. Geoenviron. 139 (7):1007–21. doi:10.1061/(ASCE)GT.1943-5606.0000835.
- Bareither, C. A., C. H. Benson, T. B. Edil, and M. A. Barlaz. 2011a. Abiotic and biotic compression of municipal solid waste. J. Geotech. Geoenviron. 138 (8):877–88. doi:10.1061/(ASCE)GT.1943-5606.0000660.
- Barlaz, M. A., D. M. Schaefer, and R. K. Ham. 1989. Bacterial population development and chemical characteristics of refuse decomposition in a simulated sanitary landfill. Appl. Environ. Microbiol. 55 (1):55–65. doi:10.1128/AEM.55.1.55-65.1989.
- Bjarngard, A., and L. Edgers. 1990. Settlement of municipal solid waste landfills. Proc., 13th Annual Madison Waste Conf.,Dept. of Engineering Professional Development, 192–205. University of Wisconsin, Madison, WI.
- Daniel, D. E. 1993. Geotechnical practice for waste disposal. London: Chapman & Hall. ISBN 0 412 35170 6.
- Dixon, N., and D. R. V. Jones. 2005. Engineering properties of municipal solid waste. Geotext. Geomembr. 23 (3):205–33. doi:10.1016/j.geotexmem.2004.11.002.
- Dixon, N., and U. Langer. 2006. Development of a MSW classification system for the evaluation of mechanical properties. Waste Manag. 26 (3):220–32. doi:10.1016/j.wasman.2005.02.018.
- Dixon, N., U. Langer, and P. Gotteland. 2008. Classification and mechanical behavior relationships for municipal solid waste: Study using synthetic wastes. J. Geotech. Geoenviron. 134 (1):79–90. doi:10.1061/(ASCE)1090-0241(2008)134:1(79).
- Dooley, F. J., D. A. Bangsund, F. L. Leistritz, and W. R. Fischer. 1993. Estimating optimal landfill sizes and locations in North Dakota.No. 1189-2016-94065. Agricultural Economics Report, Department of Agricultural Economics, North Dakota State University.
- Duraisamy, Y., B. B. K. Huat, and A. A. Aziz. 2007. Engineering properties and compressibility of tropical peat soil. Am. J. Appl. Sci. 4 (10):768–73. doi:10.3844/ajassp.2007.768.773.
- Edil, T., V. Ranguette, and W. Wuellner. 1990. Settlement of municipal refuse. Geotechnics of waste fills—Theory and practice. STP 1070, ASTM, West Conshohocken, PA, 225–39.
- Gabr, M. A., and S. N. Valero. 1995. Geotechnical properties of municipal solid waste. Geotech. Test. J. 18 (2):241–51. doi:10.1520/GTJ10324J.
- Handy, R. L. 2002. First-order rate equations in geotechnical engineering. J. Geotech. Geoenviron. 128 (5):416–25. doi:10.1061/(ASCE)1090-0241(2002)128:5(416).
- Hanson, J. L., N. Yesiller, S. A. Von Stockhausen, and W. W. Wong. 2010. Compaction characteristics of municipal solid waste. J. Geotech. Geoenviron. 136 (8):1095–102. doi:10.1061/(ASCE)GT.1943-5606.0000324.
- Hossain, M. S., M. A. Gabr, and M. A. Barlaz. 2003. Relationship of compressibility parameters to municipal solid waste decomposition. J. Geotech. Geoenviron. 129 (12):1151–58. doi:10.1061/(ASCE)1090-0241(2003)129:12(1151).
- Huitric, R. L., S. Raksit, and R. T. Haug. 1979. In-‐place capacity of refuse to absorb liquid wastes. Second National Conference of Hazardous Material Management, San Diego, CA.
- Huitric, R. L., S. Raksit, and R. T. Haug. 1980. Moisture retention of landfilled solid wastes.The hazardous waste dilemma: Issues and solutions, 186–201. New York, NY: ASCE.
- Landva, A. O., and J. I. Clark. 1990. Geotechnics of waste fill.Geotechnics of waste fills—Theory and practice. West Conshohocken, PA: ASTM International.
- Machado, S. L., M. Karimpour-Fard, N. Shariatmadari, M. F. Carvalho, and J. C. Do Nascimento. 2010. Evaluation of the geotechnical properties of MSW in two Brazilian landfills. Waste Manag. 30 (12):2579–91. doi:10.1016/j.wasman.2010.07.019.
- McDougall, J. 2007. A hydro-bio-mechanical model for settlement and other behaviour in landfilled waste. Comput. Geotech. 34 (4):229–46. doi:10.1016/j.compgeo.2007.02.004.
- Mehta, R., M. A. Barlaz, R. Yazdani, D. Augenstein, M. Bryars, and L. Sinderson. 2002. Refuse decomposition in the presence and absence of leachate recirculation. J. Environ. Eng. 128 (3):228–36. doi:10.1061/(ASCE)0733-9372(2002)128:3(228).
- Nebraska Department of Environmental Quality. March 9, 2009. Final Report –State of Nebraska Waste Characterization Study. Engineering Solutions and Design, Inc., Overland Park, KS, 2175.
- Park, H. I., S. R. Lee, and N. Y. Do. 2002. Evaluation of decomposition effect on long term settlement prediction for fresh municipal solid waste landfills. J. Geotech. Geoenviron. ASCE 128 (2):107–18. doi:10.1061/(ASCE)1090-0241(2002)128:2(107).
- Reddy, K. R., H. Hettiarachchi, J. Gangathulasi, and J. E. Bogner. 2011. Geotechnical properties of municipal solid waste at different phases of biodegradation. Waste Manag. 31 (11):2275–86. doi:10.1016/j.wasman.2011.06.002.
- Reddy, K. R., H. Hettiarachchi, N. S. Parakalla, J. Gangathulasi, and J. E. Bogner. 2009. Geotechnical properties of fresh municipal solid waste at Orchard Hills Landfill, USA. Waste Manag. 29 (2):952–59. doi:10.1016/j.wasman.2008.05.011.
- Sharma, H. D., and A. De. 2007. Municipal solid waste landfill settlement: Postclosure perspectives. J. Geotech. Geoenviron. 133 (6):619–29. doi:10.1061/(ASCE)1090-0241(2007)133:6(619).
- Sowers, G. 1973. Settlement of waste disposal fills. Proc., 8th Int. Conf. on Soil Mechanics and Foundation Engineering, vol. 22, 207–10. Balkema, Rotterdam, Netherlands.
- Tchobanoglous, G., H. Theisen, and S. Vigil. 1993. Integrated solid waste management: Engineering principles and management lssues. New York, NY: McGraw-Hill.
- US EPA. 2006. Solid waste and emergency response. Municipal solid waste generation, recycling and disposal in the United States –facts and figures for 2006. EPA-530-F-07-030, Nov 2007, Supporting Tables 1–23. Washington, DC: From Franklin Associates, A Division of ERG.
- US EPA. 2019. Advancing sustainable materials management: 2017 fact sheet. https://www.epa.gov/facts-and-figures-about-materials-waste-and-recycling.
- Wang, X., B. Florentino, F. Ximenes, and M. A. Barlaz. 2015. Decomposition and carbon storage of selected paper products in laboratory-scale landfills. Sci. Total Environ. 532:70–79. doi:10.1016/j.scitotenv.2015.05.132.
- Wang, Y. S., C. S. Byrd, and M. A. Barlaz. 1994. Anaerobic biodegradability of cellulose and hemicellulose in excavated refuse samples using a biochemical methane potential assay. J. Ind. Microbiol. 13 (3):147–53. doi:10.1007/BF01583999.
- Zekkos, D., J. D. Bray, E. Kavazanjian Jr, N. Matasovic, E. M. Rathje, M. F. Riemer, and K. H. Stokoe. 2006. Unit weight of municipal solid waste. J. Geotech. Geoenviron. 132 (10):1250–61. doi:10.1061/(ASCE)1090-0241(2006)132:10(1250).
- Zekkos, D., E. Kavazanjian Jr, J. D. Bray, N. Matasovic, and M. F. Riemer. 2010. Physical characterization of municipal solid waste for geotechnical purposes. J. Geotech. Geoenviron. 136 (9):1231–41. doi:10.1061/(ASCE)GT.1943-5606.0000326.
- Zekkos, D. P., J. D. Bray, E. Kavazanjian, N. Matasovic, E. Rathje, M. Riemer, and K. H. Stokoe. October, 2005. Framework for the estimation of MSW unit weight profile. Proceedings, Sardinia ‘05, 10th international waste management and landfill symposium, 3–7, Santa Margherita di Pula, Cagliari, Italy.
- Zhan, T. L., Y. M. Chen, and W. A. Ling. 2008. Shear strength characterization of municipal solid waste at the Suzhou landfill, China. Eng. Geol. 97 (3–4):97–111. doi:10.1016/j.enggeo.2007.11.006.