
ABSTRACT
Fuel sulfur emissions control areas have been established in a few marine coastal regions to reduce environmental impacts from combustion of high sulfur residual fuel oil (RFO). For example, in August of 2012, the U.S. began enforcing fuel sulfur limits on certain large commercial marine vessels up to 200 nautical miles (nm) of its coasts as part of a North American Emissions Control Area (NA-ECA), and in January of 2014, the U.S. began enforcing fuel sulfur limits on these vessels within up to 50 nm of Puerto Rico and the U.S. Virgin Islands as part of the U.S. Caribbean Sea ECA (USCAR-ECA). This work evaluates ECA effectiveness at reducing PM2.5 from combustion of RFO by using both spatial analysis, comparing PM2.5 source apportionment at IMPROVE monitoring sites largely impacted by air from either inside or outside of an ECA, along with temporal analysis, comparing RFO combustion impacts pre and post ECA enforcement at sites largely impacted by air from inside an ECA. Source apportionment was performed using Positive Matrix Factorization (PMF) on chemically speciated PM2.5 data from 2009 to 2018. Results for 7 coastal U.S. IMPROVE sites influenced by marine air masses within the NA-ECA showed an annual mean reduction of PM2.5 from RFO combustion of 79.0% (range, 60.2% to 91.5%) when comparing impacts from the pre-ECA (RFO average 2.7% S) period of 2009–2011 to the ECA 0.1% fuel S period of 2015–2018. In contrast, the Virgin Islands, Big Bend, and Baengnyeong Island South Korea IMPROVE sites were impacted by RFO combustion and were largely or wholly influenced by air masses from outside of an emissions control area. These sites saw a statistically significant 14.0% increase, a 21.0% decrease, or no statistically significant change, respectively, when comparing time periods pre and post ECA enforcement.
Implications: This study performs source apportionment on PM2.5 monitoring data to identify 10 sites impacted by residual fuel oil combustion, mainly from marine vessel fuel use. The paper then evaluates the effects of enforcement of marine vessel fuel sulfur emissions control areas at reducing ambient impacts of this source on PM2.5. This study uses both temporal analysis of the source apportionment results, comparing source impacts before and after enforcement of marine vessel fuel sulfur emissions control areas, and spatial analysis, comparing source impacts between sites largely impacted or not impacted by airmasses originating inside of marine vessel fuel sulfur emissions control areas.
Introduction
Human exposure to fine particulate matter (PM2.5, particles with aerodynamic diameter <2.5 μm) has been linked to cardiovascular and pulmonary disease (Atkinson et al. Citation2014), and lung cancer and premature mortality (Lepeule et al. Citation2012). Anthropogenic emissions of PM2.5 also play a role in climate forcing (IPCC Citation2014), cause visibility impairment (U.S. EPA Citation2020), and deposition of anthropogenic PM can have adverse effects on ecosystem health (Geiser et al. Citation2010).
Globally, shipping emissions of direct PM2.5 and gaseous precursors are a significant fraction of the worldwide total, with 2012 annual shipping estimated to contribute 13% of global annual SOx emissions and 8% of global PM2.5 emissions (Smith et al. Citation2014; Sofiev et al. Citation2018). One reason that shipping has historically contributed a significant fraction to worldwide anthropogenic air emissions is that these sources typically burn residual fuel oil (RFO), which has a very high sulfur content (2.7% S on average) and high emissions of PM2.5, SO2, and NOx (Moldanova et al. Citation2009; Winebrake et al. Citation2009). Environmental regulations in developed countries have contributed to a significant decline in on-shore applications of RFO as a fuel source. Excluding maritime applications, between 1986 and 2010 the use of RFO as a fuel source in Organization for Economic Cooperation and Development (OECD) countries has declined by nearly 70% (Ramberg and Van Vactor Citation2014). However, until recently, RFO use as a fuel source for commercial marine vessels in most areas of the world has been poorly regulated, and during the same 1986 to 2010 period, RFO use as a marine fuel has increased by about 100% (Ramberg and Van Vactor Citation2014).
Worldwide, Sofiev et al. (Citation2018) have estimated that ship-emission related health impacts include approximately 400,000 annual premature deaths from lung cancer and cardiopulmonary disease and approximately 14 million annual cases of childhood asthma. Regulating marine vessel fuel sulfur content is a typical approach to reducing emissions. Previous studies have shown that significant reductions in PM2.5 and SO2 occur when ocean going vessels switch from high to low sulfur fuels (Kasper et al. Citation2007; Khan et al. Citation2012) and Winebrake et al. (Citation2009) have shown that significant reductions in premature mortality from marine vessel emissions can be achieved by regulating fuel sulfur content below the assumed uncontrolled fuel sulfur content of 2.7%.
Concerns over health and ecological effects of marine vessel emissions led the United States (U.S.) and Canadian governments in 2009 to propose the designation of North America as an Emission Control Area (ECA) under Annex VI to the International Convention for the Prevention of Pollution from Ships (MARPOL Annex VI). In March of 2010 the Parties to MARPOL Annex VI designated specific portions of North American waters as an ECA (U.S. EPA Citation2010). In July 2011, after an additional proposal by the U.S., the Parties amended MARPOL to designate specific portions of the coastal waters around Puerto Rico and the U.S. Virgin Islands as an ECA (U.S. EPA Citation2011). The North American ECA (NA-ECA) extends up to 200 nm from U.S. coasts in most locations, but is smaller in some areas due to the limits of U.S. jurisdiction (e.g., areas off the Southeast Florida coast) and excludes western and northern Alaska and the Western Hawaiian islands. The U.S. Caribbean Sea ECA (USCAR-ECA) extends up to 50 nm from the territorial sea baselines of the included islands, but like the NA-ECA, is less than 50 nm in some areas due to the limits of U.S. jurisdiction (e.g., areas off the eastern coast of St. John Island). U.S. enforcement of the NA-ECA began in August 2012 and in the USCAR-ECA in January 2014 and required marine vessels to use fuels with sulfur content not exceeding 10,000 ppm (1%) while operating in those areas. Starting in 2015 the ECA fuel sulfur limits decreased to 0.10% for both the NA-ECA and USCAR-ECA. MARPOL Annex VI also sets sulfur content limits for fuels used outside of designated ECAs; originally set at 4.50%, the limit decreased to 3.50% starting in 2012, and 0.50% starting in 2020.
Compliance with the NA-ECA has predominantly come through fuel switching to lower sulfur liquid fuels. However, utilization of liquefied natural gas may also be means by which vessel operators seek to meet the regulatory requirement, and SOx scrubbing may also be employed. Regardless of the methods used, all result in significant reductions in direct and secondary PM2.5 from marine vessels.
Previous Positive Matrix Factorization (PMF) receptor modeling studies have demonstrated the ability to quantify the contribution of marine vessel RFO combustion to PM2.5 (Kotchenruther Citation2013, Citation2015; and references therein). Using PMF, Kotchenruther (Citation2017) analyzed PM2.5 for RFO combustion impacts at 13 U.S. monitoring sites along the East, West, and Gulf Coasts spanning a period from 2010 through 2015, which included one or two years of data through each phase of the NA-ECA regulation (unregulated, 1.0% sulfur, and 0.1% sulfur limit) and found large and statistically significant decreases in RFO combustion aerosol from the unregulated time period to the period of 0.1% sulfur limit (a mean reduction across all sites of 74%).
One limitation of the 2017 study by Kotchenruther was the comparison of results for only two years prior to enforcement of the NA-ECA and one year during the 0.1% sulfur limit, which therefore wasn’t able to account for the possible effects of year-to-year meteorological variability. Neither was the 2017 study able to address whether the 2015 results were subject to a ‘phase in’ period of adherence to the ECA, with subsequent years potentially showing even greater reductions in RFO combustion impacts within the ECA. This work addresses these previous limitations by analyzing 10 years of data at Interagency Monitoring of Protected Visual Environments (IMPROVE) monitors, 4 more years than the 2017 study, and includes 3 years of data prior to enforcement of the NA-ECA and 4 years subsequent to the 0.1% S limit. This improves on the previous study, provides a more robust picture of NA-ECA enforcement effectiveness, and better accounts for the effects of meteorological variability.
The 2017 study also analyzed PM2.5 at 9 IMPROVE sites on the West and East Coasts of the U.S. but was unable to separate the RFO combustion contribution to PM2.5 at those sites. As additional years of monitoring data have become available, it is now possible to revisit PMF analysis for those sites as well as include analyses of several sites that were not within the scope of the 2017 study. This work found that that the expanded datasets allowed for improved RFO source resolution by PMF at 7 of the 9 sites where RFO source impacts were not resolved by PMF in the 2017 study. Also, the longer data record and newly available data at several monitoring locations allow for the analysis of RFO combustion impacts at 4 monitoring sites that are largely or wholly affected by air masses from outside ECA enforcement zones. Analysis of RFO combustion results for those sites, coincident in time with sites affected by ECA enforcement, complements the temporal evaluation of ECA enforcement effectiveness (i.e., evaluating data pre and post ECA enforcement) with a spatial analysis of RFO combustion impacts from sites within and outside of areas affected by ECA enforcement. This combination of temporal and spatial analysis to evaluate ECA enforcement effectiveness has not been previously presented in a published study.
Of these 13 newly analyzed IMPROVE monitoring sites in this work, RFO combustion impacts were obtained for 10; 7 sites on the West and East coasts of the continental U.S. affected by air masses in areas of ECA enforcement, and 3 sites largely or wholly affected by air masses from outside ECA enforcement zones.
Methods
Chemically speciated PM2.5 data
Chemically speciated PM2.5 data were obtained from the IMPROVE Network. IMPROVE samplers collect 24-h integrated PM2.5 mass and are operated on a once every third day schedule. Information about the IMPROVE network can be found on the IMPROVE web site (http://vista.cira.colostate.edu/improve/) and in Solomon et al. (Citation2014).
Data were analyzed from January 1, 2009 through December 31, 2018. This data record includes three distinct annual periods with respect to marine vessel fuel sulfur regulations in the U.S.; a 3-year period (2009 to 2011) prior to enforcement of the NA-ECA and USCAR-ECA (approximately 2.7% world-wide sulfur average), a 2-year period (2013 to 2014) after enforcement of the initial phase of the NA-ECA (1.0% fuel sulfur limit), and a 4-year period (2015 to 2018) after enforcement of the second phase of the NA-ECA and USCAR-ECA (0.1% fuel sulfur limit). These three time periods will be subsequently referred to as the pre-ECA, NA-ECA 1.0% S, and ECA 0.1% S, respectively. The reader should note that while data from 2012 were included in the PMF modeling, 2012 results were not included in the analysis of the three time periods of fuel sulfur control because ECA enforcement began mid-year in 2012 and some sites have a large seasonal cycle in RFO combustion PM2.5 impacts.
Monitoring site selection
Selection of sites started with those within the IMPROVE monitoring network, one of two networks that routinely chemically speciate PM2.5 within the U.S. (Solomon et al. Citation2014). The IMPROVE network is better suited to identify RFO combustion in source apportionment because it has significantly better trace metal detection limits than the CSN network. Only sites within the IMPROVE network were considered to alleviate the concern that differences in source apportionment results might be the result of differences in sampling equipment or analytical procedures. Site selection within the IMPROVE network began with the 9 sites selected for PMF analysis in the original 2017 study (Kotchenruther Citation2017), but where PMF modeling with the shorter 6-year dataset did not provide adequate separation of a factor associated with RFO combustion. The sites in the 2017 publication were selected based on high vanadium (V) and nickel (Ni) correlation coefficients (r2) in monitoring data prior to the NA-ECA enforcement, from 2010 to 2011, and where the average V:Ni ratio in the monitored data was within the range of V:Ni emission ratios from marine vessel RFO combustion emissions tests, typically between 2 and 4.5 (Agrawal et al. Citation2008; Popovicheva et al. Citation2012). To this initial list of 9 sites, 2 sites were added that are near-coastal sites outside of an ECA zone: sites in Alaska and South Korea. These sites were added to see if RFO combustion could be identified and quantified through PMF modeling at those sites, and then used as a comparative example of what changes in RFO combustion impacts might be occurring in locations outside an ECA zone, and taking advantage of the fact that the monitoring data were gathered and could be analyzed in the same fashion as that analyzed from within an ECA zone. In addition to these 2 near-coastal sites outside of an ECA zone, one coastal site was added from Washington State that was not considered in the initial analyses because, at that time, the data were not available (the Makah Tribal site #2) and one site was added that lies within the USCAR-ECA (the U.S. Virgin Islands site) because it had a moderately high V and Ni r2 in the initial correlation analysis and it was hypothesized that the longer time period analyzed in this study might allow resolution of a factor associated with RFO combustion. This resulted in a total of 13 IMPROVE monitoring sites considered in this analysis that have not previously had reported results for RFO combustion impacts during the period of ECA enforcement. lists metadata for the 13 sites.
Table 1. IMPROVE monitoring sites modeled with PMF in this study. Sites in bold font are those where PMF modeling resulted in well delineated factors associated with RFO combustion
Data preparation and treatment
The preparation and treatment of IMPROVE data for input into the PMF model for this study is identical to that done in a previous publication (Kotchenruther Citation2017) and the reader is encouraged to consult that publication for detailed information. For this work, a synopsis of IMPROVE data treatments is provided in the supplementary materials, including handling of missing data, handling issues of chemical species double counting, data uncertainty estimation, the data quality metric used for data exclusion, and treatment of data with poor quality due to signal-to-noise ratio.
Source apportionment with PMF
The EPA PMF 5.0 model was used for the receptor-based source apportionment analysis in this study (https://www.epa.gov/air-research/positive-matrix-factorization-model-environmental-data-analyses). Model documentation, including the underlying mathematical equations employed, can be found in Paatero and Hopke (Citation2003) and Norris et al. (Citation2014). Data from each site were modeled individually, PMF was typically run in the robust mode with 20 repeat runs, and the rotational FPEAK variable held at 0.0. The final choice for the best number of PMF factors at each site was based on inspecting results after repeated runs where the number of factors modeled for each site was progressively increased. The results of the three error estimation methods available in this model version were compared across all runs at a given site to find the optimal solution. The three error estimation methods are bootstrapping (BS), displacement (DISP), and bootstrapping with displacement (BS-DISP) (Norris et al. Citation2014; Paatero et al. Citation2014). For the solution chosen at each site, the scaled residuals generally fell into the recommended range of +3 to −3. Further information on how the model solution with the optimal number of factors was selected is provided in the supplemental materials and follows the same protocols as used in a previous publication (Kotchenruther Citation2017).
Because the focus of this study was to identify and quantify PM2.5 related to RFO combustion, and to compare PM2.5 contributions from RFO combustion at sites influenced by air originating inside and outside of marine vessel fuel sulfur emissions control areas, if PMF modeling was unable to achieve a solution that separated RFO combustion from other sources of PM2.5, then those sites were not carried forward for further analysis.
As mentioned above, this work modeled 13 sites using PMF to attempt to quantify the contribution to PM2.5 from RFO combustion. Nine of these 13 sites were previously analyzed with PMF in a 2017 publication (Kotchenruther Citation2017), but in that work, did not yield a well-defined factor associated with RFO combustion. For these 9 sites, PMF modeling in the 2017 publication had 6 years of data and between 625 and 697 samples to input into PMF. However, this work used 10 years of monitoring data and had between 1097 and 1178 samples as input into the PMF model. Despite the relatively large number of samples used in the 2017 publication, the result of the additional data used in this work was that 7 of the 9 previously analyzed sites now had a PMF factor related to RFO combustion that was well delineated from the other resolved factors. Of the remaining 4 newly analyzed sites, 3 also resolved a PMF factor related to RFO combustion. The overall result was that well-defined factors associated with RFO combustion were obtained from 10 of the initial 13 sites considered. Results for these 10 sites are further discussed below and are the sites in bold font in .
Results and discussion
Identification of PM2.5 sources and compositions associated with PMF factors
PMF modeling for the 13 sites resulted in model solutions at 10 of these sites where factors associated with RFO combustion were well delineated from other factors. As demonstrated in Kotchenruther (Citation2015), this determination was based on identification of a factor containing high sulfate and significant V and Ni contributions, identification of a second factor with a dominant sulfate contribution but without significant V and Ni contributions, and results from the three error estimation methods (BS, DISP, and BS-DISP) indicating that all factors were well delineated from each other (Brown et al. Citation2015).
At the 10 sites where factors associated with RFO combustion were well delineated, from 7 to 10 factors were identified in each PMF solution, depending on the site. A total of 20 different factor types were identified across the 10 sites. The types of factors identified were very similar to those identified in a previous publication of PMF modeling using IMPROVE data (Kotchenruther Citation2017). The PMF factors were identified by comparing the chemical composition of factors with chemical profiles in EPA’s SPECIATE database of source emissions test data (https://www.epa.gov/air-emissions-modeling/speciate), comparison with similar PMF factor chemical compositions identified in existing published studies, knowledge of the seasonal emissions patterns of aerosol sources, and composition of aerosols found in the natural environment (e.g., fugitive dust, sea salt). The 20 different factor types identified across the 10 sites are listed in the supplemental materials, along with the number of times they were found between the 10 monitoring sites, an explanation of how each factor type was identified, and the chemical profiles and mass impact time series of each factor at each site.
It should be noted that while marine vessel PM2.5 associated with RFO combustion can be identified and quantified at some monitoring locations, it is not the only source of marine vessel PM2.5 emissions. Many marine vessels have engines that require distillate fuels that typically have much lower sulfur content than RFO, and for marine vessels that do use RFO for propulsion, they typically also have auxiliary engines that use distillate fuels. Emissions from these marine engines that do not use RFO should not be assumed to be associated with RFO combustion factors.
In addition to the marine fuel combustion unassociated with RFO combustion mentioned above, RFO combustion emits gaseous NOx and SO2 that can form PM2.5 far downwind of marine vessels and may become decoupled from direct RFO combustion PM2.5 identified in RFO factors. Because reducing fuel sulfur has a direct effect in reducing gaseous SO2 emissions, there may be reductions in secondary sulfate PM2.5 associated with ECA fuel sulfur reductions that are decoupled from the changes in RFO combustion mass identified in this work.
Results for PM2.5 from residual fuel oil combustion
For the 7 near-coastal continental U.S. sites analyzed in this work, back-trajectory information on days prior to enforcement of the NA-ECA suggested a significant marine origin for the RFO combustion. Back-trajectories for these sites for days with high RFO combustion PM2.5 were provided in a previous publication (Kotchenruther Citation2017), with the exception of the MAKA2 site. Back-trajectory information for the MAKA2 site is provided in the supplemental information of this work, also shows a significant marine origin on high RFO impact days, and is discussed further below. The only known marine source of RFO combustion is marine vessels.
To evaluate changes in PM2.5 from RFO combustion over time, the annual mean contribution of RFO combustion to PM2.5 was computed as the mean of the 12 monthly means and a file containing monthly mean PMF results are provided as supplementary materials. Annual mean data was compared because many sites exhibited a significant seasonal cycle in RFO combustion PM2.5 impacts, with higher impacts in summer and lower in winter. This seasonal cycle is discussed in a previous publication (Kotchenruther Citation2017) and is attributed mainly to summertime coastal fumigation, where summertime stable marine air is advected over land masses and ground heating then causes significant mixing in the boundary layer. The effect is largest at the Pacific coast sites where the summertime land and sea temperature differences are greatest. Time series of RFO contributions to PM2.5 at each site can be found in the supplemental materials.
shows the time series of annual mean PM2.5 from RFO combustion at the 10 sites where RFO combustions results were available. Sites are grouped in based on whether the back-trajectory analysis indicated air masses with high RFO combustion mass originated from marine areas that were subsequently part of a region under ECA enforcement. Missing years of data indicate either the monitor had not begun operation yet or there were data gaps resulting in that year not having a full 12 monthly means to aggregate into an annual mean.
Figure 1. Time series of annual mean PM2.5 attributed to residual fuel oil combustion at IMPROVE monitoring locations. Locations are identified in bold text based on their IMPROVE site abbreviation
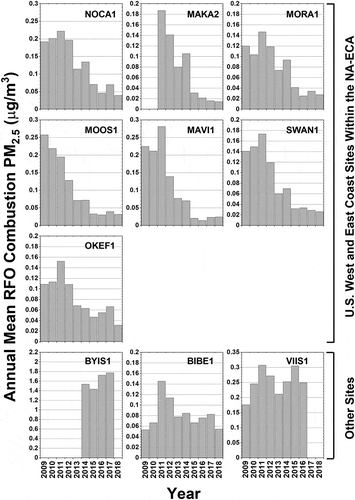
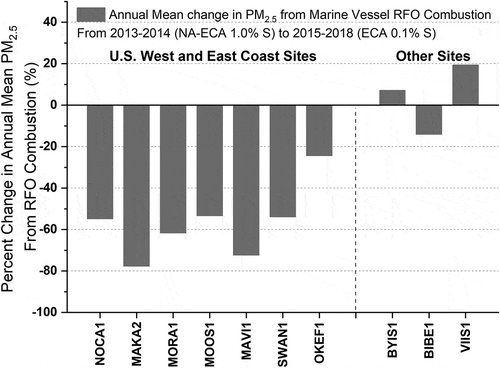
shows the annualized (the mean of annual means) mean RFO mass contribution to PM2.5 for each period of fuel S control covered in this study: pre-ECA (years 2009 to 2011), NA-ECA 1.0% S (years 2013 to 2014), and ECA 0.1% S (years 2015 to 2018). A table in the supplementary materials provides the annualized means for total PM2.5 measured at each location. For each multi-year mean, annual means were only used if there were 12 monthly means. can be inspected to see which sites have data gaps that resulted in fewer years being combined into the multi-year means. The percentage change in annual mean PM2.5 from the pre-ECA period to each subsequent period of fuel S control is also provided in as are which changes are statistically significant (in bold font). Significance testing was performed by comparing data between the two time periods using the nonparametric Wilcoxon-Mann-Whitney (WMW) test, with statistical significance determined by exceeding the 95% confidence interval. WMW p-values for statistical significance presented in are provided in a table in the supplemental materials. shows a bar graph indicating the percent change in PM2.5 from RFO combustion from the pre-ECA period to ECA 0.1% S period, and the percent change from the NA-ECA 1% S to ECA 0.1% S periods, for each of the locations in with data for those time periods.
Table 2. Annualized mean RFO combustion emissions contribution to PM2.5 for the pre-ECA, NA-ECA 1% S, and ECA 0.1% S periods and percent change in RFO combustion emissions contribution between the annualized mean periods. Percent changes in bold are statistically significant at the 95% confidence level
Figure 2. Percent change in annual mean PM2.5 from marine vessel RFO combustion from the pre-ECA (2009–2011) to ECA 0.1% S (2015–2018) periods
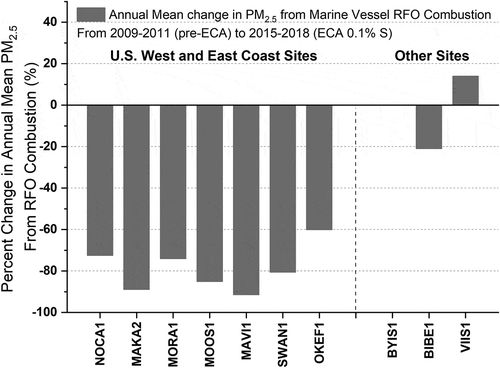
Figure 3. Percent change in annual mean PM2.5 from marine vessel RFO combustion from the NA-ECA 1.0% S (2013–2014) to ECA 0.1% S (2015–2018) periods for sites in the NA-ECA zone
Residual fuel oil combustion results at U.S. West and East Coast sites
Seven sites in this study have source apportionment results for RFO combustion PM2.5 and are along the West and East Coasts of the U.S. For these sites, annualized mean PM2.5 mass from factors associated with RFO combustion dropped by 79.0% (range, 60.2% to 91.5%) from the 3-year pre-ECA period to the 4-year 0.1% S ECA period. These statistically significant reductions were consistent with those found in a previous study (Kotchenruther Citation2017) that presented results for a different set of 10 sites that also spanned the West and East Coasts of the U.S., but covered a shorter monitoring period of 2 years in the pre-ECA period and only 1 year in the 0.1% EPA period (previous study mean reduction 83.1%; range, 77.2% to 90.4%).
Air emissions regulations in the U.S. have largely limited the use of RFO in onshore applications (Ramberg and Van Vactor Citation2014). The observed decrease in PM2.5 from RFO combustion in this work is consistent with air mass back-trajectory evidence presented in Kotchenruther (Citation2017), which showed high RFO combustion impact days in the pre-ECA period originated from marine origin, is consistent with the timing of enforcement of fuel S limits in the NA-ECA, and strongly points to marine shipping as the source of the RFO combustion.
One of the West Coast sites evaluated in this work was not previously evaluated with air mass back-trajectories in Kotchenruther (Citation2017), the MAKA2 site. For this site, 48-hour air mass back-trajectories were computed for the top 20 days of RFO combustion mass attribution in 2011 (Citation2011 was the only full year of data for the MAKA2 site during the 2009–2011 pre-ECA period). The air mass back-trajectory frequency plot for these 20 days is provided in the supplemental materials and indicates that the majority of air mass back-trajectory residence time was over marine locations in the Strait of Juan de Fuca and in the Pacific Ocean along the U.S. West Coast. This is consistent with the marine origin of air mass back-trajectories computed for the other sites during the pre-ECA period and presented in Kotchenruther (Citation2017).
Calculations using data in and annualized mean PM2.5 data in the supplemental materials indicate that the contribution of RFO combustion factors to total PM2.5 mass ranged from 1.5% to 9.1% at IMPROVE sites along the West and East Coasts of the U.S. in the 3-year pre-ECA period, and this contribution fell to between 0.4% and 1.7% in the 0.1% S ECA period. This sharp drop in the RFO combustion percent contribution to PM2.5 reflects the 60.2% to 91.5% reduction in RFO mass noted above but may also partly be a function of an increase in annual mean PM2.5 measured between the two periods that occurred at many sites in the Pacific Northwest. Factor mass time series provided in the supplemental materials suggests that many Pacific Northwest sites were more impacted by wildfire smoke in the later period, which may partly explain the increases in total annual mean PM2.5.
It is interesting to note that while fuel sulfur content was reduced by 96% or more from the pre- ECA enforcement period to the 0.1% fuel sulfur period within the ECA regulated area, RFO combustion impacts only fell be an average of 79% at the East and West coast sites analyzed in this work. Several possible explanations for this discrepancy are as follows. First, reductions in PM2.5 emissions may not have a one-to-one relationship or be linear with fuel sulfur reductions. Second, some of the remaining RFO impacts observed after the enforcement of the 0.1% S limit may be from long-range transport of emissions from outside of the ECA regulation zone. Third, ships headed to port that fuel switch at the 200 nm limit will continue to have higher emissions until the cleaner distillate fuel works its way through the fuel piping and engine, so there may be higher emissions somewhat within the 200 nm limit as ships transit toward ports.
Residual fuel oil combustion results at other sites
In addition to the U.S. coastal sites within the NA-ECA zone, three other IMPROVE monitoring locations have results for RFO combustion impacts: a non-coastal location in the U.S. State of Texas near the U.S.-Mexico border (BIBE1), a coastal site in the U.S. Virgin Islands that is part of the USCAR-ECA zone (VIIS1), and a coastal site on Baengnyeong Island South Korea that is not within an ECA zone (BYIS1).
The BIBE1 IMPROVE monitoring site representing Big Bend National Park was identified as potentially having PM2.5 impacts from RFO combustion in Kotchenruther (Citation2017) based on a high V:Ni correlation in the raw monitoring data for the 2010–2011 pre-ECA period, but a well-delineated factor associated with RFO combustion was not able to be isolated in that previous study. However, PMF modeling in this work was able to identify and isolate a factor associated with RFO combustion, possibly due to the larger amount of available data. To determine the likely source region of RFO combustion at this site, air mass back-trajectories were computed for the top 20 days of PM2.5 mass attributed to the PMF factor associated with RFO combustion during the 2009–2011 pre-ECA period. The air mass back-trajectory frequency plot for 48-hour back-trajectories for these 20 days is provided in the supplemental materials and indicates that the majority of air mass back-trajectory residence time was over terrestrial areas of Mexico, with a relatively small percentage of the 48-hour residence times outside of the NA-ECA zone in the Gulf of Mexico and Gulf of California. The back-trajectory analysis suggests some combination of non-U.S. terrestrial sources of RFO combustion and possibly some contribution from non-NA-ECA zone marine sources. The annualized mass attributed to factors associated with RFO combustion decreased by a statistically significant 21.0% between the pre-ECA period and the 0.1% S ECA periods, however, this was a much smaller reduction than was found at U.S. coastal locations within the NA-ECA zone where RFO combustion PM2.5 impacts are associated with marine sources, and is likely related to changes in terrestrial source emissions given the non-coastal location and significant back-trajectory residence time over terrestrial areas of Mexico.
The VIIS1 IMPROVE monitoring site representing Virgin Islands National Park is located at a coastal location on the island of St. John, VI and lies within the USCAR-ECA zone. This site was not chosen for PMF modeling in the Kotchenruther (Citation2017) publication due to only a moderate V:Ni correlation in the raw monitoring data for the 2010–2011 pre-ECA period. However, this site was selected for PMF modeling in this work because it is a coastal location that lies within the bounds of an ECA and had a longer monitoring record available for this analysis. The location of the VIIS1 monitor lies only a few miles from the eastern edge of the USCAR-ECA due to the close proximity of the British Virgin Islands (U.S. EPA Citation2011). PMF modeling in this work was able to identify and isolate a factor associated with RFO combustion at the VIIS1 site. The annualized mass attributed to the factor associated with RFO combustion increased by a statistically significant 14.0% between the pre-ECA period and the 0.1% S ECA periods at the VIIS1 monitor. To determine the likely source regions of RFO combustion at this site, air mass back-trajectories were computed for the top 20 days of PM2.5 mass attributed to the PMF factor associated with RFO combustion during the 2009–2011 pre-ECA period. The air mass back-trajectory frequency plot for 48-hour back-trajectories for these days is provided in the supplemental materials and indicates that the majority of air mass back-trajectory residence time was to the east and south-east of this site with residence time mostly over marine locations outside of the USCAR-ECA but also encompassing a number of populations centers in the Caribbean Island chain from the Virgin Islands to Guadeloupe. The Virgin Islands have some on-shore industries that make use of RFO combustion, primarily for electricity generation and production of drinking water supplies. Additionally, there are important marine shipping routes that service the Caribbean Island chain as well as transit routes between the East Coasts of the U.S. and South America (Halpern, Hengl, and Groll Citation2012). Given the presence of both on-shore and marine sources of RFO combustion with the potential to impact the monitoring site, it was not possible to identify whether the increase in RFO impacts between the two periods is from changes in shipping routes, changing ship traffic frequency, changes in on-shore RFO usage, or what combination of these may have influenced the observed changes. However, the lack of a significant decrease in RFO combustion aerosol mass impacting the VIIS1 site between the pre-ECA period and the 0.1% S ECA period is at least consistent with significant air mass transport from areas east of the monitor where marine fuel use was unregulated within a few miles of the monitor.
The BYIS1 monitoring site is located on Baengnyeong Island South Korea and is an island in the Yellow Sea off the West Coast of North Korea. The BYIS1 monitoring site was installed through a U.S.-South Korea collaboration and uses the same hardware and undergoes the same analytical analysis as other monitors in the IMPROVE network. Baengnyeong Island lies along a line between Beijing, China and Seoul, South Korea and is considered by South Korea as a background monitoring site for air arriving in South Korea. Monitoring began at the site in April of 2013. PMF modeling in this work was able to identify and isolate a factor associated with RFO combustion at the BYIS1 site. To determine the likely source region of RFO combustion at this site, air mass back-trajectories were computed for the top 20 days of PM2.5 mass attributed to the PMF factor associated with RFO combustion during 2014–2016. The air mass back-trajectory frequency plot for 48-hour back-trajectories for these 20 days is provided in the supplemental materials and indicates that the majority of air mass back-trajectory residence time was over marine areas of the Yellow Sea to the west and south of the monitor. This suggests that marine shipping is a major source of RFO combustion aerosol at BYIS1. Starting in 2016 China began enforcement of their China Domestic ECA; however, the majority of back trajectory residence time from BYIS1 on high RFO impact days was over areas of the Yellow Sea that were not part of an existing ECA, so this suggests that data on RFO combustion impacts at BYIS1 provides one example of what impacts were occurring outside of an ECA, but coincident in time with areas under ECA regulations. Annual mean mass for the factor associated with RFO combustion at BYIS1 is depicted in and shows that annual mean values were available for 2014–2017. For comparison to RFO impacts at coastal U.S. locations within the NA-ECA zone, there is one year of data coincident with the 1% S NA-ECA period and 3 years of data coincident with the 0.1% S ECA period. Comparing annualized mean values for RFO combustion mass at BYIS1 between these two periods shows no statistically significant change in mass (a 7.1% increase). Having said that, many factors may influence the amount of RFO combustion that occurred in the region of the Yellow Sea impacting the BYIS1 site during this period, such as changes in shipping patterns and frequency, and those data were not readily available for this study. As noted in , all U.S. coastal sites within the NA-ECA zone exhibited statistically significant reductions in RFO combustion mass, between the NA-ECA 1% S period and NA-ECA 0.1% S period, with a mean reduction of 56.9% across the 7 sites (range, 24.4%–77.7% reduction).
Comparing residual fuel oil combustion results between the 1.0% S and the 0.1% S ECA periods at U.S. coastal sites within the NA-ECA zone
The above discussion of results has focused largely on changes in mass attribution to RFO combustion from the unregulated pre-ECA period to the period of full application of the NA-ECA in the 0.1% S period. However, as noted in Section 3.4, statistically significant reductions in PM2.5 mass attributed to RFO combustion were also found at all U.S. coastal monitoring sites within the NA-ECA zone when comparing data between the 1.0% S and the 0.1% S ECA periods (see ). As noted in the introduction, the IMO has mandated a worldwide 0.5% fuel sulfur limit for marine vessels beginning in 2020. The results presented here, of the benefit of reducing fuel sulfur from a 1.0% S limit to a 0.1% S limit, suggest that a measurable benefit will continue to occur at U.S. coastal IMPROVE monitoring sites as a result of ECA regulations, and after 2020 when vessels transition to a worldwide 0.5% fuel sulfur limit outside of ECA regulated zones, air quality benefits from the ECA regulations are expected to continue.
Other circumstances potentially affecting the amount of RFO combustion from marine vessels arriving at IMPROVE monitors
In addition to the sulfur content of fuels used by ocean-going vessels, other circumstances can affect the degree to which RFO combustion from marine vessels impact IMPROVE monitoring locations on an annual basis. Two potential additional contributors to changes in observed RFO combustion aerosol are annual changes in meteorology and shipping volume, and these are discussed further below.
While a detailed meteorological analysis of each location with an IMPROVE monitor used in this work is beyond the scope of this study, the potential of meteorological variability to impact these results is somewhat addressed by comparing multiyear means within each period of fuel sulfur control. In this analysis, most sites have three years of data prior to application of the NA-ECA and four years of data after application of the 0.1% S period of the NA-ECA. Averaging three or more years of data conforms with the data averaging period used by the U.S. EPA in determining compliance with U.S. National Ambient Air Quality Standards, which is used in part for the same reason.
Changes in shipping volume and frequency can also influence the amount of RFO combustion from marine vessels that arrives at an IMPROVE monitor, and even without a change in frequency, changes in shipping volume may result in changes in vessel weight, and therefore fuel use. Analysis of shipping frequency data near each IMPROVE monitoring location was beyond the scope of this study. However, to explore the possible effects of changes in shipping volume on the results presented in this work, 2009 to 2018 yearly waterborne tonnage aggregated by U.S. state, and yearly Twenty-Foot Equivalent Unit (TEU) shipping volume aggregated by U.S. major ports, were analyzed based on data compiled by the U.S. Army Corps of Engineers (US Army Corps of Engineers Citation2020). The annual data as well as multi-year means based on NA-ECA regulation time periods are provided in tables in the supplementary materials. Aggregated tonnage and TEU volume include both domestic and international transport through U.S. ports, and include transport from marine vessels using RFO and vessels using distillate fuels, so changes in aggregated tonnage and TEU volume are not precise measures related to RFO usage. Comparing the percent change in waterborne tonnage and TEU volume between the pre-ECA 2009 to 2011 period with the NA-ECA 0.1% S 2015 to 2018 period shows a lot of variability between states and ports, with some large increases and some large decreases. This is likely due to market fluidity and competition between ports. However, when the data are aggregated based on coastal region; West and East Coasts, there is a more consistent picture. The aggregated percent change in waterborne tonnage from the pre-ECA to NA-ECA 0.1% S periods was +8.5% and −4.1% for the West and East Coast states, respectively. The aggregated percent change in TEU volume from the pre-ECA to NA-ECA 0.1% S periods was +12.7% and +30.3% for the West and East Coast major ports, respectively. These aggregated changes in waterborne tonnage and TEU volume suggest that changes in shipping activity are likely not the cause of large reductions in PM2.5 from RFO combustion at IMPROVE monitoring sites during this study period.
Conclusion
This work uses PMF source apportionment of PM2.5 at IMPROVE monitors to assesses the effectiveness of reducing PM2.5 from RFO combustion through the application of a marine vessel fuel sulfur ECA. This is achieved through temporal analysis of RFO combustion impacts pre and post ECA enforcement at 7 monitoring sites along the West and East Coasts of the U.S. and within the regions affected by the NA-ECA, and through comparison to 3 monitoring sites affected by RFO combustion in the same IMPROVE monitoring network and covering the same time period but that were largely or wholly affected by air emissions outside of an ECA enforcement zone.
The 7 U.S. coastal or near-coastal locations within the NA-ECA zone all experienced statistically significant reductions in PM2.5 from RFO combustion when comparing annual mean impacts between the pre-ECA and 0.1% fuel S limit periods, with a mean reduction in RFO combustion’s contribution to PM2.5 of 79.0% (range, 60.2% to 91.5% reduction).
In contrast, 3 other IMPROVE monitoring sites were affected by RFO combustion but were largely or wholly unaffected by air emissions inside of an ECA enforcement zone and showed either modest reductions, no statistically significant change, or modest increases. At a non-coastal IMPROVE site along the U.S.-Mexico border where RFO combustion emissions likely originated from terrestrial sources in Mexico, RFO combustion mass decreased a statistically significant 21.0% between the pre-ECA and ECA 0.1% S periods, a much smaller reduction than at the U.S. West and East Coast sites. At the Baengnyeong Island IMPROVE site in South Korea where RFO combustion emissions mostly originate from areas not influenced by an ECA, RFO combustion mass experienced no statistically significant change between the NA-ECA 1.0% S and ECA 0.1% S periods. And at the U.S. Virgin Islands IMPROVE site where RFO combustion emissions mainly originate from areas east of the monitor outside of the USCAR-ECA enforcement zone, RFO combustion mass increased a statistically significant 14.0% between the pre-ECA and ECA 0.1% S periods.
Results presented here also show the effects on RFO combustion PM2.5 mass at coastal locations when moving from a zone with 1.0% S regulation to 0.1% S. All 7 U.S. coastal sites within the NA-ECA zone in this study exhibited statistically significant reductions in RFO combustion mass, between the NA-ECA 1% S period and NA-ECA 0.1% S period, with a mean reduction of 56.9% across the 7 sites (range, 24.4%–77.7% reduction). These results suggest that a measurable benefit will continue to occur at U.S. coastal IMPROVE monitoring sites as a result of ECA regulations, and after 2020 when vessels transition to a worldwide 0.5% fuel sulfur limit outside of ECA regulated zones, air quality benefits from the ECA regulations are expected to continue.
There are at least several questions that remain open with respect to the air quality benefits of establishing a marine vessel ECA that are not addressed through PMF analyses like those presented in this work. First, to what extent do ECA fuel sulfur controls affect secondary sulfate that has become decoupled from primary PM2.5 emissions? Second, to what extent do emissions from outside an ECA affect coastal areas within an ECA? And third, what affects will the world-wide 0.5% fuel sulfur limit have on PM2.5 in coastal locations that are within an ECA? The last of these may be partially addressed through future PMF analysis similar to that presented here, but all of these questions would be better addressed through a comprehensive photochemical modeling study.
Supplemental Material
Download MS Excel (159 KB)Supplemental Material
Download PDF (3.5 MB)Disclosure statement
The views expressed in this document represent those of the author and not those of the U.S. Environmental Protection Agency. The measurements and analysis presented in this document do not substitute for any regulatory evaluations required under the U.S. Clean Air Act.
Supplementary material
Supplemental data for this paper can be accessed on the publisher’s website.
Additional information
Notes on contributors
Robert A. Kotchenruther
Robert A. Kotchenruther received a master’s degree in Atmospheric Sciences and a doctorate in Chemistry from the University of Washington and has worked for the U.S. EPA in the Region 10 office since 2001.
References
- Agrawal, H., Q. G. J. Malloy, W. A. Welch, J. W. Miller, and D. R. Cocker III. 2008. In-use gaseous and particulate matter emissions from a modern ocean going container vessel. Atmos. Environ. 42:5504–10. doi:10.1016/j.atmosenv.2008.02.053.
- Atkinson, R. W., S. Kang, H. R. Anderson, I. C. Mills, and H. A. Walton. 2014. Epidemiological time series studies of PM2.5 and daily mortality and hospital admissions: A systematic review and meta-analysis. Thorax 69:660–65. doi:10.1136/thoraxjnl-2013-204492.
- Brown, S. G., S. Eberly, P. Paatero, and G. A. Norris. 2015. Methods for estimating uncertainty in PMF solutions: Examples with ambient air and water quality data and guidance on reporting PMF results. Sci. Total Environ. 518e519:626–35. doi:10.1016/j.scitotenv.2015.01.022.
- Geiser, L. H., S. E. Jovan, D. A. Glavich, and M. K. Porter. 2010. Lichen based critical loads for atmospheric nitrogen deposition in Western Oregon and Washington Forests, USA. Environ. Pollut. 158:2412–21. doi:10.1016/j.envpol.2010.04.001.
- Halpern, B. S., T. Hengl, and D. Groll. 2012. Shipping density (commercial). A Global Map of Human Impacts to Marine Ecosystems, showing relative density (in color) against a black background. Scale: 1 km. Wikimedia Commons, CC BY-SA 3.0. https://commons.wikimedia.org/w/index.php?curid=18755723.
- IPCC. 2014. Climate change 2014: Synthesis report. Contribution of Working Groups I, II and III to the Fifth Assessment Report of the Intergovernmental Panel on Climate Change [Core Writing Team, R.K. Pachauri and L.A. Meyer (eds.)], 151. IPCC, Geneva, Switzerland.
- Kasper, A., S. Aufdenblatten, A. Forss, M. Mohr, and H. Burtscher. 2007. Particulate emissions from a low-speed marine diesel engine. Aerosol Sci. Technol. 41:24–32. doi:10.1080/02786820601055392.
- Khan, M. Y., M. Giordano, J. Gutierrez, W. A. Welch, A. Asa-Awuku, J. W. Miller, and D. R. Cocker III. 2012. Benefits of two mitigation strategies for container vessels: Cleaner engines and cleaner fuels. Environ. Sci. Technol. 46:5049–56. doi:10.1021/es2043646.
- Kotchenruther, R. A. 2013. A regional assessment of marine vessel PM2.5 impacts in the U.S. Pacific Northwest using a receptor-based source apportionment method. Atmos. Environ. 68:103–11. doi:10.1016/j.atmosenv.2012.11.067.
- Kotchenruther, R. A. 2015. The effects of marine vessel fuel sulfur regulations on ambient PM2.5 along the west coast of the U.S. Atmos. Environ. 103:121–28. doi:10.1016/j.atmosenv.2014.12.040.
- Kotchenruther, R. A. 2017. The effects of marine vessel fuel sulfur regulations on ambient PM2.5 at coastal and near coastal monitoring sites in the U.S. Atmos. Environ. 151:52–61. doi:10.1016/j.atmosenv.2016.12.012.
- Lepeule, J., F. Laden, D. Dockery, and J. Schwartz. 2012. Chronic exposure to fine particles and mortality: An extended follow-up of the Harvard six cities study from 1974 to 2009. Environ. Health Perspect. 120:965–70. doi:10.1289/ehp.1104660.
- Moldanova, J., E. Fridell, O. Popovicheva, B. Demirdjian, V. Tishkova, A. Faccinetto, and C. Focsa. 2009. Characterisation of particulate matter and gaseous emissions from a large ship diesel engine. Atmos. Environ. 43:2632–41. doi:10.1016/j.atmosenv.2009.02.008.
- Norris, G., R. Duvall, S. Brown, and S. Bai. 2014. EPA Positive Matrix Factorization (PMF) 5.0 fundamentals and user guide. EPA/600/R-14/108, U.S. Environmental Protection Agency.
- Paatero, P., S. Eberly, S. G. Brown, and G. A. Norris. 2014. Methods for estimating uncertainty in factor analytic solutions. Atmos. Meas. Tech. 7:781–97. doi:10.5194/amt-7-781-2014.
- Paatero, P., and P. K. Hopke. 2003. Discarding or downweighting high-noise variables in factor analytic models. Anal. Chim. Acta 490:277–89. doi:10.1016/S0003-2670(02)01643-4.
- Popovicheva, O., E. Kireeva, N. Persiantseva, M. Timofeev, H. Bladt, N. P. Ivleca, R. Niessner, and J. Moldanova. 2012. Microscopic characterization of individual particles from multicomponent ship exhaust. J. Environ. Monit. 14:3101–10. doi:10.1039/c2em30338h.
- Ramberg, D., and S. Van Vactor. 2014. Implications of residual fuel oil phase out. 37th International Association for Energy Economics (IAEE) International Conference, New York, NY, June 15–18.
- Smith, T. W. P. et al. 2014. Third IMO GHG study 2014. London, UK: International Maritime Organization.
- Sofiev, M., J. J. Winebrake, L. Johansson, E. W. Carr, M. Prank, J. Soares, J. Vira, R. Kouznetsov, J.-P. Jalkanen, and J. J. Corbett. 2018. Cleaner fuels for ships provide public health benefits with climate tradeoffs. Nat. Commun. 9:406. doi:10.1038/s41467-017-02774-9.
- Solomon, P. A., D. Crumpler, J. B. Flanagan, R. K. M. Jayanty, E. E. Rickman, and C. E. McDade. 2014. U.S. national PM2.5 chemical speciation monitoring networks—CSN and IMPROVE: Description of networks. J. Air Waste Manage. Assoc. 64:1410–38. doi:10.1080/10962247.2014.956904.
- U.S. Army Corps of Engineers. 2020. Waterborne Commerce statistics center. Accessed January 13, 2020. http://www.navigationdatacenter.us/wcsc/wcsc.htm.
- U.S. Environmental Protection Agency. 2010. Designation of North American emission control area to reduce emissions from ships: Regulatory announcement. EPA-420-F-10-015.
- U.S. Environmental Protection Agency. 2011. Designation of emission control area to reduce emissions from ships in the U.S. Caribbean. EPA-420-F-11-024.
- U.S. Environmental Protection Agency. 2020. Accessed July 13, 2020. https://www.epa.gov/visibility.
- Winebrake, J. J., J. J. Corbett, E. H. Green, A. Lauer, and V. Eyring. 2009. Mitigating the health impacts of pollution from oceangoing shipping: An assessment of low-sulfur fuel mandates. Environ. Sci. Technol. 43:4776–82. doi:10.1021/es803224q.