
 ?Mathematical formulae have been encoded as MathML and are displayed in this HTML version using MathJax in order to improve their display. Uncheck the box to turn MathJax off. This feature requires Javascript. Click on a formula to zoom.
ABSTRACT
Latin-American cities need efficient municipal solid waste (MSW) collection systems, specifically in municipalities with fast urbanization. Poor logistics in collection routes is one of the causes of inefficient MSW management. A strategy for designing the MSW collection routes, considering an environmental and economic analysis, was developed and tested in the Metropolitan Area of Monterrey (MMA), one of the cities with the highest urban and economic development in Mexico. Life cycle assessment and costs analysis were performed to evaluate archetypal routes’ environmental and economic impact in the current MSW collection system. The assessment of the environmental impact was realized through midpoint indicators of the ReCiPe 2008 method. The mathematical model describing the collection routes was developed using actual data from the MSW collection system in MMA, optimized by the Traveling Salesman Problem (TSP), and solved in RStudio. This study shows a reduction of between 9 and 20% of greenhouse gas emissions and distance covered in current collection stages, respectively. The results also demonstrate the influence of road direction, collection-truck efficiency, and traffic load in different stage on the environmental and economic impacts of the collection routes. A life cycle inventory, with realistic inputs and outputs of the MSW collection system, was developed. These inventories are scarce in Mexico and Latin America; their development helps designing cleaner MSW collection systems.
Implications: The optimization of urban solid waste collection systems is a strategy to reduce costs and environmental impacts, considering factors such as distance or fuel consumption. However, mathematical models within the optimization require detailed information of the road network to achieve reliable results. In this context, Latin America shows difficulties in increasing its collection systems’ efficiency due to economic constraints and limited access to information from locals governments. The use of geographic information systems has been shown to collect real data on a city’s roads. This work aims to propose a strategy for designing urban solid waste collection routes with the least environmental and economic impacts through an optimization strategy that considers the road network’s real-time data, added to an environmental analysis developed with a life cycle assessment approach. We believe that our results could help the design of urban solid waste collection systems for cities with Latin American characteristics. Additionally, an inventory of specific inputs and emissions for waste collection in this type of city will be generated, supporting future sustainable management strategies.
Introduction
The municipal solid waste (MSW) generation shows a close relationship with the population and economic growth, urbanization rate, and life quality improvement (Lethbridge Citation2017; Margallo et al. Citation2019). In 2018, 2.01 billion t y−1 of MSW was generated globally. The World Bank estimated an increase of 3.4 billion t by 2050 (World Bank Citation2018).
Up to 70% of the MSW management total cost in developing cities can come from MSW collection (Di Maria and Micale Citation2015). In Latin American cities, the door-to-door method is the most popular for collecting MSW, using rear-loading trucks equipped with diesel engines that withstand long-distance travel (Lethbridge Citation2017), incurring high costs mainly from fuel consumption, collection trucks (CT) maintenance, and collection crew salaries (Sousa et al. Citation2018).
Different strategies are found in the literature to reduce these high costs. The concept of eco-driving or fuel-efficient driving had shown to reduce fuel consumption by modifying driving habits in CT. In Spain, Gonzalez et al. (Citation2021) reduced fuel consumption by up to 11.5% for a fleet of 67 CT using eco-driving practices. In addition to fuel consumption, collection routes must consider minimizing distance and time factors (Bonomo et al. Citation2011). Accordingly, several researchers focused on modeling and optimizing MSW collection routes using different parameters.
Inclusion of CT capacity into the models (Alshraideh and Abu Citation2016) or transfer station capacity (Das and Bhattacharyya Citation2015) can reduce the collection route distance by 102 km per week or up to 30% of the distance traveled, respectively. Other strategies are to include within the models the operation times of the CT at each collection point, reducing route time by up to 40% (Laureri, Minciardi, and Robba Citation2016).
Mathematical models need detailed road network information to obtain reliable results (Sulemana et al. Citation2018). Dugdhe et al. (Citation2016) stated that geographic information systems (GIS) are a tool that can help to collect road-network data; this can give flexibility to the optimization models to adapt them to other geographic areas. Arribas, Blazquez, and Lamas (Citation2010) and Lan Vu, Wai Ng, and Bolingbroke (Citation2018) used GIS to reduce operating costs by up to 50% and route distances by up to 13%, respectively. The weaknesses of using GIS are that it does not consider all the road network’s limitations and cannot handle large data sets (Sulemana et al. Citation2018).
Optimization of MSW collection routes operational parameters could improve its environmental profile (Ghiani et al. Citation2014). The environmental burdens associated with the production and use of fossil fuels are related to route distance and collection time (Larsen et al. Citation2010). One scheme to evaluate the MSW collection system’s environmental impacts is life cycle assessment (LCA).
Iriarte, Gabarrell, and Rieradevall (Citation2009) studied two methods for a Spanish city, door-to-door and pneumatic collection. The pneumatic collection increased environmental impacts by 40% compared to the door-to-door method due to the electricity required. Laso et al. (Citation2019) showed that even with the energy consumption of pneumatic collection, the environmental impacts from recycling scenarios could be lower. Taskin and Demir (Citation2020) analyzed the use of transfer stations for a city in Turkey, showing a 45% reduction of Global Warming Potential (GWP) impacts by setting up transfer stations.
LCA requires a life cycle inventory (LCI) with realistic and specific input data, such as fuel consumption, maintenance and cleaning supplies, and outputs as environmental burden emissions (Haya Citation2016). Generating an LCI from the road networks is a complex task; since the data are limited or unavailable.
In the literature, several studies use inventory data that is not necessarily realistic. Di Maria and Micale (Citation2014; Citation2015) utilized German CT inventories to develop an Italian city environmental assessment. Erses Yay (Citation2015) used Swiss MSW transport inventories to evaluate a Turkish collection system. Meanwhile, in Europe, new research is seeking to migrate toward the use of realistic inventories. Laso et al. (Citation2019) in Spain and Taskin and Demir (Citation2020) in Turkey used real data from local MSW collection systems to evaluate their environmental impacts.
Latin America lacks actual information of life cycle inventories, which limits a realistic evaluation of the environmental impacts of MSW collection systems. Gilardino et al. (Citation2017) used Swiss inventories to assess CT’s maintenance in Peru. Aldana-Espitia et al. (Citation2017) and Botello-Álvarez et al. (Citation2018) used generic inventories to calculate the environmental impacts of CT operation for Mexican cities.
The research presented in this paper proposes a strategy to design MSW collection routes with the least environmental and economic impacts, taking as baseline scenarios collection routes in the Monterrey Metropolitan Area (one of the main metropolitan areas in Mexico and Latin America). The work is developed through an optimization strategy that considers real-time road network data, collection truck efficiency, and road directions to reduce the collection route distance. The environmental impact was developed with an LCA approach, providing a realistic MSW collection system LCI. In addition, this study gives a strategy for deploying MSW collection routes and information to design sustainable MSW management plans.
Materials and methods
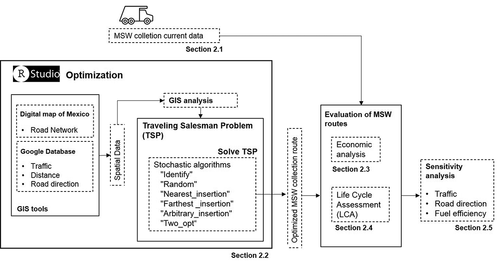
shows the general diagram of the methodology proposed for this work. Section 2.1 presents a characterization of the current MSW collection system based on distances, fuel efficiency, traffic, collection truck capacity, and MSW generation. Section 2.2 introduces the optimization strategy: the city street network data was obtained via GIS tools and fed to Rstudio software to solve the optimization problem, resulting in a collection route. Economic and environmental analyses of the current and optimized collection routes are presented in Section 2.3 and Section 2.4, respectively. The economic analysis takes into account the maintenance and operation costs. The environmental analysis considers the emissions from CT operation and manufacturing maintenance supplies and fuel, following the LCA methodology. Finally, Section 2.5 evaluated the influence of road directions, traffic, and CT fuel efficiency on the MSW collection routes.
Figure 1. General diagram of the optimization methodology
Description of the Monterrey Metropolitan Area and its MSW management system
The Monterrey Metropolitan Area (MMA) is Nuevo Leon’s capital in Northeast Mexico (). The city has a per capita generation of MSW of 1 kg inhab−1 d−1, a total generation of 4,700 t of MSW day−1, and a MSW collection coverage of 95% of the urban area (the remaining 5% accounts for the participation of waste pickers and informal human settlements (SIMEPRODE Citation2015)).
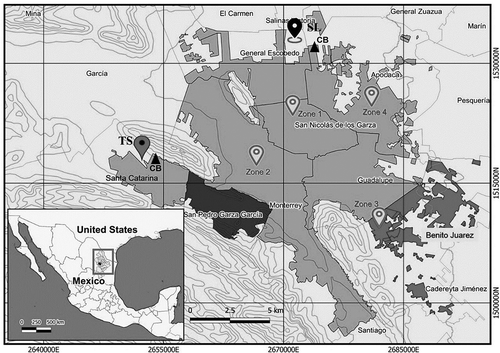
Table S1 in the supplementary material (SM) section summarizes other MMA characteristics and its MSW management system. As case studies, two MSW collection routes were considered, one from the municipality of San Pedro Garza García – –characterized by high socioeconomic indicators and low urban expansion – and another from Benito Juárez, a municipality with opposite characteristics. shows the landfill location, the transfer station, the collection truck bases, and the municipalities studied.
Figure 2. Locations of the Metropolitan Monterrey Area and the municipalities as case studies. TS: Transfer Station, SL: Sanitary Landfill, Zone 1 (streets are exclusively one-way), Zone 2 (75% one-way streets), Zone 3 (25% one-way streets), Zone 4 (only two-way streets). CB: Collection truck base
The municipal government leases the MSW collection service to private companies in charge of the entire operation (San Pedro Municipality Citation2014). The door-to-door method is implemented three times a week through backload CT, which considers that the CT does not stop within the collection zone. Waste containers are solely for industrial and commercial collection, leaving them out of this work scope. In the MMA, after the waste is collected, the CT can go directly to the landfill or go to a transfer station, where they transfer the waste onto trucks with higher loading capacity that take the waste to the landfill (only two municipalities use the transfer station: San Pedro Garza García and Santa Catarina). Table S2 shows the characteristics of the two routes considered as case of study.
Optimization of the MSW collection routes
The optimization of the MSW collection route aims to reduce the distance traveled by the CT. The collection route data is obtained from spatial data via GIS tools (). Rstudio is an environment for the R programming language, which supports GIS analysis and optimization strategies. The GIS analysis is linked to Google Maps®, through the googleway and gmapsdistance libraries in Rstudio, to directly obtain spatial data from the designated area road network, such as street traffic direction, distance, and traffic.
EquationEquation (1)(1)
(1) shows the objective function used to minimize the total route distance traveled by the CT. The interactions among the city blocks are defined by nodes that represent the street intersections or dead-ends. The distance traveled in the route during the collection stage is designated by Z, and Wnp is the weight assigned (in km) to the np-th arc that connects the n-th and p-th nodes. The CT travel is subject to restrictions that ensure the route feasibility, i.e., the road direction, and that the CT cannot be in more than one node simultaneously. This last restriction is given by EquationEquation (2)
(2)
(2) , where the Xnp-th arc has a value of one if a CT is present and zero otherwise. The arcs, denoted by A, represent the distance between two nodes in the collection area. The collection area was selected considering the population (obtained from the national census, (INEGI, Citation2017) and the MSW generation per inhabitant, with 9 t as the CT capacity.
EquationEquations (1(1)
(1) ) and (Equation2
(2)
(2) ) represent the traveling salesman problem shown in the optimization module in , which was solved using the TSP library. The nodes were first identified in the GIS layers of “Mapa Digital de Mexico” – developed by the National Institute of Statistic and Informatics (INEGI) –, which allows the construction, consultation, interpretation, and analysis of geo-referenced geographic and statistical data in Mexico. The node data was transformed into node coordinates in RStudio. The TSP library solves the optimization problem using the distance between the node coordinates, as calculated by GoogleMaps®, and evaluating possible node sequences obtained from different stochastic algorithms (identity, Random, Nearest_insertion, Farthest_ insertion, Arbitrary_insertion, and two_opt), Table S3 describes these algorithms. Finally, the results of all the algorithms were compared to select the path with the shortest distance. Aspects such as traffic are taken from real-time information collected by Google®. GoogleMaps considers the traffic conditions when the call is made; then, at that moment, the traffic conditions are included in the form of speed; Figure S1 in MS shows the code developed in RStudio. The last step compares the optimized and current routes using an economic and environmental analysis described below.
Economic analysis
The MSW collection system incurs several expenses for its correct operation. Sousa et al. (Citation2018) established that maintenance, fuel consumption, and collection-crew salaries account for 90% of the collection budget. EquationEquation (3)(3)
(3) calculates the cost to cover a route (TCr) considering the three costs.
Where Dr is the route distance (km), MC is the maintenance cost per distance traveled (USD km−1), CFC is the cost of fuel consumption per distance traveled (USD km−1), Sr is the cost of the collection crew salaries per route (USD route−1), and r is a collection route that belongs to the R set of routes for a given municipality. These costs were obtained from the collection companies of San Pedro Garza García and Benito Juarez municipalities. EquationEquation (3)(3)
(3) shows that the only cost not considered dependent on distance is labor cost. Salaries are paid on a work-shift basis. However, for collection systems where crew costs are paid by the hour, EquationEquation (3)
(3)
(3) can be modified to integrate it by relating the kilometers traveled per CT operation hour.
Life cycle assessment implementation
Goal and scope definition
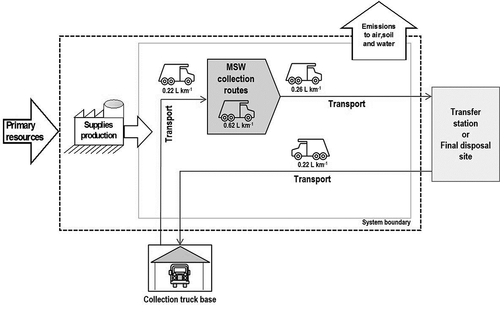
shows the boundaries for the current MSW collection system. The system comprises the process of MSW collection and transport. The first is represented by the gray polygon (MSW collection route) and the second by solid gray lines when the MWS are transported directly to the landfill or through a transfer station. The system boundaries include all the resources needed for operational and maintenance activities of MSW collection, such as fuel, cleaning products, tires, and maintenance supplies. The construction of infrastructure and equipment production (buildings and CT), maintenance garage activities, operations in transfer stations, and administrative activities are outside the system boundaries since they are not affected by the route optimization.
Figure 3. System boundaries of the municipal solid waste collection system in the Monterrey Metropolitan Area
The functional unit (FU) considered in this work is collecting and transporting 1 t of MSW from the source to the transfer station or final landfill site. The reference flow is 1 t of MSW transported per kilometer.
Life cycle inventory (LCI) determination
The resources needed for the operation of the CT were evaluated for the case studies based on the distance traveled and fuel consumption. shows the fuel efficiencies at different stages, transport efficiencies (gray lines) for the empty or full CT, and collection (gray polygon). These efficiencies are obtained from the records of the MSW collection company.
This study considered the consumption of tires, preventive and corrective maintenance supplies, and cleaning products used during one year of operation for a fleet of eleven CT to establish the maintenance and cleaning inventory. All CTs are backloading, diesel-powered, and have a collection capacity of nine t. Table S4 shows the necessary maintenance inputs per CT during 2017 for the analyzed fleet (this information comes from accurate data obtained from an MSW collection company). To calculate the consumption per kilometer traveled is used the CT fleet total distance for the same year. Table S5 indicates the mass of the maintenance supplies inputs (through an equivalence factor) and their compositions on a mass basis. Each composition was obtained from technical datasheets and scientific articles; the composition of batteries and filters for lubricant oils were taken from Sullivan and Gaines (Citation2010) and Gaidajis et al. (Citation2011), respectively. The Ecoinvent v3.1 database was used to consider the individual LCI of maintenance and cleaning supplies. Finally, the GREET life cycle model is used to determine the emissions generated by the fuel consumption in the CT (GREET Citation2015).
Life cycle impact assessment
Following the recommendations by Larsen et al. (Citation2009) and the International Environmental Product Declarations (EPD) system (a global program for environmental declarations based on ISO 14025 and EN 15804, (EPD Citation2015)), only the most relevant impact categories were considered: Climate Change (CC), Terrestrial Acidification (TA), Particulate Matter Formation (PMF), and Ozone Depletion (OD). In addition, the Fossil Depletion (FD) category was also included due to the high diesel consumption in the MSW collection and transport (Aldana-Espitia et al. Citation2017).
The life cycle impact assessment (LCIA) model of the MSW collection system was constructed using the LCA software SimaPro 8.3.0 PhD® (PReConsultants, Amersfoort, The Netherlands). The LCIA was performed according to the ReCiPe 2016 midpoint level (Goedkoop et al. Citation2013).
Sensitivity analysis
The road direction on MSW collection routes
The analysis reveals the effect of the road direction distribution in the optimization of MSW collection routes. For the study, the optimization of four zones within the MMA with the same size (number of blocks) but with different road direction distribution was considered:
Zone 1: 100% of one-way streets
Zone 2: 75% one-way streets and 25% two-way streets
Zone 3: 25% one-way streets and 75% two-way streets
Zone 4: 100% of two-way streets
The results of each optimized route were compared according to the MSW collection route’s distance. shows the location of these four zones.
The traffic on MSW collection routes
A sensibility analysis accounting for the traffic effect at different moments of the day (morning, afternoon, and night) for three days a week (Monday, Wednesday, and Friday) on optimizing an MSW collection route was performed. In order to calculate the traffic, a comparison between CT speed in the collection route and the distance obtained in each run has been done.
Fuel efficiency on economic and environmental analysis
This sensibility analysis evaluates CT fuel efficiency’s effect on MSW collection routes economic and environmental indicators. CT current fuel efficiency was used as a central point, and points considering a 10 and 20% efficiency increase and decrease were proposed. An economic and environmental analysis was performed for each of the four proposed efficiencies, considering the fuel cost and emissions from its use, as described in Sections 2.3 and 2.4.
Results and discussion
Optimization of selected routes
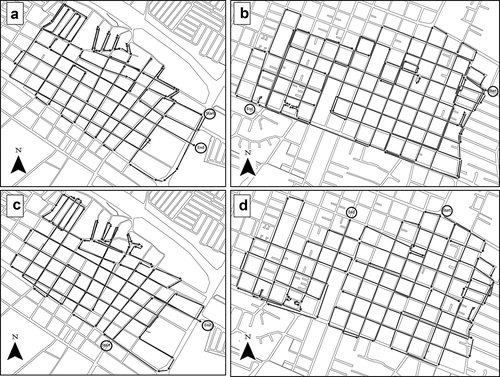
The collection routes of Benito Juárez (BJ) and San Pedro Garza García (SP) are shown in . The current routes () and optimized routes () for BJ and SP are denoted with black dashed lines. Besides, in all routes, the start and end locations are indicated with a black circle. Thus, displays, the differences between the current and optimized routes due to that some nodes of the existing routes were eliminated because they represent uninhabited lots or parks. The SP route’s optimization decreased 10% (2.4 km) in total distance traveled and 9% (3.2 L) in fuel consumption; meanwhile, in the BJ route’s optimization the distance was reduced by 20% (5.3 km) and fuel consumption by 21% (8.3 L).
Figure 4. Collection routes of Benito Juarez municipality: current (A) and optimized (C). Collection routes of San Pedro Garza Garcia municipality: current (B) and optimized (D)
It is crucial to notice that urban conditions cause differences in distance reduction. The sensitivity analyses presented below (Sections 3.1.1 and 3.1.2) explain how these conditions affect route optimization.
Effect of road direction on MSW collection routes
shows the percentage of two-way streets versus the minimized distances (regarding the current MSW route) for the four zones selected ( and Section 2.1). As seen in this figure, the analysis indicates that more two-way streets allow for a significant distance reduction in the MSW collection-route design. Furthermore, zones with high two-way street proportion have more alternatives for path generation in the route design.
Figure 5. Sensitivity analysis of optimization results based on street traffic direction
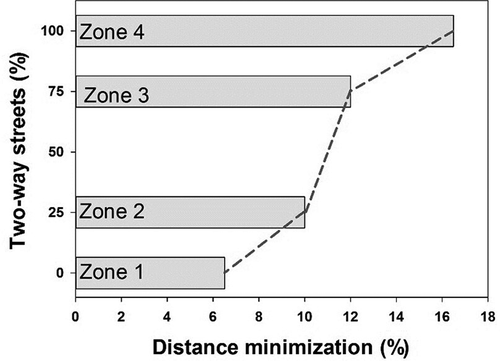
In , it is clearly show that the relationship between distance reduction and road direction does not keep the same proportion. In addition, regarding existing collection routes, the design and optimization strategy for collection routes proposed in this study for zones with a ratio of 100% of two-way streets can reduce the distance by 17%, 2.5 times more than in zones with 0% two-way streets.
The SP collection route has the same number of two-way streets as Zone 2 and similar distance reduction. In contrast, BJ’s collection route has 85% of streets with two directions but shows a distance minimization of 20%, more than Zone 4. This difference can be explained by taking into account that Zone 4 is located next to an industrial park, while the BJ route is located in a residential area. In agreement with the above, the State Roads and Mobility Council mentioned that the industrial zones present higher traffic at several moments of the day (Lara-Vázquez et al. Citation2019). Finally, each optimization was carried out under the same conditions (day and time), so the variations observed in can be attributed to the traffic effect on the MSW collection route. The following section evaluates this issue.
The effect of Traffic on MSW collection routes
shows SP collection route optimization results in terms of distance and speed of CT at different moments during the collection days of week 31 of 2020. The traffic level was taken directly from Google maps; the black triangles indicate high traffic and the gray ones low traffic; in each point, the CT average speed on the route is indicated.
Figure 6. Sensitivity analysis of optimization with different collection days of week 31 of 2020
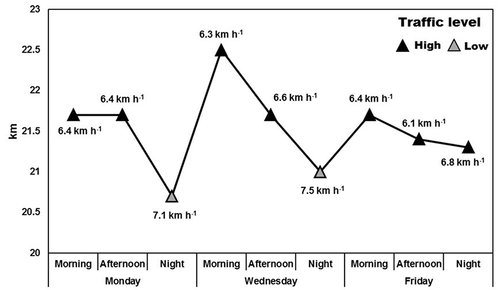
As shown in this figure, the low traffic represents a higher speed in the CTs and shorter distances in the collection routes. According to the State Roads and Mobility Council estimated that high-traffic hours are in the morning (6:30–9:30) and afternoon (18:00–20:00) (Lara-Vázquez et al. Citation2019). Consequently, the longest collection routes were observed in the morning, which took place at 8:00 am, repeating this pattern on the three days of the week when collection takes place. In contrast, the shortest distances were obtained during the Monday and Wednesday nights, exhibiting the fastest collections and the minimal distance in the MSW collection. Although the Friday night route indicated high traffic, the collection routes still had shorter distances and high speed, probably due to weekend habits.
Actually, the SP MSW collection is in the morning because of noise restrictions imposed by neighbors to avoid disturbing them at night. These results show that shifting operation to the night could reduce the distance from 2% to 7% and increase from 4% to 18% of the CT’s operation speed. This information initiates a new discussion on priorities for decision-makers to choose and search for the best option for the city.
The results in this study agree with the other works found in the literature of MSW collection. For example, Das and Bhattacharyya (Citation2015) in India, Akthar et al. (Citation2017) in Malaysia, and Erfan et al. (Citation2019) in Iran reduced the MWS routes distances by 30, 37, and 25%, respectively. These investigations consider a combination of the door-to-door and container MSW collection methods, removing the need to travel all streets in a selected area. However, this study’s optimization results demostrate 10 and 20% reductions for the SP and BJ collection routes, respectively. Besides, these low values might be caused by both the door-to-door method considered in the collection system studied (the most used method in Latin America according to World Bank (Citation2018)) and street characteristics. As shown in Section 3.1.1, street limitations might result in a lower distance reduction in the design and optimization of collection routes ().
Economic analysis
The results of the economic analysis are presented in . Costs were classified according to Section 2.3. Each MSW-route total budget was divided into the MSW collection and transport stage (current and optimized).
Table 1. Cost breakdown for each route in USD
The optimization analysis for the SP and BJ scenarios decrease the collection costs stage by 5% and 16%, respectively. Therefore, a reduction of cost in the transport stage of 1% for SP and 4% for BJ is obtained when the total budget is considered. The modification of the start and end points () in the collection route, revealed a reduction between the current and optimized transport costs of 1% for both scenarios.
In the current SP collection route, the Sr and CFC costs have the highest contributions; while in the BJ route, the CFC is significantly higher. And could be explained by considering that the distance of the BJ route is 11% longer than the SP route. In terms of the current MSW route, the transport stage consumes 78% of the total budget for SP and BJ. In net economic terms, the cost of the transport stage in BJ is greater than the SP route (); this stems from SP using a transfer station to send the MSW to the sanitary landfill. Sr costs can be observed with no difference between the current and optimized routes (), because salaries are per day, not per hour.
In this way, for the context of México, most of the salaries for the collection workers are defined per day, modification toward hourly salaries could have a significant influence on coverage and costs. Additionally, fuel consumption represents up to 57% of the total budget (see ). In contrast, Sousa et al. (Citation2018) reported that diesel consumption represents 14% of the budget for European cities. The strategy proposed in this work provides an option for MSW collection systems in Mexico where, as in the rest of the Latin American countries, there is not stable financial structure to improve collection equipment or modify collection methods, and installation of transfer stations is not a common practice (Hettiarachchi et al. Citation2018).
Environmental impact assessment
presents the environmental contribution of the collection, transport, and maintenance stages for the current and optimized routes. Five sets of columns are shown, each corresponding to a midpoint impact category (Section 2.4.3). The quantitative information covered in this section can be consulted in Tables S6 and S7.
Figure 7. Environmental impact assessment of the current and optimized routes
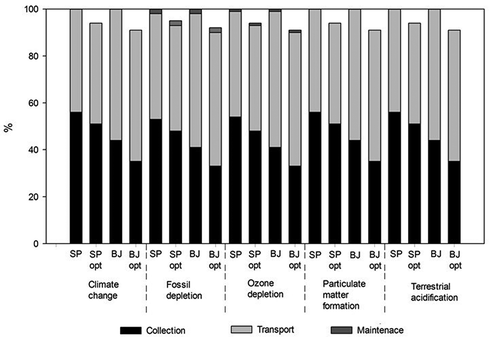
The optimization results, in , showed a reduction in CC indicator of 6% and 9% for the SP and BJ MSW route, equivalent to 0.71 and 1.18 kg CO2 eq FU−1, respectively. The maintenance stage is minimal for this same indicator, given that greenhouse gas (GHG) emissions are 99.98% caused by diesel consumption (14% in production and 86% in combustion). For the MSW SP route, the collection stage was the highest contributor with 56%, on the contrary to the MSW BJ route, with 56% in the transport stage, mainly caused by the distance that the BJ CT travels to the landfill (Table S2) and the absence of a transfer station. The SP collection stage has 15% more GHG emissions than the BJ collection stage; which could be attributed to the fact that SP CTs collect fewer t of MSW in each trip, affecting collection efficiency.
A similar trend in CC was for the rest of the indicators (). The contributing emissions in these indicators have a strong relationship with diesel consumption (for optimized and current routes). For PMF, diesel production has a contribution of 42% and the remainder from fuel burning. The main environmental burdens in this indicator are NOX (63%), SOX (25%), and PM2.5 (8%). In the case of TA, diesel production contributes 53%, and the rest comes from its combustion. The gas emissions in this indicator are NOX (56%), and the rest are SOX.
The FD and OD indicators present a small but visible contribution in the maintenance stage (2% and 1%, respectively), caused by supplies production (Tables S4 and S5). For these indicators, diesel combustion has no influence; fuel production and maintenances supplies are the main contributors. In FD, crude oil consumption has 94% participation, and the rest is distributed in natural gas and coal. For OD, 98.5% of this indicator comes from bromotrifluoro methane emissions into the air (Halon 1301) in the diesel production process.
The effect of fuel efficiency on MSW collection stage
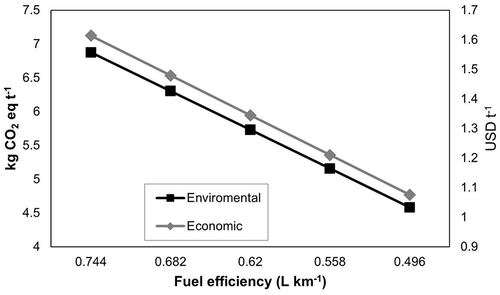
shows the environmental and economic impacts for t of MSW collected at different fuel consumption efficiencies in CT. The sensitivity analysis is based on the BJ collection stage, considering an average collection of 7.8 t (Table S2). shows a linear trend, where lower fuel efficiencies increase costs and GHG emissions in the same proportion. The CT fuel efficiency is currently 0.62 L km−1, corresponding to 1.35 USD and 5.7 kg CO2 for t MSW. It is essential to increase fuel efficiency in CT to reduces costs and environmental impacts in MSW collection systems.
Figure 8. Fuel efficiency versus cost and environmental impact
CT fuel efficiency in the MSW management of MMA is similar to Akthar et al. (Citation2017), 0.67 L km−1 in a Malaysian city, a developing country with rapid urban growth (World Bank Citation2020). Maimoun et al. (Citation2013) reported efficiencies of 0.77 L km−1 for CT with more than eight years of use. The age of trucks is another factor that must be considered to improve the ecoefficiency of these systems.
Tables S6 and S7 indicate GHG emissions of 10–13 kg CO2 eq t−1 of MSW collected, lower than the value reported by Aldana-Espitia et al. (Citation2017) with 30.5 kg CO2 eq t−1 for a city in the central region of Mexico, that mostly uses CT with more than ten years. Iriarte, Gabarrell, and Rieradevall (Citation2009) evaluated different collection methods for European scenarios and showed 3.8 kg CO2 eq t−1 using the same method. These differences are related to the cities financial capacity to invest in CT with better fuel efficiencies.
In addition to the use of optimization algorithms and GIS tools, other alternatives can be explored to design sustainable MSW collection routes, such as alternative fuels. Maimoun et al. (Citation2013) demonstrated that biodiesel reduces 12% and 75% of GHGs from diesel, depending on the biodiesel blend. Natural gas is 30% cheaper than diesel per kilometer traveled in CT, and according to projections by the United States Energy Information Administration (USEIA), it could reach 38% by 2035. Natural gas in Mexico, mainly in the MMA, is the alternative that the government has given priority to reducing environmental impacts, especially mitigating particulate emissions, which poses critical environmental and health problems in the region. However, for Mexican scenarios switching their collection method can be difficult when 70% of the country’s municipalities have limited financial possibilities to improve their MSW collection systems (BID Citation2015).
Conclusion
The methodology presented in this work can reduce the distance of collection routes by up to 20%. The most influential factor in the optimization algorithm was shown to be the direction of the road. Road characteristics can influence the optimization results by up to 9%, with two-way streets leading to the most significant reduction in distance traveled. In addition, the MMA vehicle flow showed that traffic affects the optimization by up to 7% in the reduced distances, establishing the night as the best collection time, allowing municipal waste managers to consider the importance of diversifying collection schedules.
The economic and environmental analysis demonstrated that diesel consumption is the main factor that Mexican collection systems should target. For example, fuel consumption is determined to spend between 47 and 57% of the total budget for the proposed case studies, emitting up to 86% of GHGs. Optimization of the collection stage achieved an increase of up to 20% in fuel efficiency. Collection efficiency indicated that a 20% increase in t collected could reduce GHG emissions by 15% of the collection stage. Maintenance of the CT represented 19–23% of the total budget. Its contribution to environmental impact was considered inconsequential due to high fuel consumption; however, this may change as the CT’s age increases.
The routes, considered as the case of study in this work, correspond to actual routes developed and deployed by a private company with broad experience and recognition in the field. Thus, besides the environmental and economic improvements, this work offers a feasible and robust methodology for designing sustainable MSW collection routes. However, to further improve the collection system, other factors must be considered, such as the continuous update of the collection fleet with more efficient and cleaner CT and the inclusion of MSW transfer stations.
Supplementary_Material_Final_Clean.docx
Download MS Word (116.8 KB)Acknowledgment
The authors thank Consejo Nacional de Ciencia y Tecnologia (CONACYT) for the financial support: project No. CB-2015- 254294, the graduate scholarship (781367), and Facultad de Ciencias Químicas, Universidad Autonoma de Nuevo Leon.
Disclosure statement
No potential conflict of interest was reported by the author(s).
Supplemental material
Supplemental data for this paper can be accessed on the publisher’s website.
Additional information
Funding
Notes on contributors
Reyes Benitez-Bravo
Reyes Benitez-Bravo has a Ph.D. in the graduate program in Sustainable Processes at Universidad Autonoma de Nuevo Leon. He is engaged in the research of municipal solid waste collection, logistic, life cycle assessment, and applications of geographic information systems.
Ricardo Gomez-González
Ricardo Gomez-Gonzalez is a Professor in the Chemical Engineering Department at Universidad Autonoma de Nuevo Leon. Dr. Gomez-Gonzalez’s research interests include solid waste management, landfill siting, process simulation and optimization, and engineering education. He is an active member of the research group in Process Simulation and Process Control. Alongside his research endeavors, Dr. Gomez-Gonzalez is an enthusiastic educator, teaching advanced courses on process simulation, process control, oil and gas processing, advanced math, and process optimization.
Pasiano Rivas-García
Pasiano Rivas-García is an associate professor in the Centre for Research on Biotechnology and Nanotechnology at the Autonomous University of Nuevo Leon. His scientific activity evaluates waste valorization strategies through life cycle assessment, process simulation, mathematical modelling and experimental design. Pasiano is a member of the National System of Researchers and the Mexican Academy of Research and Teaching in Chemical Engineering.
José Enrique Botello-Álvarez
José Enrique Botello-Álvarez is a researcher in the area of process engineering. His research areas are developing processes to recover food losses and waste and transport phenomena in bioreactors. He is a graduate and professor of the National Technological Institute of Mexico in Celaya where he teaches process engineering and unit operations in the Department of Biochemical Engineering. Enrique is a member of the National System of Researchers Level II and a Mexican Academy of Research and Teaching member in Chemical Engineering.
Oscar Francisco Huerta-Guevara
Oscar Francisco Huerta-Guevara is a professor in the chemical engineering department at Universidad Autonoma de Nuevo Leon. His research interests include, nonlinear process control, nonlinear optimization, state estimators in real time (observers) and engineering education. The Dr. Huerta-Guevara is an active member of the research group in process control and optimization. With the chemical department professors group, the professor Huerta-Guevara contributes to teach courses on process control, advanced math, electrical engineering, and optimization in undergraduate and graduate levels.
Azucena Minerva García-León
Azucena Minerva García-León is a Full Time Professor at Chemical Sciences School of the Universidad Autónoma de Nuevo León. She is a member of the undergraduate and graduate in Industrial Engineering, teaching advanced courses on statistical process control, probability, statistics and experimental design, six sigma, total quality management. She provides instruction to industrial sector on Lean Sigma for certifications in Green Belt and Black Belt. She has been working as researcher in the field of risk analysis, lean manufacturing, six sigma, analysis and experimental design, production processes reliability and optimization.
Juan Felipe Rueda-Avellaneda
Juan Felipe Rueda-Avellaneda is a Ph.D. candidate at Universidad Autonoma de Nuevo Leon in the graduate program in Sustainable Processes. He is engaged in the research of municipal solid waste management, landfill siting, waste-to-energy, and applications of geographic information systems.
References
- Akthar, M., M. A. Hannan, R. A. Begum, H. Basri, and E. Scavino. 2017. Backtracking search algorithm in CVRP models for efficient solid waste collection and route optimization. Waste Manage. 61:117–28. doi:https://doi.org/10.1016/j.wasman.2017.01.022.
- Aldana-Espitia, N. C., J. E. Botello-Álvarez, P. Rivas-García, F. J. Cerino-Córdova, M. G. Bravo-Sánchez, J. E. Abel-Seabra, and A. Estrada-Baltazar. 2017. Environmental impact mitigation during the solid waste management in an industrialized city in Mexico: An approach of life cycle assessment. Rev. Mex. Ing. Quím. 19:563–80. https://www.redalyc.org/articulo.oa?id=620/62052087021.
- Alshraideh, H., and H. Abu. 2016. Stochastic modeling and optimization of medical waste collection in Northern Jordan. J. Mater. Cycles Waste Manage. 19:743–53. doi:https://doi.org/10.1007/s10163-016-0474-3.
- Arribas, C. A., C. A. Blazquez, and A. Lamas. 2010. Urban solid waste collection system using mathematical modelling and tools of geographic information systems. Waste Manage. Res. 28:355–63. doi:https://doi.org/10.1177/0734242X09353435.
- BID (Banco interamericano de desarrollo). 2015. Situación de la gestión de residuos sólidos en América Latina y el Caribe. Accessed January 22, 2020. https://publications.iadb.org/es/situacion-de-la-gestion-de-residuos-solidos-en-america-latina-y-el-caribe.
- Bonomo, F., G. Durán, F. Larumbe, and J. Marenco. 2011. A method for optimizing waste collection using mathematical programming: A Buenos Aires case study. Waste Manage. Res. 30:311–24. doi:https://doi.org/10.1177/0734242X11402870.
- Botello-Álvarez, J. E., P. Rivas-García, L. Fausto-Castro, A. Estrada-Baltazar, and R. Gomez-Gonzalez. 2018. Informal collection, recycling and export of valuable waste as transcendent factor in the municipal solid waste management: A Latin-American reality. J. Clean. Prod. 182:485–95. doi:https://doi.org/10.1016/j.jclepro.2018.02.065.
- Das, S., and B. K. Bhattacharyya. 2015. Optimization of municipal solid waste collection and transportation routes. Waste Manage. 43:9–18. doi:https://doi.org/10.1016/j.wasman.2015.06.033.
- Di Maria, F., and C. Micale. 2014. A holistic life cycle analysis of waste management scenarios at increasing source segregation intensity: The case of an Italian urban area. Waste Manage. 34:2382–92. doi:https://doi.org/10.1016/j.wasman.2014.06.007.
- Di Maria, F., and C. Micale. 2015. Life cycle analysis of management options for organic waste collected in an urban area. Environ. Sci. Pollut. Res. 22:248–63. doi:https://doi.org/10.1007/s11356-014-3330-9.
- Dugdhe, S., P. Shelar, S. Jire, and A. Apte. 2016. Efficient waste collection system. International Conference on Internet of Things and Applications (IOTA), Maharashtra Institute of Technology, Pune, India, January 22–24. doi:https://doi.org/10.1109/IOTA.2016.7562711.
- Erfan, B. T., M. Iraj, S. E. Mir Mehdi, and W. Gerhard-Wilhelm. 2019. A hybrid augmented ant colony optimization for the multi-trip capacitated arc routing problem under fuzzy demands for urban solid waste management. Waste Manage. Res. 38:156–72. doi:https://doi.org/10.1177/0734242X19865782.
- Erses Yay, A. S. 2015. Application of life cycle assessment (LCA) for municipal solid waste management: A case study of Sakarya. J. Clean. Prod. 94:284–93. doi:https://doi.org/10.1016/j.jclepro.2015.01.089.
- Gaidajis, G., K. Angelakoglou, N. P. Botsaris, and F. Filippidou. 2011. Analysis of the recycling potential of used automotive oil filters using the Life Cycle Assessment approach. Resour. Conserv. Recycl. 55:986–94. doi:https://doi.org/10.1016/j.resconrec.2011.05.008.
- Ghiani, G., D. Laganà, E. Manni, R. Musmanno, and D. Vigo. 2014. Operations research in solid waste management: A survey of strategic and tactical issues. Comput. Oper. Res. 44:22–32. doi:https://doi.org/10.1016/j.cor.2013.10.006.
- Gilardino, A., J. Rojas, H. Mattos, G. Larrea-Gallegos, and I. Vázquez-Rowe. 2017. Combining operational research and life cycle Assessment to optimize municipal solid waste collection in a district in Lima (Peru). J. Clean. Prod. 156:589–603. doi:https://doi.org/10.1016/j.jclepro.2017.04.005.
- Goedkoop, M. J., R. Heinjungs, M. A. Huijbregts, A. Schryver, J. Struijs, and R. Van Zelm. 2013. ReCiPe 2008: A life cycle assessment method which comprises harmonized category indicators at the midpoint and the endpoint level, 1st ed. (revised), report I: Characterization. The Hague: Ministerie van VROM. https://www.researchgate.net/publication/302559709_ReCiPE_2008_A_life_cycle_impact_assessment_method_which_comprises_harmonised_category_indicators_at_the_midpoint_and_the_endpoint_level
- Gonzalez, J. F., A. G. Izquierdo, F. Commans, and M. Carlos. 2021. Fuel-efficient driving in the context of urban waste-collection: A Spanish case study. J. Clean. Prod. 289:125831. doi:https://doi.org/10.1016/j.jclepro.2021.125831.
- GREET. (2015). The greenhouse gases,regulated emissions,and energy use in transportation,GREET model. Chicago: Argonne National Laboratory. https://www.anl.gov/es/lifecycle-analysis
- Haya, E. 2016. Análisis de Ciclo de Vida. Escuela de organización industrial. https://www.eoi.es/es/file/66611/download?token=BTXaL249.
- Hettiarachchi, H., S. Ryo, S. Caucci, and R. Silva. 2018. Municipal Solid Waste Management in Latin America and the Caribbean: Issues and potential solutions from the governance perspective. Recycling 3:19. doi:https://doi.org/10.3390/recycling3020019.
- INEGI (Instituto Nacional de Estadística y Geografía). 2017. Conociendo Nuevo León. Accessed January 21, 2020. https://www.inegi.org.mx/app/biblioteca/ficha.html?upc=702825098148.
- International EPD System. 2015. Product category rules for solid waste disposal services (version 3.0). www.environdec.com
- Iriarte, A., X. Gabarrell, and J. Rieradevall. 2009. LCA of selective waste collection systems in dense urban areas. Waste Manage. 29:903–14. doi:https://doi.org/10.1016/j.wasman.2008.06.002.
- Lan Vu, H., K. Wai Ng, and D. Bolingbroke. 2018. Parameter interrelationships in a dual phase GIS-based municipal solid waste collection model. Waste Manage. 78:258–70. doi:https://doi.org/10.1016/j.wasman.2018.05.050.
- Lara-Vázquez, A., J. Leo-Lozano, M. Jano-Ito, S. Vilchis-Jiménez, S. Montero-Aguilar, A. De la Rosa-Segura, C. Neri-Villeda, J. García-Escalante, M. D. Gómez-Sánchez, N. Hernández-Valdez, T. Torres-Pelenco, and H. A. Barrera-Huertas. 2019. Propuestas para el desarrollo sustentable de una ciudad mexicana. Estudio del Área Metropolitana de Monterrey. Centro Mario Molina para estudios estratégicos sobre energía y medio ambiente A.C. http://aire.nl.gob.mx/docs/reportes/Propuestas_de_sustentabilidad_Monterrey.pdf.
- Larsen, A. W., H. Merrild, J. Møller, and T. H. Christensen. 2010. Waste collection systems for recyclables: An environmental and economic assessment for the municipality of Aarhus (Denmark). Waste Manage. 30:744–54. doi:https://doi.org/10.1016/j.wasman.2009.10.021.
- Larsen, A. W., M. Vrgoc, T. H. Christensen, and P. Lieberknecht. 2009. Diesel consumption in waste collection and transport and its environmental significance. Waste Manage. Res. 27:652–59. doi:https://doi.org/10.1177/0734242X08097636.
- Laso, J., I. García-Herrero, M. Margallo, A. Bala, P. Fullana-i-Palmer, A. Irabien, and R. Aldaco. 2019. LCA-based comparison of two organic fraction municipal solid waste collection systems in historical centres in Spain. Energies 12:1407. doi:https://doi.org/10.3390/en12071407.
- Laureri, F., R. Minciardi, and M. Robba. 2016. An algorithm for the optimal collection of wet waste. Waste Manage. 48:56–63. doi:https://doi.org/10.1016/j.wasman.2015.09.020.
- Lethbridge, J. 2017. Municipal solid waste management services in Latin America. Public Services International Research Unit (PSIRU). www.psiru.org.
- Maimoun, M. A., D. R. Reinhart, F. T. Gammoh, and P. McCauley Bush. 2013. Emissions from Us waste collection vehicles. Waste Manage. 33:1079–89. doi:https://doi.org/10.1016/j.wasman.2012.12.021.
- Margallo, M., K. Ziegler-Rodriguez, I. Vázquez-Rowe, R. Aldaco, Á. Irabien, and R. Kahhat. 2019. Enhancing waste management strategies in Latin America under a holistic environmental assessment perspective: A review for policy support. Sci. Total Environ. 689:1255–75. doi:https://doi.org/10.1016/j.scitotenv.2019.06.393.
- San Pedro Muncipality. 2014. Contrato y/o título administrativo de concesión de los servicios públicos municipales de recolección y traslado de residuos sólidos urbanos no peligrosos generados en el municipio de San Pedro Garza García, Nuevo León. Municipio de San Pedro Garza García, Dirección de asuntos jurídicos. https://www.sanpedro.gob.mx/transparencia/ConcesionesPermisos/concesionesBasura.pdf.
- SIMEPRODE Secretaria de desarrollo sustentable. 2015. Programa estatal de gestión integral de residuos de nuevo león. Gobierno del estado de Nuevo León. https://www.gob.mx/cms/uploads/attachment/file/187464/Nuevo_Le_n.pdf.
- Sousa, V., C. Dias-Ferreira, J. M. Vaz, and I. Meireles. 2018. Life-cycle cost as basis to optimize waste collection in space and time: A methodology for obtaining a detailed cost breakdown structure. Waste Manage. Res. 36:788–99. doi:https://doi.org/10.1177/0734242X18774618.
- Sulemana, A., E. A. Donkor, E. K. Forkuo, and S. Oduro-Kwarteng. 2018. Optimal routing of solid waste collection trucks: A review of methods. J. Eng. 2018:1–12. doi:https://doi.org/10.1155/2018/4586376.
- Sullivan, J. L., and L. Gaines. 2010. A review of battery life-cycle analysis: State of knowledge and critical needs. Energy Systems Division, Argonne National Laboratory. http://www.osti.gov/bridge.
- Taskin, A., and N. Demir. 2020. Life cycle environmental and energy impact assessment of sustainable urban municipal solid waste collection and transportation strategies. Sustainable Cities Soc. 61:102339. doi:https://doi.org/10.1016/j.scs.2020.102339.
- World Bank Group. 2018. What a waste 2.0 A global snapshot of solid waste management to 2050. Accessed January 20, 2020. https://openknowledge.worldbank.org/handle/10986/30317.
- World Bank Group. 2020. Doing business. Comparing business regulation in 190 economies. https://openknowledge.worldbank.org/bitstream/handle/10986/32436/9781464814402.pdf.