
 ?Mathematical formulae have been encoded as MathML and are displayed in this HTML version using MathJax in order to improve their display. Uncheck the box to turn MathJax off. This feature requires Javascript. Click on a formula to zoom.
ABSTRACT
In the context of workplace safety, activated carbon in the fiber form (i.e., activated carbon fiber, ACF) represents an alternative adsorbent to granular activated carbon (GAC) for use in organic vapor respiratory protection devices. ACFs are high surface area carbonaceous materials that are often available in a self-supporting non-woven form. The physical form of ACF suggests the potential for a filtration medium that is capable of supporting both organic vapor adsorption and particulate filtration. To study the application of these materials in respiratory protection devices, ACFs (ACFF 1200 m2/g, ACFF 1800 m2/g, and ACFF 2000 m2/g) were challenged with representative organic vapors (toluene, hexane, and methyl ethyl ketone (MEK)) at an occupationally relevant concentration (200 ppm). Breakthrough curves were generated for at least three different bed weights of adsorbent. Pressure drop (i.e., the resistance across the filtration media) was also measured to determine maximum ACF bed depths for use in respiratory protection devices. Breakthrough experiments indicate that ACFF 2000 has the highest adsorption capacity for toluene (381 mg/g), followed by ACFF 1800 and ACFF 1200 (344 mg/g and 239 mg/g, respectively). A similar trend was observed for hexane: 221 mg/g, 196 mg/g, and 146 mg/g for ACFF 2000, ACFF 1800, and ACFF 1200, respectively. ACFF 1200 showed the highest adsorption capacity for the polar adsorbate MEK (168 mg/g), followed by ACFF 1800 and ACFF 2000 (166 mg/g and 147 mg/g, respectively). Based on the constraints of pressure drop, it seems unlikely the exclusive use of ACF in a filtering facepiece respirator can provide an adsorbent mass sufficient for full shift protection against organic vapor contaminants at or above the legally enforceable permissible exposure level (PEL). Nevertheless, the incorporation of ACF into a facepiece respirator appears promising for “nuisance odor” applications; i.e., the further reduction of organic vapor concentrations when workplace exposures are already below PEL concentrations.
Implications: This research brings innovation to the field of occupational health and air pollution control technology by investigating the adsorption performance of activated carbon fiber (ACF) media in the context of worker respiratory protection. ACF properties such as high specific surface area (m2/g), high permeability to airflow, and rapid adsorption kinetics make it ideal for use in thin, N95-style respirators for organic vapors. Respiratory protection is an exciting and relevant application for ACF media. A lightweight adsorbent such as ACF, if incorporated into an N95-style respirator, could potentially provide nuisance-level VOC protection in a physical form that is accessible to workers and consistent with OSHA’s voluntary use provisions for facepiece respirators. The research presented in this manuscript represents one of several steps planned in the characterization of ACF media for this particular application.
Introduction
In the United States, an estimated 5 million workers are required to wear respirators on a regular basis (Occupational Safety and Health Administration Citationn.d.). Unmitigated exposure to airborne contaminants in the workplace can result in a variety of health effects, including, but not limited to, interstitial lung disease related to the inhalation of particulate matter, hypersensitivity reactions related to the inhalation of particulate matter and/or organic vapors, and various short and long term health effects, including both acute toxicity syndromes and cancer (Cartier and Bernstein Citation2018).
Workers who are exposed to airborne cotaminants above permissible exposure limits (PELs) may require the use of respiratory protection. Based on the complexity of many workplace exposures, the use of both particulate and gas-phase respirators is often indicated (Plog, Niland, and Quinlan Citation1996). Exposure to a complex mix of airborne contaminants occurs in a variety of workplaces: these workplaces can include industrial settings in which workers are exposed to both volatile organic compounds (VOCs) and liquid aerosols that may result from the use of spray coatings, adhesives, and cleaning solvents; healthcare settings in which workers may be exposed to infectious aerosols, potent pharmaceutical compounds, VOC-containing surgical smoke, and vapor-phase disinfectants (Choi et al. Citation2018; Rozzi, Snyder, and Novak Citation2012); and a variety of law enforcement and first responder settings (Reinhardt and Broyles Citation2018).
While no single disposable or re-usable respirator is capable of providing protection against all possible airborne contaminants, several options currently exist for combined particulate and vapor filtration (Plog, Niland, and Quinlan Citation1996). Organic vapor respirator cartridges that fit elastomeric half-face or full-face respirators typically consist of granular activated carbon (GAC) housed within a plastic filter assembly and sandwiched between several layers of non-woven material, which serves to contain the granular media and provide some measure of particulate filtration.
GAC removes contaminants from the air through adsorption. Adsorption occurs as the result of a weak physical attraction (Van der Waals force) between a gas-phase molecule (adsorbate) and a solid surface (adsorbent). Because adsorption is a physical process, it is highly dependent on the surface characteristics of the adsorbent, and particularly on surface area (Webb and Orr Citation1997). The high surface area of GAC stems from the activation process, which imparts an extensive pore structure to the adsorbent. Within the resulting pore structure, pores less than 2 nm in width (micropores) are the most favorable sites for adsorption, due in large part to the combined attractive force exerted by the narrow pore walls of micropores on the adsorbate molecule (Hayes Citation1994). Both the total surface area and the microporosity of the adsorbent are indications of the total volume available for adsorption and can be directly related to the overall performance of the adsorbent (Lillo-Ródenas, Cazorla-Amorós, and Linares-Solano Citation2005). Conventional organic vapor respirators that rely on GAC adsorbents are effective, but may pose drawbacks in the form of weight and bulk of the assembly. These properties have an impact on the wearer’s perception of comfort; user comfort is strongly associated with consistent and proper respirator use (Gutierrez et al. Citation2014; Shaffer and Janssen Citation2015).
In the context of workplace safety, activated carbon in the fiber form (ACF) represents a potential alternative adsorbent for respiratory protection devices. ACFs are made from polymer fibers that have been carbonized at high temperatures and subsequently activated with carbon dioxide or steam (Lee et al. Citation2014). ACF is highly porous and tends to derive a greater proportion of its internal surface area from micropores than GAC. ACF microporosity is also concentrated at the fiber surface, shortening gas diffusion distances and promoting rapid adsorption (Webb Citation2006) This kinetic profile facilitates adsorption in scenarios where the residence time between an adsorbent and a challenge contaminant is short, as might occur during the passage of contaminated air through a thin facepiece or cartridge respirator (Rozzi, Snyder, and Novak Citation2012). ACF also tends to retain the physical form of the precursor fiber and unlike GAC, can be fabricated into self-supporting woven and non-woven forms. ACF in the non-woven form (i.e., felt) suggests the potential for a filtration medium that is capable of supporting both adsorption and particulate filtration applications (Giraudet and Le Cloirec Citation2016).
Several studies have investigated the use of ACF for indoor air quality applications related to both particulate filtration and adsorption (Kim, Yoon, and Kim Citation2016; Lorimier et al. Citation2008). Additionally, adsorption behavior for a wide variety of ACF-adsorbate systems have been modeled and described experimentally in the context of engineering, HVAC, and pollution prevention applications (Hayashi et al. Citation2000; Karanfil and Dastgheib Citation2004; Kim, Yoon, and Kim Citation2016). However, with specific reference to respiratory protection, far fewer studies exist. Hindmarsh et al. fabricated pitch-based non-woven ACF mats and tested their ability to adsorb a nonpolar VOC (4000 mg/m3 hexane) under both dry and humid conditions; however, certain elements of test conditions in this study (i.e., flow rate through the media) were not reflective of respirator use conditions (Hindmarsh and Phillips Citation2004). Balanay, Bartolucci, and Lungu (Citation2014) showed that an ACF with a specific surface area of 1500 m2/g exhibited greater adsorptive capacity (429 ± 0.01 mg/g) for toluene than a granular adsorbent with a higher specific surface area of 1800 m2/g (392 ± 0.02 mg/g) using a flow rate of 64 LPM (approximating the respiratory rate during moderate levels of exertion), thereby demonstrating the viability of this medium in respiratory protection applications. Pending further characterization and testing, specific ACF configurations could potentially be incorporated into N95-style respirators (i.e., filtering facepiece respirators, or FFRs) to be used in the event of accidental or intentional release of harmful gases and particulate matter in public spaces or public transportation. Thin ACF-based respirators that protect against both VOCs and particulate matter for short periods of time could be stored in public spaces and deployed in emergency situations. Additionally, the use of a thin, ACF-based adsorbent in an N95-style respirator could provide protection against low concentration VOC exposures (i.e., “nuisance odor” applications) in the workplace or home environment.
With both workplace and emergency use applications in mind, we determined the adsorption capacities of commercial ACFs for several representative organic vapors at occupationally relevant exposure concentrations. Adsorption capacity, defined as milligrams adsorbate per gram adsorbent, can be related to media breakthrough time through descriptive models, has implications for the estimation of respirator service life in future studies and applications (Wood Citation2000, Citation2017). Additionally, we performed laboratory characterization of ACF types in terms of surface area and micropore volume, with the aim of quantifying characteristics known to be significant to media capacity. Finally, this study identifies ACF depths that meet a specified performance criteria (i.e., adsorbent bed depth corresponding to maximum acceptable pressure drop, and breakthrough time in minutes at maximum acceptable pressure drop) when presented with use conditions similar to those of a typical facepiece respirator.
Methods
ACF selection
Three high surface area ACFs were assessed: two rayon-derived ACFs [ACFF 1800 and ACFF 2000; Bonding Chemical Co., Katy, TX.], and one polyacrylonitrile (PAN)-derived ACF [ACFF 1200, CeraMaterials, Dingmans Ferry, PA]. Properties of the ACF media are listed in . The numbers 1200, 1800, and 2000 refer to the manufacturer reported surface area of each material in m2/gram. Surface chemistry plays a role in the behavior of an ACF-adsorbate system, and adsorption can vary based on the precursor material and activation conditions (Lillo-Ródenas, Cazorla-Amorós, and Linares-Solano Citation2005). For example, PAN- derived ACFs, which have a relatively high concentration of nitrogen- and oxygen-containing surface groups, tend to show an enhanced adsorption of polar VOC species at low concentrations in comparison to other ACF types (Sullivan et al. Citation2012). The “off-the-shelf” ACFs selected for this study are intended to reflect a variety of precursor materials, surface areas and media bulk properties.
Table 1. ACF media characteristics
ACF characterization
To obtain surface area measurements and micropore characterization, ACF media underwent nitrogen adsorption at 77 K using a Micromeritics ASAP 2020 Physisorption Analyzer (Micromeritics Corp, Norcross, GA). Total specific surface area and average pore diameter of ACFs were determined by the Brunauer-Emmett-Teller (BET) method. BET theory describes the adsorption of gas particles onto a solid surface based on the assumption of multilayer adsorption. The BET method is often used by convention to estimate the surface area of microporous carbons (Webb and Orr Citation1997).
Challenge contaminants
Three organic vapors which could conceivably be encountered in the workplace or home environment were selected for use in this experiment. Toluene, hexane and methyl ethyl ketone (MEK) are representative aromatic, aliphatic and polar organic hydrocarbons, respectively. These challenge contaminants are commonly used in solvents, paints and coatings. Acute exposure to MEK (IARC Group 2B) is most commonly associated with irritation of the upper respiratory tract (National Library of Medicine Hazardous Substances Data Bank Citation2017a), while acute exposure to toluene (IARC Group 3) and hexane (not classified by IARC) may result in nervous system depression (National Library of Medicine Hazardous Substances Data Bank Citation2017b, Citation2017c). Relevant properties of the challenge contaminants are listed in . In each breakthrough study, a uniform challenge concentration of 200 ppm was used. This concentration was deemed occupationally-relevant, as it is equal to or less than the OSHA Permissible Exposure Limit (PEL) for each contaminant.
Table 2. Challenge contaminant properties
Experimental set-up
The schematic diagram of the test rig is shown in . The dynamic adsorption chamber is a two-piece stainless steel vessel that opens to allow placement of the test media within a 4-cm internal diameter filter holder. Sections of test media are backed with a layer of non-woven polypropylene and a stainless steel mesh to prevent potential shedding of the material. The test rig was maintained at a temperature of 25°C and RH of 30% by ambient air-conditioning system (Assay Technology, Livermore, CA), which provided clean conditioned air to the test rig at the desired flow rate. Flow rate was monitored in real-time with a downstream mass flow meter. A flow rate of 7.5 LPM was employed for all experiments; for the chamber dimensions, this flow rate corresponds to a face velocity of 10 cm/s at the test media surface. This face velocity was selected because it approximates the face velocity experienced by a filtering facepiece respirator (FFR) with an average surface area of 100 cm2 when subjected to moderate airflow (64 LPM) (Code of Federal Regulations, Title 42, Part 84 Citation2004). FFR surface area varies based on style (i.e., cup, duckbill, flat-fold) and respirator manufacturer. For simple cup-style respirators, areas as small as 59 cm2 and as large as 150 cm2 have been reported (D’souza et al.’s Citation2017; Niezgoda et al. Citation2013; Rengasamy et al. Citation2017). For the purposes of this experiment, an approximate surface area of 100 cm2 was selected based on these ranges. A flow rate of 64 LPM was selected because it is the flow rate used to certify the performance of organic vapor respirator cartridges per 42 CFR Part 84.207 (Code of Federal Regulations, Title 42, Part 84 Citation2004).
Figure 1. Simplified experimental set-up.
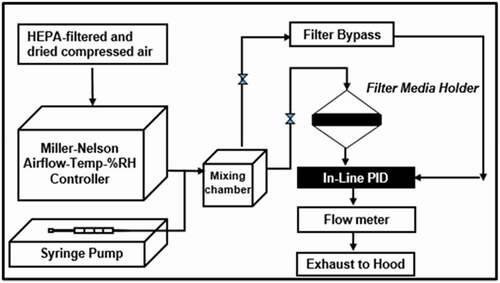
The VOC challenge was generated by evaporating liquid into the conditioned airstream via a motor-driven syringe pump (Chemyx, Inc, Stafford, TX) and an injection port. The vaporized liquid was mixed thoroughly with clean air within the test rig to generate the desired concentration. The challenge VOC concentrations were measured in real-time by a photoionization detector (PID) (Baseline MOCON, Lyons, CO), and were fixed at 200 ± 5 ppm.
Breakthrough experiments
ACF samples were emplaced in the test chamber and challenged with a VOC-containing airstream, as described above. Downstream challenge concentrations were monitored with a PID and the time at () = 0.10 (breakthrough concentration of 10%) was recorded. For each ACF-adsorbate pair (3 ACF types x 3 adsorbates), the 10% breakthrough was assessed for at least three different bed depths, each corresponding to consecutive single layers of filter media. A single trial was performed for each bed depth.
Data analysis
The Wheeler-Jonas (WJ) equation, a semi-empirical model of breakthrough time, was used to describe the performance of ACFs under dynamic use conditions. The WJ equation, which has been successfully applied to the adsorption behavior of GAC and activated carbon fiber (ACF) packed beds (Lodewyckx, Wood, and Ryu Citation2004), has the following form when expressed in terms of breakthrough time:
Wheretb = breakthrough time (min), We = kinetic adsorption capacity (g/g), W = weight of adsorbent (g), C0 = inlet concentration (g/cm3), Cx = outlet concentration (g/cm3), Q = volumetric flow rate (cm3/min), kv = rate constant of adsorption (min −1), ρb = density of the packed bed (g/cm3)
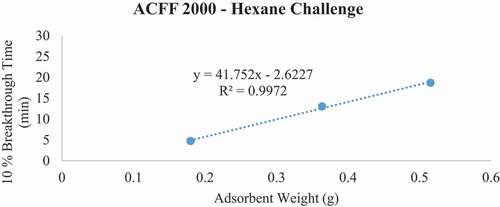
For each ACF-adsorbate pair, 10% breakthrough time (tb) versus bed weight (W, a function of bed depth) was plotted (). From the plot, the adsorption capacity (We) of the material was determined using the WJ equation, as follows:
Figure 2. Plots of 10% toluene breakthrough time in minutes for each ACF media type at successive bed depths. The challenge contaminant was 200 ppm toluene.
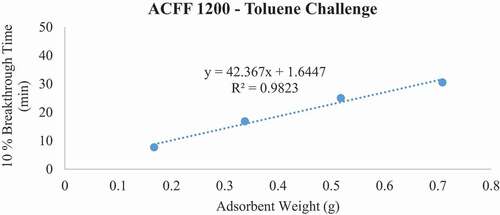
Figure 3. Plots of 10% toluene breakthrough time in minutes for each ACF media type at successive bed depths. The challenge contaminant was 200 ppm toluene.
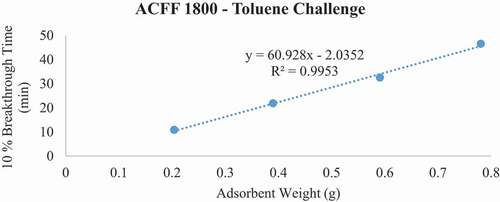
Figure 4. Plots of 10% toluene breakthrough time in minutes for each ACF media type at successive bed depths. The challenge contaminant was 200 ppm toluene.
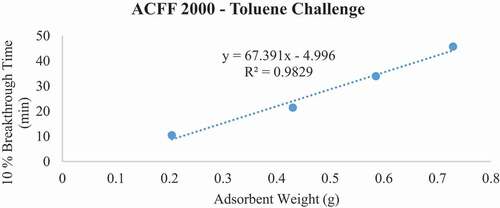
Figure 5. Plots of 10% MEK breakthrough time in minutes for each ACF media type at successive bed depths. The challenge contaminant was 200 ppm methyl ethyl ketone (MEK).
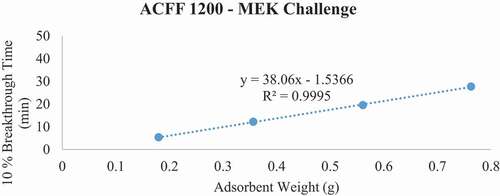
Figure 6. Plots of 10% MEK breakthrough time in minutes for each ACF media type at successive bed depths. The challenge contaminant was 200 ppm methyl ethyl ketone (MEK).
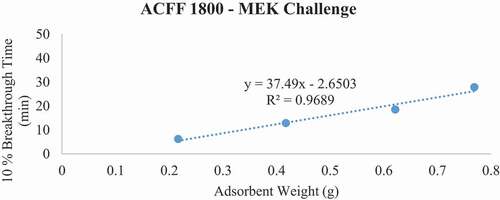
Figure 7. Plots of 10% MEK breakthrough time in minutes for each ACF media type at successive bed depths. The challenge contaminant was 200 ppm methyl ethyl ketone (MEK).
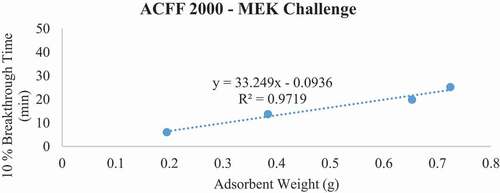
Figure 8. Plots of 10% hexane breakthrough time in minutes for each ACF media type at successive bed depths. The challenge contaminant was 200 ppm hexane.
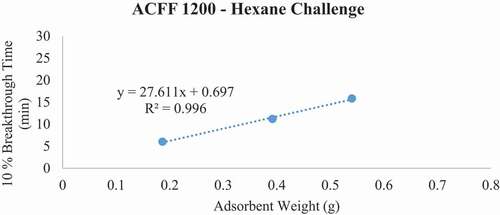
Figure 9. Plots of 10% hexane breakthrough time in minutes for each ACF media type at successive bed depths. The challenge contaminant was 200 ppm hexane.
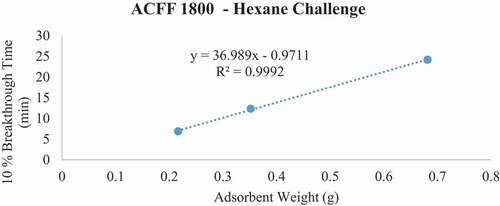
Figure 10. Plots of 10% hexane breakthrough time in minutes for each ACF media type at successive bed depths. The challenge contaminant was 200 ppm hexane.
We = slope · C0 ·Q
Where We = kinetic adsorption capacity, C0 = inlet concentration, ρb = packed bed density, W = ACF weight,
and Q = volumetric flow rate.
Pressure drop measurement
Pressure drop refers to the resistance across a filtration media in mm H2O during inhalation or exhalation. Constraints associated with pressure drop are a limiting factor on ACF bed depth, and by extension, the total mass of carbon that can be incorporated into any ACF-containing respirator. Per 42 CFR Part 84.203, pressure drop for organic vapor respirators is not to exceed 40 mm H20 when measured at a flow rate of 85 LPM (Code of Federal Regulations, Title 42, Part 84 Citation2004). A TSI VelociCalc (Shoreview, MN) with differential pressure probes was used to measure pressure drop across each ACF configuration, so that the maximum permissible bed depth within the allowable range of pressure drop could be identified. Based on the density of each ACF material, maximum bed depths were expressed in terms of total carbon weight (W). This relationship allowed estimation of 10% breakthrough times for each maximum permissible bed depth using the tb vs W plots described above ().
Performance criteria
Per 42 CFR Part 84.207, organic vapor chemical cartridges are typically tested with a 1000 ppm CCl4 (carbon tetrachloride) challenge at a flow rate of 64 LPM or 32 LPM, depending on whether the cartridge is used singly or in pairs. The maximum allowable breakthrough is 5 ppm, and the minimum time to reach 5 ppm breakthrough is 50 minutes (Code of Federal Regulations, Title 42, Part 84 Citation2004). For the purposes of this study (which uses 200 ppm rather than 1000 ppm, and the challenge contaminants toluene, hexane, and MEK rather than CCl4), a “successful” adsorption trial has been defined as any ACF depth that does not demonstrate immediate breakthrough and that is sufficient to prevent 5 ppm breakthrough for at least 150 minutes under the experimental conditions. This modified performance criterion is based on a rule-of-thumb that states if a challenge concentration is reduced by a factor of 10, the service life of a chemical cartridge should increase by a factor of 5 (Wood Citation2015). Applying this relationship to a 200 ppm contaminant challenge yields a service life of 150 minutes. This performance criteria is intended to identify ACF configurations that could potentially be considered for full-shift use scenarios against PEL-level contaminants.
Results
Surface area analysis confirms that each of the tested ACFs have exceptionally high specific surface areas when measured by the BET method (). Both ACFF 1800 and ACFF 2000 have measured surface areas below the reported nominal surface areas (1541 m2/g vs. 1800 m2/g and 1903 m2/g vs 2000 m2/g, respectively), possibly reflecting quality control issues with these particular “off-the-shelf” products. Results of surface area analysis reveal that each ACF type is highly microporous; however, the lowest surface area ACF presents the highest degree of microporosity by volume (ACFF 1200, 72.96% microporosity by volume). The ACF with the highest measured surface area has the lowest percentage of micropores by volume (ACFF 2000, 35.71%). This suggests that for ACF adsorbents, there may be a point of diminishing return related to increases in surface area. For example, the literature suggests that with increasing degrees of activation (corresponding to higher surface areas), there can be etching and widening of the adsorbent’s pore structure at the expense of microporosity (Carratalá-Abril et al. Citation2009; Lillo-Ródenas, Cazorla-Amorós, and Linares-Solano Citation2005).
Table 3. Results of ACF surface area analysis
Breakthrough time experiments indicate that ACFF 2000 has the highest adsorption capacity for toluene (381 mg/g), followed by ACFF 1800 and ACFF 1200 (344 mg/g and 239 mg/g, respectively). A similar trend was observed for hexane: adsorption capacity varied directly with media surface area (221 mg/g; 196 mg/g; and 146 mg/g for ACFF 2000, ACFF 1800, and ACFF 1200, respectively). ACFF 1200 showed the highest adsorption capacity for the polar adsorbate MEK (168 mg/g), followed by ACFF 1800 and ACFF 2000 (166 mg/g and 147 mg/g, respectively) ().
Table 4. Breakthrough experiments with 200 ppm Toluene as challenge contaminant
Table 5. Breakthrough experiments with 200 ppm MEK as challenge contaminant
Table 6. Breakthrough experiments with 200 ppm Hexane as challenge contaminant
For pressure drop measurements, ACFF 1200 had a maximum bed weight of 2.119 grams (i.e., maximum bed weight within the stated pressure drop requirement of 40 mm H20); this corresponds to a maximum bed depth of 8 layers (2.140 cm). ACFF 1800 and 2000 had maximum bed weights of 1.399 and 1.312 grams, respectively. (). These correspond to maximum bed depths of 4 layers (1.553 cm and 1.550 cm, respectively). The weight of each maximum bed depth was used to extrapolate maximum possible 10% breakthrough times for the three analytes using the tb vs. W plots described above (). For ACFF 1200, maximum predicted 10% breakthrough times are 85.12 minutes, 79.58 minutes, and 56.97 minutes for toluene, MEK, and hexane, respectively. For ACFF 1800, maximum predicted 10% breakthrough times are 71.52 minutes, 42.44 minutes, and 49.79 minutes for toluene, MEK, and hexane, respectively. For ACFF 2000, maximum predicted 10% breakthrough times are 71.61 minutes, 39.56 minutes, and 43.22 minutes for toluene, MEK, and hexane, respectively. These figures highlight the importance of media bulk properties (in this case, density and permeability to airflow) in maximum predicted 10% breakthrough times. In general, ACFF 1200 has a lighter, more spongy structure than ACFF 1800 and ACFF 2000 and could therefore accommodate more layers (i.e., more adsorbent mass) before the 40 mm H20 pressure drop requirement was exceeded.
Table 7. Maximum ACF bed depths and associated bed weights not in exceedance of 40 mm H20 when tested at a 10 cm/s velocity airflow. Also included are extrapolated 10% breakthrough times (Tb 10%) for each maximum bed weight
Discussion
Adsorption capacity is useful in ranking the amount of sorbate that can potentially be removed from a contaminated airstream. Although GAC is the sorbent traditionally used in organic vapor respirators, the adsorption capacity of ACFs for toluene have compared favorably to the adsorption capacity of GAC for toluene in previous studies (Balanay Citation2011; Balanay, Floyd, and Lungu Citation2015). The observed differences in adsorption capacity between ACF types noted above may be related to both precursor material and surface area characteristics. For example, the ACF with the highest surface area (ACFF 2000) showed the highest adsorption capacity for aromatic and aliphatic VOC representatives used in this study (toluene and hexane, respectively). Additionally, ACFF 1800 had higher adsorption capacities for toluene and hexane than ACFF 1200, the lowest surface area material used. However, ACFF 1200 had a much higher capacity for the polar organic VOC (MEK) than did ACFF 2000 (168 mg/g vs. 147 mg/g). As described previously, PAN-derived ACFs tend to have a higher concentration of nitrogen- and oxygen-containing species than other conventional ACFs. Because adsorption is a surface phenomenon, differences in polarity may explain why the ACFF 1200 shows greater capacity for the polar VOC MEK than rayon-based ACFs with greater surface areas. This suggests that some combination of surface chemistry and/or microporosity may be equally as significant as surface area in the adsorption of polar organic molecules onto activated carbon. Unfortunately, this study is limited in that the PAN-based ACF (ACFF 1200) and rayon-based ACFs (ACFF 1800 and ACFF 2000) were not tested at equivalent specific surface areas.
We previously defined a successful adsorption trial as an ACF depth that does not demonstrate immediate breakthrough and that is sufficient to prevent 5 ppm breakthrough for at least 150 minutes under our experimental conditions. ACF configurations that meet this criteria could potentially be considered for full-shift use scenarios against PEL-level contaminants. However, none of the maximum predicted 10% breakthrough times () met the stated performance criteria, and 10% breakthrough times at maximum permissible bed depths did not approach full-shift durations: the best case scenarios were 85 minutes (ACFF 1200) for toluene, 79 minutes (ACFF 1200) for MEK, and 57 minutes (ACFF 1200) for hexane.
Based on these results, it is questionable whether an organic vapor FFR could accommodate enough ACF for shift-length protection without excessive breathing resistance; however, there is ample opportunity for further research. For example, the “off-the-shelf” ACFs used in this study were not specifically designed for use in respiratory protection devices. Optimizing media bulk properties (such as fiber diameter and fiber packing density) or possibly blending the ACF with other filtration media to reduce pressure drop may be necessary to fully develop the concept of an organic vapor FFR. It would also be interesting to investigate design techniques like respirator pleating to maximize carbon mass within stated pressure drop constraints. Additionally, we believe it will be necessary to test any such media under the more stringent flow conditions for particulate respirators as described in 42 CFR Part 84.181, in addition to the equivalent flow conditions for organic vapor respirators as used in this study.
A more immediate application for ACF would be its potential use in short-term “emergency use” N95 style respirators, or as the adsorbent component of “nuisance odor” N95-style respirators. For example, employees with chemical sensitivity or asthma may desire voluntary use of a lightweight respirator for chemical odors or chemical exposures below OSHA PELs. The incorporation of ACF into a FFR may be promising for the further reduction of organic vapor concentrations when workplace exposures are already below the permissible exposure limit, and NIOSH currently supports OSHA’s voluntary use provision of respirators for this purpose.
Disclosure statement
No potential conflict of interest was reported by the author(s).
Additional information
Funding
Notes on contributors
Margaret Summers
Margaret Summers is a Certified Physician Assistant with a background in outpatient pediatric care. In 2016, Margaret was granted a PhD traineeship in Industrial Hygiene through the Deep South Center for Occupational Safety and Health at the University of Alabama at Birmingham. Her research interests include the prevention of heat-related illness in the occupational setting and the evaluation of worker respiratory protection devices.
Jonghwa Oh
Dr. Jonghwa Oh is an assistant professor in the Department of Environmental Health Sciences at the University of Alabama at Birmingham (UAB). She earned a PhD degree in Environmental Health Sciences (Industrial Hygiene track) from UAB. Her main research area is on improving the current occupational exposure assessment and control methods, including VOC sampling/analytical method development, personal protective equipment (PPE) improvement, and hand-arm vibration (HAV) assessment.
Claudiu T. Lungu
Claudiu T. Lungu, PhD is a professor of Environmental Health Sciences at UAB and director of the NIOSH funded Deep South Center for Occupational Health and Safety. He conducts research in occupational exposure assessment and control of exposure in particular respiratory protection.
References
- Balanay, J. A. G., A. A. Bartolucci, and C. T. Lungu. 2014. Adsorption characteristics of activated carbon fibers (ACFs) for toluene: Application in respiratory protection. J. Occup. Environ. Hyg. 11 (3):133–43. doi:https://doi.org/10.1080/15459624.2013.816433.
- Balanay, J. A. G., E. L. Floyd, and C. T. Lungu. 2015. Breakthrough curves for toluene adsorption on different types of activated carbon fibers: Application in respiratory protection. Ann. Occup. Hyg. doi:https://doi.org/10.1093/annhyg/meu105.
- Balanay, J., 2011. Adsorption characteristics of Activated Carbon Fibers (ACF) for toluene. [Doctoral Dissertation, University of Alabama at Birmingham].
- Carratalá-Abril, J., M. A. Lillo-Ródenas, A. Linares-Solano, and D. Cazorla-Amorós. 2009. Activated carbons for the removal of low-concentration gaseous toluene at the semipilot scale. Ind. Eng. Chem. Res. 48 (4):2066–75. doi:https://doi.org/10.1021/ie800521s.
- Cartier, A., and D. Bernstein. 2018. Occupational asthma: Definitions, epidemiology, causes and risk factors. Waltham, MA: Wolters Klower.
- Choi, S. H., D. H. Choi, D. H. Kang, Y.-S. Ha, J. N. Lee, B. S. Kim, H. T. Kim, E. S. Yoo, T. G. Kwon, S. K. Chung, et al. 2018. Activated carbon fiber filters could reduce the risk of surgical smoke exposure during laparoscopic surgery: Application of volatile organic compounds. Surg. Endoscopy Other Interventional Tech. 32 (10):4290–98. doi:https://doi.org/10.1007/s00464-018-6222-0.
- Code of Federal Regulations, Title 42, Part 84. 2004. Approval of Respiratory Protection Devices. https://www.govinfo.gov/content/pkg/CFR-2004-title42-vol1/xml/CFR-2004-title42-vol1-part84.xml .
- D’souza, G. A., S. Guha, M. R. Myers, and P. Hariharan. 2017. Evaluation of aerosol leakage sites through respirators using image-based modeling. http://asmedigitalcollection.asme.org/BIOMED/proceedings-pdf/DMD2017/40672/V001T09A007/4449661/v001t09a007-dmd2017-3446.pdf.
- Giraudet, S., and P. Le Cloirec. 2016. Activated carbon filters for filtration-adsorption. In Activated carbon fiber and textiles, ed. J. Y. Chen, 211–43, Cambridge, UK: Woodhead Publishing.
- Gutierrez, A., M. Galang, R. Seva, M. Lu, and D. Ty. 2014. Designing an improved respirator for automotive painters. Int. J. Ind. Ergon. 44 (1):131–39. doi:https://doi.org/10.1016/j.ergon.2013.11.004.
- Hayashi, T., T. G. Lee, M. Hazelwood, E. Hedrick, and P. Biswas. 2000. Characterization of activated carbon fiber filters for pressure drop, submicrometer particulate collection, and mercury capture. J. Air Waste Manage. Assoc. 50 (6):922–29. doi:https://doi.org/10.1080/10473289.2000.10464136.
- Hayes, J. 1994. Activated carbon fibers and textiles: Properties and applications. Pleasantville, NY: American Kynol, Inc.
- Hindmarsh, C. J., and P. L. Phillips. 2004. Development of activated carbon fibre mats for combined particulate and vapor filtration.
- Karanfil, T., and S. A. Dastgheib. 2004. Trichloroethylene adsorption by fibrous and granular activated carbons: Aqueous phase, gas phase, and water vapor adsorption studies. Environ. Sci. Technol. 38 (22):5834–41. doi:https://doi.org/10.1021/es0497936.
- Kim, S. Y., Y. H. Yoon, and K. S. Kim. 2016. Performance of activated carbon-impregnated cellulose filters for indoor VOCs and dust control. Int. J. Environ. Sci. Technol. 13 (9):2189–98. doi:https://doi.org/10.1007/s13762-016-1046-8.
- Lee, T., C. Ooi, R. Othman, and F. Yeoh. 2014. Activated carbon fiber - the hybrid of carbon fiber and activated carbon. Rev. Adv. Mater. Sci. 36:118–36.
- Lillo-Ródenas, M. A., D. Cazorla-Amorós, and A. Linares-Solano. 2005. Behaviour of activated carbons with different pore size distributions and surface oxygen groups for benzene and toluene adsorption at low concentrations. Carbon 43 (8):1758–67. doi:https://doi.org/10.1016/j.carbon.2005.02.023.
- Lodewyckx, P., G. O. Wood, and S. K. Ryu. 2004. The Wheeler-Jonas equation a versatile tool for the prediction of carbon bed breakthrough times.pdf. Carbon 42 (7):1351–55. doi:https://doi.org/10.1016/j.carbon.2004.01.016.
- Lorimier, C., L. Le Coq, S. Albert, and P. Le Cloirec. 2008. Indoor air particulate filtration onto activated carbon fiber media. J. Environ. Eng. 134 (2):126–32. doi:https://doi.org/10.1061/(ASCE)0733-9372(2008)134:2(126).
- National Library of Medicine Hazardous Substances Data Bank. 2017a. Methyl ethyl ketone.
- National Library of Medicine Hazardous Substances Data Bank. 2017b. Toluene.
- National Library of Medicine Hazardous Substances Data Bank. 2017c. n-Hexane.
- Niezgoda, G., J. H. Kim, R. J. Roberge, and S. M. Benson. 2013. Flat fold and cup-shaped N95 filtering facepiece respirator face seal area and pressure determinations: A stereophotogrammetry study. J. Occup. Environ. Hyg. 10 (8):419–24. doi:https://doi.org/10.1080/15459624.2013.801246.
- Occupational Safety and Health Administration. n.d. Respiratory protection overview. https://www.osha.gov/SLTC/respiratoryprotection/.
- Plog, B., J. Niland, and P. Quinlan. 1996. Fundamentals of Industrial Hygiene, 4th Edition. Itasca, IL: National Safety Council.
- Reinhardt, T., and G. Broyles. 2018. Background and overview of wildland fires and exposures and health effects. in International Society for Respiratory Protection Conference Proceedings, Denver, CO.
- Rengasamy, S., R. Shaffer, B. Williams, and S. Smit. 2017. A comparison of facemask and respirator filtration test methods. J. Occup. Environ. Hyg. 14 (2):92–103. doi:https://doi.org/10.1080/15459624.2016.1225157.
- Rozzi, T., J. Snyder, and D. Novak. 2012. Pilot study of aromatic hydrocarbon adsorption characteristics of disposable filtering facepiece respirators that contain activated carbon. J. Occup. Environ. Hyg. 9 (11):624–29. doi:https://doi.org/10.1080/15459624.2012.718943.
- Shaffer, R. E., and L. Janssen. 2015. Selecting models for a respiratory protection program: What can we learn from the scientific literature? Am. J. Infect. Control 43 (2):127–32. doi:https://doi.org/10.1016/j.ajic.2014.10.021.
- Sullivan, P., J. Moate, B. Stone, J. D. Atkinson, Z. Hashisho, and M. J. Rood. 2012. Physical and chemical properties of PAN-derived electrospun activated carbon nanofibers and their potential for use as an adsorbent for toxic industrial chemicals. Adsorption 18 (3–4):265–74. doi:https://doi.org/10.1007/s10450-012-9399-x.
- Webb, P., and C. Orr. 1997. Analytical methods in fine particle technology. Norcross, Georgia: Micromeritics Instrument Corporation.
- Webb, S. W. 2006. Gas transport mechanisms. In Gas transport in porous media. Theory and applications of transport in porous media, ed. C. K. Ho and S. W. Webb, vol. 20, Dordrecht: Springer.
- Wood, G. O. 2000. Reviews of models for adsorption of single vapors, mixtures of vapors, and vapors at high humidities on activated carbon for applications including predicting service life of organic vapor respirator cartridges. 1–162.
- Wood, G. O. 2017. Testing air-purifying chemical respirator cartridges: A review of options. JISRP 34: 26–39.
- Wood, G. 2015. Correlating and extrapolating air purifying respirator cartridge breakthrough times: A review. JISRP 32: 23–26.