
 ?Mathematical formulae have been encoded as MathML and are displayed in this HTML version using MathJax in order to improve their display. Uncheck the box to turn MathJax off. This feature requires Javascript. Click on a formula to zoom.
ABSTRACT
Concentrations of per- and poly-fluoroalkyl substances (PFAS) present in wastewater treatment biosolids are a growing concern. Pyrolysis is a thermal treatment technology for biosolids that can produce a useful biochar product with reduced levels of PFAS and other contaminants. In August 2020, a limited-scope study investigated target PFAS removal of a commercial pyrolysis system processing biosolid with the analysis of 41 target PFAS compounds in biosolids and biochar performed by two independent laboratories. The concentrations of 21 detected target compounds in the input biosolids ranged between approximately 2 µg/kg and 85 µg/kg. No PFAS compounds were detected in the biochar. The PFAS concentrations in the biochar were assumed to equal the compounds’ minimum detection limits (MDLs). The pyrolysis system’s target PFAS removal efficiencies (REs) were estimated to range between >81.3% and >99.9% (mean >97.4%) with the lowest REs being associated with the lowest detected PFAS concentrations and the highest MDLs. No information on non-target PFAS compounds in influent or effluent media or products of incomplete combustion was considered. Selected gaseous emissions were measured by Fourier transform infrared spectroscopy and gas chromatography time-of-flight mass spectrometry to provide additional information on air emissions after process controls. This limited-scope study indicated that additional research to further understand this process is warranted.Implications: Development of alternative approaches to manage PFAS-impacted biosolids is of emerging international importance. A commercially operating biosolid pyrolysis process was shown to lower target PFAS levels in produced biochar. Additional research is warranted to understand all potential PFAS transformation emission routes and optimal air pollution emissions control strategies for this technology class.
Introduction
Per- and poly-fluoroalkyl substances (PFAS) are synthetic-fluorinated chemicals employed for decades in industrial, consumer products, and firefighting applications (Buck et al. Citation2011; Herzke, Olsson, and Posner Citation2012; Houtz et al. Citation2013; Kotthoff et al. Citation2015; Lindstrom, Strynar, and Libelo Citation2011; Schaider et al. Citation2017). The environmental fate and potential health impacts of legacy and emerging PFAS are the subject of ongoing research, but the need to reduce exposure risk for certain PFAS compounds is acknowledged (Sunderland et al. Citation2019). The wide use of PFAS, coupled with the chemical persistence of the carbon-fluorine bond, has inevitably led to their discovery in landfill leachate (Huset et al. Citation2011; Knutsen et al. Citation2019; Lang et al. Citation2017) and wastewater treatment plant (WWTP) effluent (Loganathan et al. Citation2007; Schultz et al. Citation2006; Sinclair and Kannan Citation2006), with the potential for cyclic exchange between environmental systems noted (Hamid and Li, Citation2016; Masoner et al. Citation2020; Stoiber, Evans, and Naidenko Citation2020). The concentrations of individual PFAS, including perfluorooctanoic acid (PFOA) and perfluorooctane sulfonic acid (PFOS), in WWTP influent, effluent, and biosolid residuals are variable and influenced by point source contributions (Houtz et al. Citation2016; MIEGLE Citation2020; Oliaei et al. Citation2013; Xiao et al. Citation2012). For a subset of WWTPs, identification and elimination of PFAS point sources is critical to management of heavily impacted process streams. Due to the ubiquitous nature of PFAS, many WWTPs are now considering the consequences of lower level PFAS concentrations in produced biosolids and effluent, as science and regulatory framework advance.
In the US, ~51% of the >2 million dry metric tons (t) of stabilized WWTP biosolids are land-applied for beneficial use providing soil nutrient and conditioning benefit (Mills Citation2020; USEPA Citation1999a). With uncertainties in fate and transport, elevated levels of PFAS and other contaminants in biosolids are increasing concerns over land application (Kinney et al. Citation2006; Maine Citation2020; MIEGLE Citation2020; Sepulvado et al. Citation2011; USEPA Citation2018). Alternate biosolids disposal routes in the US currently include landfilling (~16%) and sewage sludge incineration (SSI, ~22%) (Mills, Citation2020). Significantly expanded use of these options may increase PFAS cyclic exchange and air emissions from additional use of SSI and biosolid transportation (Miller-Robbie et al. Citation2015; USEPA Citation2020). Development of new cost-effective biosolid treatment approaches that can reduce the environmental impact of PFAS and other pollutants while maintaining beneficial use are of growing interest.
One biosolids treatment technology is pyrolysis, a non-incineration thermal process that decomposes materials in an oxygen-free environment at elevated temperatures (typically 500°C to 800°C). Compared to SSI, pyrolysis features lower production of oxides of carbon, nitrogen, and sulfur and reduced release of metals, however the potential for PFAS air emissions for both processes are uncertain (Kundu et al. Citation2020; Winchell et al. Citation2021). Pyrolysis units are smaller in size and capacity than SSI with partial mass vaporization resulting in comparatively low air flows, which reduces the size and capital expense of air pollution control equipment. In comparison to strict air pollution emission regulations (USEPA Citation2020) for SSI, the regulatory structure for processes, such as pyrolysis and gasification, is less defined. Pyrolysis produces a hydrogen-rich synthesis gas (syngas) stream that can be combusted, with heat energy recovered. Whereas SSI produces ash, pyrolysis of biosolid yields biochar, a carbon-rich material with beneficial use potential ranging from soil enhancement, remediation, and carbon sequestration, to activated sorbents and specialty catalysts. (Patel et al. Citation2020; Paz-Ferreiro et al. Citation2018; Singh et al. Citation2020) Compared to stabilized biosolids, biochar is pathogen-free with lower organic contaminates and metal-leaching potential but with lower total nitrogen content for land application (Hwang, Ouchi, and Matsuto Citation2007; Regkouzas and Diamadopoulos Citation2019).
There is a dearth of knowledge regarding PFAS mobilization and transformation during thermal biosolid treatment, including elevated temperature drying processes. As process temperatures increase, volatile PFAS enter the gas phase, becoming part of the syngas stream in the case of pyrolysis. Residual or transformed PFAS remaining in the solids, gas-phase emissions, and control efficacy (C-F bond destruction), products of incomplete combustion (PICs) and liquid-phase partitioning (via emission control scrubber water) are wholly unknown at present. For pyrolysis-based treatment, the air and water emission profiles and the physiochemical properties (and resulting uses) of sewage sludge-derived biochar depend on the properties of the feed stock and pyrolysis process and control system design. Research is now beginning to consider these factors in the thermal treatment of biosolids (Kim et al. Citation2015; Kundu et al. Citation2020; Winchell et al. Citation2021), contaminated soils Sörengård et al. (Citation2020), and spent media (Xiao et al., Citation2020).
This technical note contributes to this topic through description of a limited-scope study of a working biosolid pyrolysis unit. We measured concentrations of target PFAS compounds (SI Table 1) in dried biosolid input to a pyrolysis process, produced biochar, and emission control scrubber water at the Silicon Valley Clean Water (SVCW) WWTP in Redwood City, California, over a two-day period in August 2020. Since 2017, BioForceTech Corporation (BFT, South San Francisco, California) (CitationBFT Bioforcetech Corporation Website) deployed and operated the system that processes approximately 30% of the biosolids produced at SVCW. In addition to solid and liquid sampling, limited measurements of light volatile PFAS and other compounds in gaseous samples at various parts of the pyrolysis process by extractive Fourier transform infrared spectroscopy (FTIR) and evacuated canister grab sampling will be discussed.
Treatment process
BioDryer, pyrolysis process, and emissions control
The system consisted of three BFT BioDryers followed by a P-FIVE sludge pyrolysis system (PYREG GmbH, Dörth, Germany) fitted with a FLOX® flameless thermal oxidizer (WS Wärmeprozesstechnik GmbH, Renningen, Germany). The BioDrying and Pyrolysis system at SVCW processes approximately 3,500 t of dewatered sludge to 400 t of biochar annually using approximately 55 kWh/t of biosolids (wet basis) of added energy. Traditional biosolid drying processes employ thermal energy (e.g., belt, paddle, and drum drying) or solar drying over time. The novel BFT BioDryer approach controls oxygen (air), heat, and bacteria in a three-phase process to take biosolids from 20% dry content to 75%–90% dry content in 48 h, while utilizing ~40% of the thermal energy and electricity of belt and drum drying. At SVCW, the automated process generates ~2 tons of Class A biosolids from 8 tons of Class B biosolids (USEPA Citation1999a) per each batch using three BioDryer units. For this study, the BioDryers operated at 60°C to promote thermophilic bacterial activity and required 35 kWh of electricity per wet ton and 350 kWh (1.2 MMBTU) of thermal energy per wet ton to take the dewatered Class B biosolids to <20% moisture Class A biosolids. The exhaust gas from the BioDryers could be fed to a wet scrubber () and/or bio-filter. Only a bio-filter used for this test.
Figure 1. Schematic of pyrolysis unit with air emission and solids/liquids sampling locations: (LA) air sampling at stack, (LB) air sampling after clean water (W) heat exchanger, (LC) air and scrubber water sampling, (LD) input biosolids sampling, and (LE) output biochar sampling.
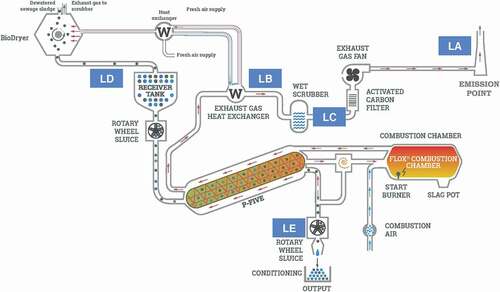
The dried biosolids were fed into a pyrolysis reactor at location D [(LD), ] at an average rate of 63.6 kg/h (±1.4 kg/h standard deviation), producing 28.8 kg/h (± 0.6 kg/h) of biochar exiting at LE. The biosolids residence time in the reactor was 19.1 min (± 0.3 min) and temperatures measured on the inner walls of the reactor at the front and end of the system were 649°C (±6°C) and 586°C (±32°C), respectively. The pyrolysis of the biosolids produced syngas containing mainly hydrogen, methane, carbon monoxide, and carbon dioxide. No biooil was produced by the pyrolysis process. Exiting the reactor, the syngas passed through a dust separation cyclone operating 496°C (±5°C) then was immediately combusted in the FLOX® burner operating at 1020°C (±5°C). The hot exhaust gases from the combustion of the syngas were routed through the annulus of the reactor to drive the pyrolysis and then entered a sealed two-stage (fixed tube to fin tube) heat exchanger (LB) where they were cooled to 60°C. The energy recovered in the heat exchanger was conveyed to the BioDryer in the form of hot water to support biosolid drying. After heat exchange, the exhaust gases passed through a packed-bed caustic wet scrubber (LC) operating at a pH of 7.4 (±0.2) and then through an activated carbon filter operating at 43.4°C (±3.2°C), exiting via an 8-in. diameter stack at 248 dry scfm (±10 dry scfm). The vacuum level of the system was −50.4 Pa (±6.4 Pa). The biochar exiting the system at LE is typically quenched with tap water prior to agricultural application, but quenching was not performed in this project to avoid contaminating the biochar with PFAS.
Methods
Solids/Liquids sampling and analysis
Samples of Class A dried biosolids (after the BioDryer), pyrolysis-produced biochar, emission control scrubber water, and tap water were analyzed to target PFAS by two independent laboratories: Eurofins TestAmerica (TA, Sacramento, CA), and Vista Analytical (VA, Sacramento CA). Clean high-density polyethylene (HDPE) 177 mL jars and 125 mL bottles were obtained from the two laboratories and were used to collect solid and liquid samples from the process, respectively. Additional samples were simultaneously collected and archived for potential follow-on analysis. Two separate sample batches (B1 and B2) were acquired on August 26, 2020, at 6:30 AM and 1:00 PM, respectively. The solid samples were collected directly into the containers using clean stainless-steel spoons (no homogenization) at LD or LE, and the liquid samples were direct grabs into the containers at location LC or from the tap water input supply to the wet scrubber in one case. There were 24 primary samples generated (12 from B1 and 12 from B2). Each sample batch consisted of two biosolids, two biochar, and two liquid samples for analysis by each lab (e.g., six samples for TA and six for VA from sample batch B1). Protocols were followed to minimize for PFAS contamination during sampling, and the samples were immediately iced and transported to the TA and VA laboratories for processing/extraction and analysis using modified EPA Method 537 (EPA Citation2009) with isotope dilution, solid-phase extraction, and liquid chromatography/tandem mass spectrometry (LC-MS-MS) for target 36 and 41 target PFAS compounds by TA and VA, respectively (SI Table 1).
For comparison to other thermal treatment technologies, the dried biosolids to biochar target PFAS removal efficiency (RE) by the pyrolysis system were estimated using measured concentrations and the mass rates moving into and out of the unit (EquationEq. 1)(1)
(1) :
Where: RE = removal efficiency (percent);
Cbiochar = PFAS concentration in dry biochar;
Qbiochar = dry biochar mass production rate;
Cbiosolids = PFAS concentration in dry biosolids; and
Qbiosolids = dry biosolid mass feed rate.
If all measured Cbiochar were below laboratory reporting limits (RLs), the RE was calculated using the method detection limit (MDL) for the individual compound and expressed as “greater than” the stated value. Since comprehensive target and non-target PFAS air and media analysis were not attempted in this limited scope study, the full destruction, emission, and transformation fate of target PFAS removed from the biosolids is unknown.
FTIR and canister air sampling and analysis
Gaseous samples at various parts of the pyrolysis process were measured on-site using extractive FTIR spectroscopy at 0.5 cm−1 resolution. One 10-m (F10) and two 5-m (F5A and F5B) optical path length FTIRs (MultiGas™ Model 2030, MKS Instruments, Andover, MA) with liquid-nitrogen-cooled, mercury-cadmium-telluride detectors operating ASTM D6348-12 (ASTM Citation2012) were deployed at locations in and around the pyrolysis process producing six 1-h tests (T) with start times of 10:15 (T1), 13:10 (T2), and 14:40 (T3) on 8/26/20 and 9:25 (T4), 10:55 (T5), and 12:20 (T6) on 8/27/20. The units operated at time resolutions of 1 minute per data point, cell temperatures of 190°C and did not use water knock-out. Unit F10 produced data at LA for all test sets (). Unit F5A was collocated with F10 at LA for T1-T3 and was moved to LB for T4-T6. Unit F5B sampled directly after the wet scrubber at LC for T3 and T6 and looked-for gas emission leakage from the pyrolysis at the biochar outlet (LE) for T1, the biosolid inlet (LD) for T2, near the heat exchanger sampling port (LB) for T5, and sampled near the scrubbed FTIR exhaust for T4 (not shown). The minimum detectable concentration #2 (MDC2) for FTIR, dynamic spiking gases, and the original test design that called for the controlled injection of small quantities of carbon tetrafluoride (CF4) and hexafluoroethane (C2F4) indicator compounds to assist in understanding the C-F bond destruction are discussed in text associated with SI Table 3.
A total of nine ~30 second duration canisters grab samples from the process were collected in evacuated 1.4-liter, Silonite-coated Entech stainless steel canisters (Entech Instruments, Simi Valley, CA) for analysis of targeted volatile PFAS and volatile organic compounds (VOCs). Six canister samples were collected at LA and three samples were collected at LB. The canister samples were analyzed at EPA-RTP by gas chromatography-mass spectrometry on two analytical systems to quantify volatile PFAS and VOCs following US EPA Compendium Method TO-15. USEPA (Citation1999b) The volatile PFAS analysis was performed on the Markes analytical system (Markes International, Sacramento, CA) including a Markes CIA Advantage-xr Canister Autosampler, a Unity-xr Thermal Desorption (TD) unit, a Kori-xr Water Management module, an Agilent 7890B Gas Chromatograph (GC), and Markes BenchTOF Time-of-Flight Mass Spectrometer (ToF-MS). The targeted analysis of air toxic and ozone precursor VOCs was performed on the Entech analytical system that consists of an Entech 7650-M Canister Autosampler, Entech 7200 Preconcentrator, an Agilent 7890B GC with 5977 Mass Spectrometer (Agilent Technologies, Santa Clara, CA). The instrument response for the targeted PFAS and VOCs were calibrated using certified NIST-traceable gas standards when available. For several targeted PFAS compounds, calibration standard samples were generated from neat chemicals. To protect from acid gases that could damage analysis equipment, the canisters were acquired at the FTIR exhaust after an impinger containing 0.1 N NaOH. The degree to which the 0.1 N NaOH impinger could have affected canister results for other compounds was not assessed.
Results
PFAS in biosolids, biochar, and scrubber water
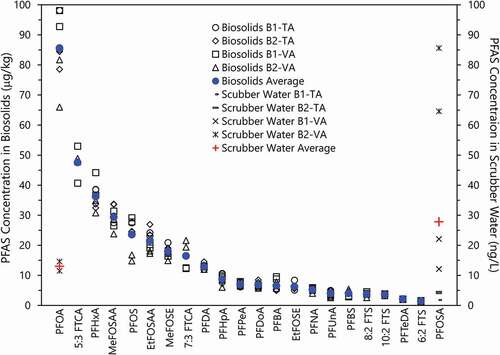
Concentrations of target PFAS compounds found in the dried biosolid input to the pyrolysis process, produced biochar, emission control scrubber water, and field blanks are summarized in and SI Table 1. Concentrations of target PFAS in biochar samples were uniformly below laboratory RLs for both TA and VA, except for single low-level occurrences of PFOS and perfluorobutanoic acid (PFBA), with the latter showing up in field blanks that included sampling spoon and bag wash. The average concentrations by laboratory for input biosolids were in generally good agreement (SI Table 2), with no significant difference between sampling batches B1 and B2 noted. The average concentrations of 21 detected PFAS compounds in the biosolids ranged from approximately 2 µg/kg to 85 µg/kg. The largest measured PFAS concentrations were for PFOA with a TA average of 86.7 µg/kg (± 8.2 µg/kg) and VA of 84.8 µg/kg (± 14.2 µg/kg). Average PFOS concentrations for TA and VA were 25.1 (± 1.8 µg/kg) and 22.3 µg/kg (± 7.4 µg/kg), respectively. The lowest PFAS concentration over RL was 6:2 fluorotelomer sulfonic acid (6:2 FTS) with TA’s value less than the MDL and VA’s average value at 1.5 µg/kg for two of the four samples. These 2020 biosolid results were also in generally good agreement with the 2019 single-sample analyses that were performed for BFT by VA in which the PFOA concentration was 89.1 µg/kg and the PFOS concentration was 26.3 µg/kg. (CitationBFT Bioforcetech Corporation Website)
Figure 2. Concentrations of target PFAS above RL in biosolids (in µg/kg) and scrubber water effluent (in ng/L) by sampling batch and analysis laboratory (4 samples each) with overall average by compound.
Because the produced biochar target PFAS concentrations were below RL, the levels were assumed to equal the compounds’ MDLs with the RE stated as “greater than” (SI Table 2). Combining all input biosolid data above RL, the pyrolysis system’s REs ranged from >81.3% to >99.9% (mean = >97.4%), with the lowest REs associated with the lowest detected PFAS concentrations and the highest MDLs. With 16 compounds above RL, the TA lab RE was >99% in all cases. The target PFAS removed from the biosolids could transform into non-target PFAS and remain in the biochar and/or move into the gas or liquid phases. The fate of target and non-target PFAS and PICs must be understood to determine the C-F bond destruction capability of any thermal treatment. Potential emissions and transformation effects of drying operations that may precede the treatment must also be considered.
Although this test provides only a partial picture, direct partitioning of thermally liberated target PFAS into the liquid phase via the emission control scrubber water was not readily observed with only two compounds [PFOA and perfluorooctane sulfonamide (PFOSA)] above the liquid analysis reporting limits (secondary ordinate, ng/L). PFOA was found in only two of the four scrubber water samples that were analyzed by VA with an average concentration of 13.2 ng/L and in none of the four samples that were analyzed by TA. Although PFOSA was not found in the biosolid samples, it was found in all seven scrubber water samples using this more sensitive test. The four samples that were analyzed by VA with an average concentration of 46.2 ng/L (± 34.8 ng/L) and the three analyzed by TA had an average concentration of 3.6 ng/L (± 1.5 ng/L). PFOSA was also found at a concentration of 3.4 ng/L in the single tap water sample that was analyzed by TA. The three compounds were observed at <1 ng/L in both scrubber water and field blanks (SI Table 1). No analyses of the Class B biosolid input to the BioDryer were performed. Additional research is required to understand the origin of the measured PFOSA in the scrubber water.
As points of comparison, the removal of PFASs from WWTP biosolids was studied in an Australian semi-pilot-scale pyrolysis reactor with analyses for 12 PFASs in biosolids, biochar, and scrubber water performed (Kundu et al. Citation2020). The pyrolysis tests were carried out between 500°C and 600°C and with a biochar yield of 36% to 45%. The input biosolid PFAS concentrations ranged between <0.5 µg/kg and 8.6 µg/kg. Biochar PFAS concentrations ranged between <0.2 µg/kg to <1.0 µg/kg. Scrubber water PFAS concentrations ranged between <10 ng/L to <100 ng/L. The authors concluded that >90% removal of PFOS and PFOA from biosolid-derived biochar could be achieved in the integrated low-temperature pyrolysis/combustion process. In contrast, a 2015 laboratory experiment on pyrolysis of WWTP solid in the 300°C to 600°C range showed no reduction PFAS in the produced biochar, (Kim et al. Citation2015) a finding at odds with the somewhat general consensus of at least partial thermal PFAS volatilization in this temperature regime (Winchell et al. Citation2021).
Gas-phase FTIR and canister measurements
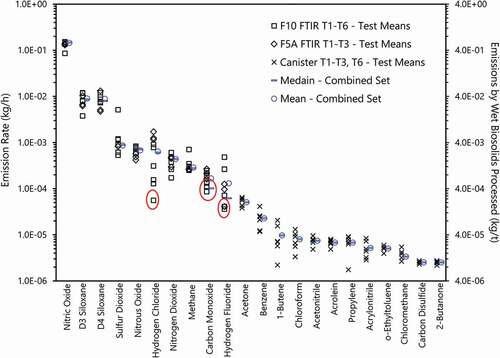
Even though method development experiments to assess C-F bond destruction efficiency using injected CF4 and C2F6 indicator gases were not performed, useful information on emissions was provided by FTIR sampling and collection of evacuated canister grab samples. Close-coupled FTIR sampling at the biosolids’ inlet to the pyrolysis process (, LD) and at the biochar exit (LE) found no significant gas leakage from the pyrolysis system. Feasibility was demonstrated for potential future use of FTIR for pyrolysis process diagnostics and indicator gas testing after the FLOX burner (LB) and wet scrubber (LC) emission controls, in high particulate and wet conditions, respectively. At LA, emission levels of selected gas-phase compounds were measured by collocated FTIRs F10 and F5A for the first three of the 6-h-long test periods (T1-T3), and by F10 alone for the remainder of tests (T4-T6). A total of five evacuated canisters were acquired at the exhaust of F10, one canister per test for T1-T4 and T6 with one canister acquired at F5A during T3.
summarizes the mean emission rates for T1-T6 by compound, in kg/h and kg/t of wet biosolid mass processed, derived from the time-resolved FTIR data and extrapolated canister grab samples. Arithmetic means and medians of the combined data sets are also displayed. The red ovals indicate FTIR results below the detection limit and utilize MDC2/2 for calculation with statistical details and description on uncertainties in specific compounds provided in SI Tables 3–5. The collocated FTIRs were generally in good agreement except for T1 for hydrogen fluoride (HF), where a combination of startup and line passivation differences caused differences between the units. In general, the results for reactive gases HF and hydrogen chloride are considered approximate (SI Table 3). Although the FTIR is capable of measuring a set of volatile carbon-fluorine compounds (SI Table 6), only CF4 had test averages consistently above MDC2 for a subset of tests. The weak observance of CF4, C2F6, and sulfur hexafluoride above MDC2s by FTIR may be related to residual concentrations of the dynamic spiking gases utilized. These results were not corroborated by canister measurements that showed that none of the 17 analyzed fluorinated compounds above MDL (SI table 7). For these tests, the average water level was 8.34% by volume. The oxygen and carbon dioxide concentrations at LA were 13.66% and 5.13% by volume dry basis, respectively. FTIR data for carbon monoxide were below MDC2 in the majority of cases but are estimated to be 0.34 ppm dry, with this low value indicating generally complete combustion. Methane concentrations measured were below ambient levels. At 0.7 ppm, sulfur dioxide concentrations are also relatively low compared to SSI (USEPA Citation2020). As the method for canister grab sample acquisition of FTIR exhaust is exploratory, the emission rates for compounds observed in canister analysis should be considered approximate. In addition to complete PFAS sampling of the emitted air stream, further research on optimal control strategies for gas phase and particulate matter emission for pyrolysis and gasification systems is required for wider adoption.
Figure 3. One-hour test averages and overall means and medians for FTIR measurements and single-canister results (in kg/h) and by biosolid mass processed (in kg/t) at LA. Results with red ovals represent tests that were below FTIR MDC2 (SI Table 3). Four canister results below MDL were excluded from analysis (SI Table 4).
Summary
In August 2020, a limited-scope test of a commercial-scale biosolid pyrolysis operation at the SVCW WWTP found that target PFAS compounds present in the input biosolids were removed from the produced biochar and were also largely absent from the emission control scrubber water. The test also produced FTIR and evacuated canister measurements of gas-phase emissions that further understanding of this pyrolysis process. This test did not inform target to non-target transformation or PFAS emissions in air, liquid, or solid media, nor did it produce a comprehensive assessment of air pollutants generated by this thermal process.
Additional work is required to understand the pyrolysis treatment of PFAS-impacted biosolids. This work includes the development of methods for the measurement of air emissions of PFAS in low airflow process stacks and approaches for tracking PFAS transformation of in all phases of biosolid processing. Future research includes the evaluation of methods, such as indicator compound injection to help routinely assess the destruction capability of thermal systems. The fate and transport of PFAS and other contaminates, such as heavy metals, in end use applications must also be understood. For wider adoption, optimization of process and emission controls must also be determined. The question remains: is additional research on pyrolysis of biosolids warranted?
The presence of PFAS and other contaminates in WWTP biosolids represents a significant emerging issue, especially for facilities without SSI and with potential influent point source loading. Although much research remains, there is growing concern over land application of potentially impacted biosolids. Alternate disposal routes, such as landfilling and incineration, carry their own costs and environmental uncertainties, which are exacerbated by a lack of PFAS regulatory visibility. As with any thermal system, pyrolysis offers mass reduction and energy recovery potential. The emission characteristics, regulatory position (compared to SSI), and scalability of pyrolysis and certain forms of gasification may make these technologies relatively attractive for consideration for certain categories of USWWTPs. Pyrolysis systems have shown operational viability for a number of feedstocks internationally, and in one case in the US. Pyrolysis systems with energy reuse design and novel drying approaches are more energy intensive than air drying biosolids but less than many thermal solutions. Pyrolysis produces a biochar product that may offer a range of significant use potential including carbon sequestration as a soil amendment. Taken together, these factors indicate that additional research on biosolid pyrolysis is justified.
Disclaimer
The research described in this paper was funded in part by the EPA ORD under contract C68HERC20D0018 to Jacobs Technology, with portions of the research conducted by ORD and BFT under a memorandum of understanding for cooperative research. This paper has been subjected to review by the EPA ORD and approved for publication. Approval does not signify that the content reflects the views of the Agency, nor does mention of trade names or commercial products constitute endorsement or recommendation for use. The authors thank SVCW and individuals with EPA ORD, Montrose, and Bioforcetech assistance in conducting this research.
SI_BFT_PFAS_Pyrolysis_Revised_V2.pdf
Download PDF (243.2 KB)Disclosure statement
No potential conflict of interest was reported by the author(s).
Supplemental data
Supplemental data for this paper can be accessed on the publisher’s website.
Additional information
Notes on contributors
Eben D. Thoma
Eben Thoma is a research physical scientist with EPA’s Office Research and Development, Center for Environmental Measurement and Modeling in Durham, NC. His research focuses on characterization of difficult to measure air pollution sources and their impacts using next generation measurement approaches.
Robert S. Wright
Robert S. Wright is a chemist with EPA’s Office Research and Development, Center for Environmental Measurement and Modeling in Durham, NC. He is a quality assurance specialist with interests in PFAS and EPA traceability protocols for gaseous calibration standards.
Ingrid George
Ingrid George is a research analytical chemist with EPA’s Office Research and Development, Center for Environmental Measurement and Modeling in Durham, NC. Her research focuses on characterization of volatile organic compounds in source emissions and development of new instrumentation and analysis methods to characterize near sources impacts.
Max Krause
Max Krause is a research environmental engineer with EPA’s Office Research and Development, Center for Environmental Solutions and Emergency Response in Cincinnati, OH. His research focuses on PFAS, landfills, and waste management topics.
Dario Presezzi
Dario Presezzi is a Co-Founder and Chief Executive Officer of Bioforcetech Corporation in South San Francisco, CA. Since 2012 he has been working on developing and implementing systems to divert organic waste from landfills and transform them into valuable products.
Valentino Villa
Valentino Villa is a Co-Founder and Chief Operating Officer of Bioforcetech Corporation in South San Francisco, CA. Since 2012 he has been working on developing and implementing systems to divert organic waste from landfills and transform them into valuable products.
William Preston
William Preston is a chemist with Consolidated Safety Services in Durham, NC. He specializes in advanced gas chromatography and mass spectrometry for characterization of environmental samples.
Parik Deshmukh
Parik Deshmukh is a Principal Air Quality Engineer with AECOM in Raleigh, NC and was formerly with Jacobs Technology in Durham, NC. His research focuses on the development and implementation of innovative environmental technology and characterization of near-source impacts.
Phil Kauppi
Phil Kauppi is the National Director of FTIR Services for Montrose Air Quality Service. He has 23 years of field experience utilizing Fourier transform infrared spectroscopy for characterization of combustion, chemical and many other air pollution sources and emission control technologies.
Peter G. Zemek
Peter G. Zemek is a Senior Vice President with Montrose’s Research and Development Center for Emerging Technologies and Emerging Compounds in Fuquay Varina, NC and Boston, MA. His research focuses on characterization of difficult to measure air pollution sources, carbon capture technologies, and mitigation of forever chemicals from air, water and soil.
Related Research Data
References
- ASTM International. 2012. ASTM D6348-12, standard test method for determination of gaseous compounds by extractive direct interface Fourier Transform Infrared (FTIR) Spectroscopy. https://www.astm.org/DATABASE.CART/HISTORICAL/D6348-12.htm
- BFT Bioforcetech Corporation Website. Bioforcetech, 2019. https://www.bioforcetech.com/
- Buck, R. C., J. Franklin, U. Berger, J. M. Conder, I. T. Cousins, P. De Voogt, A. A. Jensen, K. Kannan, S. A. Mabury, and S. P. van Leeuwen. 2011. Perfluoroalkyl and polyfluoroalkyl substances in the environment: Terminology, classification, and origins. Integr Environ Assess Manag 7 (4):513–41. doi:https://doi.org/10.1002/ieam.258.
- Hamid, H., and L. Li. 2016. Role of wastewater treatment plant (WWTP) in environmental cycling of poly-and perfluoroalkyl (PFAS) compounds. Ecocycles 2 (2):43–53. doi:https://doi.org/10.19040/ecocycles.v2i2.62.
- Herzke, D., E. Olsson, and S. Posner. 2012. Perfluoroalkyl and polyfluoroalkyl substances (PFASs) in consumer products in Norway–A pilot study. Chemosphere 88 (8):980–87. doi:https://doi.org/10.1016/j.chemosphere.2012.03.035.
- Houtz, E. F., C. P. Higgins, J. A. Field, and D. L. Sedlak. 2013. Persistence of perfluoroalkyl acid precursors in AFFF-impacted groundwater and soil. Environ. Sci. Technol. 47 (15):8187–95. doi:https://doi.org/10.1021/es4018877.
- Houtz, E. F., R. Sutton, J.-S. Park, and M. Sedlak. 2016. Poly-and perfluoroalkyl substances in wastewater: Significance of unknown precursors, manufacturing shifts, and likely AFFF impacts. Water Res. 95:142–49. doi:https://doi.org/10.1016/j.watres.2016.02.055.
- Huset, C. A., M. A. Barlaz, D. F. Barofsky, and J. A. Field. 2011. Quantitative determination of fluorochemicals in municipal landfill leachates. Chemosphere 82 (10):1380–86. doi:https://doi.org/10.1016/j.chemosphere.2010.11.072.
- Hwang, I., Y. Ouchi, and T. Matsuto. 2007. Characteristics of leachate from pyrolysis residue of sewage sludge. Chemosphere 68 (10):1913–19. doi:https://doi.org/10.1016/j.chemosphere.2007.02.060.
- Kim, J. H., Y. S. Ok, G.-H. Choi, and B.-J. Park. 2015. Residual perfluorochemicals in the biochar from sewage sludge. Chemosphere 134:435–37. doi:https://doi.org/10.1016/j.chemosphere.2015.05.012.
- Kinney, C. A., E. T. Furlong, S. D. Zaugg, M. R. Burkhardt, S. L. Werner, J. D. Cahill, and G. R. Jorgensen. 2006. Survey of organic wastewater contaminants in biosolids destined for land application. Environ. Sci. Technol. 40 (23):7207–15. doi:https://doi.org/10.1021/es0603406.
- Knutsen, H., T. Mæhlum, K. Haarstad, G. A. Slinde, and H. P. H. Arp. 2019. Leachate emissions of short-and long-chain per-and polyfluoralkyl substances (PFASs) from various Norwegian landfills. Environ Sci Process Impacts 21 (11):1970–79.
- Kotthoff, M., J. Müller, H. Jürling, M. Schlummer, and D. Fiedler. 2015. Perfluoroalkyl and polyfluoroalkyl substances in consumer products. Environmental Science and Pollution Research 22 (19):14546–59. doi:https://doi.org/10.1007/s11356-015-4202-7.
- Kundu, S. K., S. Patel, P. Halder, T. Patel, M. H. Marzbali, B. K. Pramanik, J. Paz-Ferreiro, C. C. de Figueiredo, D. Bergmann, and A. Surapaneni. 2020. Removal of PFAS from biosolids by a semi-pilot scale pyrolysis reactor and the application of biosolids derived biochar for the removal of PFAS from contaminated water. Environmental Science: Water Research & Technology 7 (3):638–649. doi:https://doi.org/10.1039/D0EW00763C.
- Lang, J. R., B. M. Allred, J. A. Field, J. W. Levis, and M. A. Barlaz. 2017. National estimate of per-and polyfluoroalkyl substance (PFAS) release to US municipal landfill leachate. Environ. Sci. Technol. 51 (4):2197–205. doi:https://doi.org/10.1021/acs.est.6b05005.
- Lindstrom, A. B., M. J. Strynar, and E. L. Libelo. 2011 Polyfluorinated compounds: Past, present, and future. Environmental science & technology 45(19): 7954–7961 .
- Loganathan, B. G., K. S. Sajwan, E. Sinclair, K. S. Kumar, and K. Kannan. 2007. Perfluoroalkyl sulfonates and perfluorocarboxylates in two wastewater treatment facilities in Kentucky and Georgia. Water Res. 41 (20):4611–20. doi:https://doi.org/10.1016/j.watres.2007.06.045.
- Maine. 2020. Managing PFAS in Maine Final Report from the Maine PFAS task force - January, 2020. Maine PFAS Taskforce Augusta, ME.
- Masoner, J. R., D. W. Kolpin, I. M. Cozzarelli, K. L. Smalling, S. C. Bolyard, J. A. Field, E. T. Furlong, J. L. Gray, D. Lozinski, and D. Reinhart. 2020. Landfill leachate contributes per-/poly-fluoroalkyl substances (PFAS) and pharmaceuticals to municipal wastewater. Environmental Science: Water Research & Technology 6 (5):1300–11.
- MIEGLE. 2020. Initiatives to evaluate the presence of PFAS in municipal wastewater and associated residuals (Sludge/Biosolids) in Michigan. Michigan Department of Environment Great Lakes and Energy, Lansing, MI.
- Miller-Robbie, L., B. A. Ulrich, D. F. Ramey, K. S. Spencer, S. P. Herzog, T. Y. Cath, J. R. Stokes, and C. P. Higgins. 2015. Life cycle energy and greenhouse gas assessment of the co-production of biosolids and biochar for land application. J. Clean. Prod. 91:118–27. doi:https://doi.org/10.1016/j.jclepro.2014.12.050.
- Mills, M. 2020. PFAS treatment in biosolids – state of the science. U.S. EPA Washington, DC. https://www.epa.gov/research-states/pfas-treatment-biosolids-state-science
- Oliaei, F., D. Kriens, R. Weber, and A. Watson. 2013. PFOS and PFC releases and associated pollution from a PFC production plant in Minnesota (USA). Environmental Science and Pollution Research 20 (4):1977–92. doi:https://doi.org/10.1007/s11356-012-1275-4.
- Patel, S., S. Kundu, P. Halder, N. Ratnnayake, M. H. Marzbali, S. Aktar, E. Selezneva, J. Paz-Ferreiro, A. Surapaneni, and C. C. de Figueiredo. 2020. A critical literature review on biosolids to biochar: An alternative biosolids management option. Reviews in Environmental Science and Bio/Technology 19:807–841.
- Paz-Ferreiro, J., A. Nieto, A. Méndez, M. P. J. Askeland, and G. Gascó. 2018. Biochar from biosolids pyrolysis: A review. Int J Environ Res Public Health 15 (5):956. doi:https://doi.org/10.3390/ijerph15050956.
- Regkouzas, P., and E. Diamadopoulos. 2019. Adsorption of selected organic micro-pollutants on sewage sludge biochar. Chemosphere 224:840–51. doi:https://doi.org/10.1016/j.chemosphere.2019.02.165.
- Schaider, L. A., S. A. Balan, A. Blum, D. Q. Andrews, M. J. Strynar, M. E. Dickinson, D. M. Lunderberg, J. R. Lang, and G. F. Peaslee. 2017. Fluorinated compounds in US fast food packaging. Environmental Science & Technology Letters 4 (3):105–11. doi:https://doi.org/10.1021/acs.estlett.6b00435.
- Schultz, M. M., C. P. Higgins, C. A. Huset, R. G. Luthy, D. F. Barofsky, and J. A. Field. 2006. Fluorochemical mass flows in a municipal wastewater treatment facility. Environ. Sci. Technol. 40 (23):7350–57. doi:https://doi.org/10.1021/es061025m.
- Sepulvado, J. G., A. C. Blaine, L. S. Hundal, and C. P. Higgins. 2011. Occurrence and fate of perfluorochemicals in soil following the land application of municipal biosolids. Environ. Sci. Technol. 45 (19):8106–12. doi:https://doi.org/10.1021/es103903d.
- Sinclair, E., and K. Kannan. 2006. Mass loading and fate of perfluoroalkyl surfactants in wastewater treatment plants. Environ. Sci. Technol. 40 (5):1408–14. doi:https://doi.org/10.1021/es051798v.
- Singh, S., V. Kumar, D. S. Dhanjal, S. Datta, D. Bhatia, J. Dhiman, J. Samuel, R. Prasad, and J. Singh. 2020. A sustainable paradigm of sewage sludge biochar: Valorization, opportunities, challenges and future prospects. J. Clean. Prod. 269:122259. doi:https://doi.org/10.1016/j.jclepro.2020.122259.
- Sörengård, M., A. Lindh, L. Ahrens, and J. C. DeWitt. 2020. Thermal desorption as a high removal remediation technique for soils contaminated with per-and polyfluoroalkyl substances (PFASs). PloS One 15 (6):e0234476. doi:https://doi.org/10.1371/journal.pone.0234476.
- Stoiber, T., S. Evans, and O. V. Naidenko. 2020. Disposal of products and materials containing per-and polyfluoroalkyl substances (PFAS): A cyclical problem. Chemosphere 260:127659. doi:https://doi.org/10.1016/j.chemosphere.2020.127659.
- Sunderland, E. M., X. C. Hu, C. Dassuncao, A. K. Tokranov, C. C. Wagner, and J. G. Allen. 2019. A review of the pathways of human exposure to poly-and perfluoroalkyl substances (PFASs) and present understanding of health effects. J Expo Sci Environ Epidemiol 29 (2):131–47. doi:https://doi.org/10.1038/s41370-018-0094-1.
- USEPA, Biosolids Generation, Use, and Disposal in The United States. 1999a. EPA530-R-99-009. U.S. EPA Office Solid Wasteand Emergency Response Washington, DC.
- USEPA. 1999b. Air method, toxic organics-15 (TO-15): Compendium of methods for the determination of toxic organic compounds in ambient air, second edition: Determination of Volatile Organic Compounds (VOCs) in Air collected in specially-prepared canisters and analyzed by Gas Chromatography/Mass Spectrometry (GC/MS). EPA 625/R-96/010b. U.S. EPA Office of Air and Radiation Washington, DC. https://19january2017snapshot.epa.gov/sites/production/files/2015-07/documents/epa-to-15_0.pdf
- USEPA. 2009. Determination of selected perfluorinated alkyl acids in drinking water by solid phase extraction and Liquid Chromatography/Tandem Mass Spectrometry (LC/MS/MS). Version 1.1. U.S. Environmental Protection Agency, Washington, DC, EPA Document No.: EPA/600/R-08/092. U.S. EPA Office of Air and Radiation Washington, DC. https://www.epa.gov/pfas/epa-pfas-drinking-water-laboratory-methods
- USEPA. 2018. EPA unable to assess the impact of hundreds of unregulated pollutants in land-applied biosolids on human health and the environment. Report No. 19-P-0002, U.S. EPA Office of Inspector General Washington, DC.
- USEPA. 2020 . Sewage Sludge Incineration Units (SSI): New Source Performance Standards (NSPS) and Emission Guidelines (EG). U.S. EPA Office of Air and Radiation Washington, DC. https://www.epa.gov/stationary-sources-air-pollution/sewage-sludge-incineration-units-ssi-new-source-performance
- Winchell, L. J., J. J. Ross, M. J. Wells, X. Fonoll, J. J. Norton, W. Bell, and K. Y. Per‐and. 2021. polyfluoroalkyl substances thermal destruction at water resource recovery facilities: A state of the science review. Water Environment Research 93 (6):826–43. doi:https://doi.org/10.1002/wer.1483.
- Xiao, F., P. C. Sasi, B. Yao, A. Kubátová, S. A. Golovko, M. Y. Golovko, and D. Soli. 2020. Thermal stability and decomposition of perfluoroalkyl substances on spent granular activated carbon. Environmental Science & Technology Letters 7 (5):343–50. doi:https://doi.org/10.1021/acs.estlett.0c00114.
- Xiao, F., T. R. Halbach, M. F. Simcik, and J. S. Gulliver. 2012. Input characterization of perfluoroalkyl substances in wastewater treatment plants: Source discrimination by exploratory data analysis. Water Res. 46 (9):3101–09. doi:https://doi.org/10.1016/j.watres.2012.03.027.