
ABSTRACT
This study investigated how heat demand and fuel loading affect the emissions from outdoor wood-fired hydronic heaters by testing two such appliances using an integrated-duty cycle test method. This test included transient operating conditions, such as cold and hot-starts and modulation between 15 and 100% of maximum rated output. Emission values indicate transient operating conditions produce higher emissions than steady state operation. Cold starts resulted in elevated particulate matter emission factors for both appliances; in one case the particulate matter emission factor for this period was >3500 mg/MJ, which represented emissions 20 times the average value. Additionally, when heat demand was cycled—elevated CO emission factors were measured, with values >5000 mg/MJ for both appliances and more than 3 times the appliance averages, respectively. It follows that the appliance average particulate matter emission factors and CO emission factors were not representative of the actual EF values during these transient periods. In contrast, methane emission factors were relatively stable throughout all tested combustion conditions; however, they were much higher than oil-fired appliances are therefore should not be ignored. These findings demonstrate that wood-fired hydronic heater emissions during transient operating conditions can be significantly greater than emissions during steady-state test conditions, such as those used in typical certification tests. Consequently, certification test values for particulate matter and CO emission factors may significantly underestimate the actual emissions of these appliances when operated in a home. Use of integrated duty-cycle test protocols that capture cold-starts and reloading are better for representing in-use operations of wood-fired hydronic heaters and provide more realistic emissions and delivered efficiency measurements.
Implications: In this work we provide information on the particulate and gaseous emissions from two wood fired outdoor hydronic heaters. The units were tested using an integrated duty cycle test method that captured cold starts, reload, cyclic and modulating periods between 15 and 100% of maximum rated output. The data and results show a much higher emission factor than those reported by current certification test methods but are more representative of how the units operate in the field.
Introduction
Woody biomass has been used for centuries for the purpose of heating and cooking. Today, wood continues to be an important fuel for many countries and is considered part of the renewable energy mix. As of 2015, nearly 11% of homes in the United States (US) used wood as an energy source, mainly for space heating; nearly one-third of those homes mainly in rural areas used wood as their main fuel source, making the residential sector the second largest user of wood for energy purposes (U.S. Energy Information Administration Citation2021). The use of wood both in the residential sector rivals the consumption of propane and is only marginally less than fuel oil (U.S. Energy Information Administration Citation2014). Additionally, wood is a major fuel source in many developing countries and seen as one of the most affordable heating sources for low-income families residing in rural areas of the US. Koraïem and Assanis report that the use of wood increases significantly as income dips below the US median, with the lowest income bracket consuming the most (Koraïem and Assanis Citation2021).
While the combustion of wood for heating has been promoted as carbon neutral (Saxena, Adhikari, and Goyal Citation2009), it has an outsized impact on both air quality and health. Allen and Rector indicate residential wood combustion (RWC) accounted for 15% of US Particulate Matter (PM) which was five times greater than petroleum refineries, cement manufacturers, and pulp and paper mills combined (Allen and Rector Citation2020). In 2017, 8720 tons of particulate matter 2.5 micron and smaller (PM2.5) were attributed to residential heating in New York (NY), accounting for 79% of PM2.5 in NY (United States Environmental Protection Agency Citation2021). Multiple studies have shown that the fine particles and polyaromatic hydrocarbons (PAHs) are toxic for human cells (Jalava et al. Citation2012; Kaivosoja et al. Citation2013; Kocbach Bølling et al. Citation2009; Lamberg et al. Citation2011; Leskinen et al. Citation2014). As many as 30 million US residents are impacted by woodsmoke each year (Noonan, Ward, and Semmens Citation2015; Rogalsky et al. Citation2014). Further, Kodros et al. estimated in 2015, 2.81 million premature deaths were owed to solid fuel combustion (Kodros et al. Citation2018). Penn et al. estimated 10,000 premature mortalities per year related to RWC, driven primarily by PM2.5 emissions (Penn et al. Citation2017). Understanding the impact RWC has on both the national and global environmental and health economy is paramount.
A wood heater’s performance is significantly influenced by the technology, fuel type and quality, loading practices, burn conditions, and other user behavior. Technology considerations include the device type (stove, hydronic heater, furnace), the use of combustion staging, and whether oxygen or temperature sensors are used (Gibbs and Butcher Citation2010; Kinsey et al. Citation2012; Orasche et al. Citation2012; Ozgen et al. Citation2014; Schmidl et al. Citation2011; Vicente et al. Citation2015). The use of secondary air injection or gasification techniques have shown the greatest reductions in emissions (Kinsey et al. Citation2012; Vicente et al. Citation2015). Other studies have shown the impact of fuel type such as pellet, chips, briquettes, log wood, or dimensional lumber and wood species have on emissions (Calvo et al. Citation2014; Garcia-Maraver et al. Citation2014; Johansson et al. Citation2003; Kinsey et al. Citation2012; Kistler et al. Citation2012; Morin et al. Citation2022; Orasche et al. Citation2012; Schmidl et al. Citation2011; Shen et al. Citation2014; Vicente et al. Citation2015). The fuel’s quality such as its moisture content, whether the pieces are free of decay and bark, and size also impact emissions (Johansson et al. Citation2004; Ozgen et al. Citation2014; Shen et al. Citation2013; Sippula et al. Citation2007; Vicente et al. Citation2015). Typically, automatic-fed fuel appliances that use more uniform fuels such as pellets have better performance in terms of emissions and efficiency in comparison to logwood (Bertrand et al. Citation2017; Johansson et al. Citation2004; Kinsey et al. Citation2012; Klauser et al. Citation2018; Ozgen et al. Citation2014; Schmidl et al. Citation2011).
Burn rate and the load demand (the desired heat output), also impact the emissions as oxygen is varied to adjust the fuel-to-air mixing ratio in order to manage the output of the heater. Unlike a gas or oil-fired appliance, the fuel for a wood-fired heater is not “shut-off” once a demand is met, even for the case of an automatically fed pellet or chip appliance. Instead, air dampers are slowly shut, and the appliance may remain firing while the fuel is smoldered, but not fully extinguished. Butcher and Russell showed emissions generally increased as the load was decreased and were exponentially higher when the hydronic heater (HH) was operated below 25% of the nominal rating (Butcher and Russell Citation2011). Gibbs and Butcher determined that nominal fuel loads calculated according to the loading procedures specified in currently approved crib wood testing procedures can underestimate typical load sizes in the field by a factor of two or more. An unrealistically low nominal field load can result in serious oversizing of appliances in consumer homes (Gibbs and Butcher Citation2010), which results in decreased efficiency and increased emissions. Orr et al. show the efficiency may be decreased by nearly 12% as the cycle frequency increases and the boiler on time is decreased from 3600 seconds to 10 seconds (Orr, Lelyveld, and Burton Citation2009). Additional studies have further discussed the impact of oxygen supply on emissions, indicating lower air supply produced higher emissions than in cases with proper air mixing (Johansson et al. Citation2003; Nuutinen et al. Citation2014; Ozgen et al. Citation2017; Schmidl et al. Citation2011; Shen et al. Citation2013; Torvela et al. Citation2014).
In response to emission concerns researchers have worked to provide data to improve the emission factors for this source category in the US Environmental Protection Agency’s (EPA) AP-42: Compilation of Air Emissions Factors (USEPA Citation2003). The AP-42 emission factors are used to calculate the emissions in EPA’s National Emission Inventory (NEI) which are used by researchers and regulators as model inputs and in decisions related to air quality regulations. As early as 1986, Burnet et al. provided updated particle and carbon monoxide (CO) emission factors for wood stoves that took into account the effect of variability in operational use, fueling, and wood heater models on emissions (Burnet et al. Citation1986). However, the Burnet et al. recommendations were based on data from a test procedure that had very rigid operation conditions with four distinct burn rates, dimension lumber (or otherwise known as cribwood) with a precise loading density and began tests with a hot coal bed. Recent research has demonstrated that the laboratory operating and fueling procedures are not typical of field use, raising the concern that wood heater emissions have been underestimated (Admadi et al. Citation2020; Rector et al. Citation2021; Reichert et al. Citation2018). Additionally, AP-42 only includes emission factors (EFs) for residential wood stoves and wood residue combustion for industrial uses, data for residential HHs are missing.
Researchers across the world have advocated the need for improved test methods that are reproducible, representative of in-use conditions, and provide better EFs that reflect realistic values to improve modeling efforts and reduce uncertainties in EFs. Although researchers have provided EFs of their own, the available data is difficult to compare as fuel quality, measurement and sampling techniques, as well as experimental protocols are far from uniform. Existing test methods for HHs measure emissions under conditions design to minimize variability (OAQPS Citation2016). However, a study by Ahmadi et al. shows that certification test practices that use a single fuel configuration at a single burn rate with no start-up or reload period are not reflective of patterns identified in the field (Ahmadi et al. Citation2020).
Gibbs and Butcher suggested test methods for combustion systems needed to strike a balance between repeatability with reproducible results, be applicable to the full diversity of appliances in the marketplace and reflect the operating the fueling conditions encountered in the field (Gibbs and Butcher Citation2010). Klauser et al. also suggested EFs from defined consistent field use methods, such as the “beReal” method developed in Europe for wood stoves, would considerably improve the value of emission inventories as the EFs obtainable from different literature sources offer limited comparability (Klauser et al. Citation2018). Additionally, Reichert et al. suggests the development and implementation of new test methods that evaluate wood heaters closer to field performance push technological innovation and development (Reichert et al. Citation2018).
In collaboration with the Northeast States for Coordinated Air Use Management (NESCAUM), the team from Brookhaven National Laboratory (BNL) worked to develop a testing protocol that was representative of field conditions to measure the efficiency and emissions of outdoor wood-fired hydronic heaters (HHs). Two HHs were tested using a protocol that includes a range of various heat demand patterns. The paper presents emission factors (mg/MJ), rates (g/hr), and indices (g/kgfuel) for PM, CO, and hydrocarbons (HC), as methane (CH4), for the two wood fired HHs operated according to a multi-phase testing protocol. Similar to the “beReal” method developed in Europe for wood stoves, the protocol outlined below was designed to include multiple fueling events and burn phases that better reflect field use for HHs with the ability to be conducted in one day (Klauser et al. Citation2018; Reichert et al. Citation2016). Furthermore, the developed protocol discussed here is specifically for HHs and follows traditional US methods for condensable PM sampling measurements in a dilution tunnel.
Experimental
The two outdoor wood fired HHs were operated without external thermal storage and evaluated in a laboratory using a testing protocol developed by BNL and NESCAUM. The testing protocol was developed to capture various phases of an appliance’s operation in a single day of testing. Phases in the protocol included alternative loading patterns, a cold start, the investigation of a small coal bed, and variable load profiles using cordwood. Additionally, both HHs were tested in triplicate to this protocol to evaluate the replicability of the results.
Combustion appliances and laboratory set-up
Both appliances were large-mass units with large internal water volumes and these units are typically installed outdoors but used to heat homes. The appliances employed different combustion strategies to ensure cleaner, more efficient burns than traditional updraft, single-chamber HHs. Appliance A used two-stage combustion techniques, where primary and secondary air are injected via mechanical ventilation into the fuel bed and upper parts of the combustion chamber (Nussbaumer Citation2008). Appliance B, a gasification HH, consisted of a primary chamber where the wood is gasified under substoichiometric conditions to release the volatile components and a separate, secondary chamber where the volatile gas mixture is burned using pre-heated air and lean conditions (Gibbs and Butcher Citation2010). Appliance A, the smaller of the two units contained a microprocessor controller that considered multiple combustion zone temperatures and its internal oxygen sensor (lambda sensor), both primary and secondary air dampers, and a catalyst in the exhaust stream. Appliance B’s controls were slightly less sophisticated as they only consisted of a water temperature sensor and fan speed from its induced fan. Both units stage combustion air to different degrees and had a control panel to indicate the unit’s water temperature, status, and catalyst temperature (HH A only), and damper percentage (HH B only). Both HH A and HH B were US EPA certified as compliant with the New Source Performance Standards (NSPS) limits in 2018 testing. Details of each HH’s firebox and water jacket volume, combustion technology, and rated output, efficiency, and published emission rate as per EPA Method 28 Wood Hydronic Heaters (M28 WHH) (United States Environmental Protection Agency Citation2019) are found in .
Table 1. Hydronic heater descriptions.
Both units used a pump to deliver hot water from the HH to a heat exchanger with a thermal load was placed on it. Both HHs were placed on a floor weigh scale, so the fuel burn rate was directly determined from the mass change. The weigh scale had a rated capacity of 2721.5 kg with a resolution of 0.1 kg and was calibrated annually to the National Institute of Standards Technology (NIST)-traceable standards. Each appliance was plumbed according to the manufacturer’s specifications listed in the operation manuals, including a circulating pump that was able to deliver 37.9–42.4 lpm to the load heat exchanger, and a mixing valve upon the return to ensure water below 60°C never returned to the HH to avoid condensation.
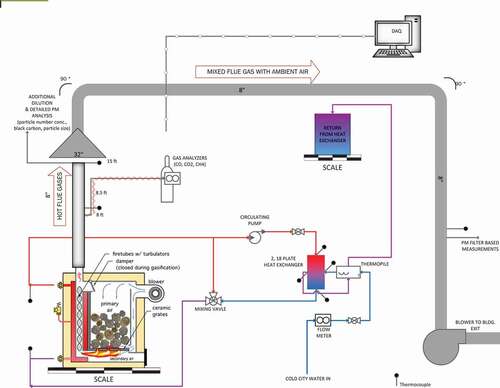
Two 18-plate heat exchangers in parallel were used to impose thermal loads on the HH and placed inside an insulated foam box. Hot water from the HH flowed on one side of the heat exchanger while cold “city” water flowed on the other side to impose the target load. The flow rate was controlled and measured by an ePIV Belimo control valve and also measured directly using a weigh scale. The flow rate from the HH to the load heat exchanger was adjusted to provide a temperature drop across the heat exchanger of 6.6°C (supply/return) to approximate the performance expected in the field. details the experimental facility inclusive of the dilution tunnel used for sampling in the laboratory and a representative wood fired HH device adapted from Siegenthaler with permission.
Figure 1. Schematic diagram of wood-fired hydronic heater experiment. Boiler device schematic adapted with permission from (Siegenthaler Citation2017).
Testing procedure
The multi-phase testing protocol was developed to measure HH emissions in operational cycles and reloading patterns that are common practice for residential homes. In contrast to the current US EPA certification methods that use one test batch of wood for each specified fixed test load, the test procedure used in this study included two fueling loads to capture both a cold start and a fuel reload event, followed by a series of different load profiles. Details regarding the protocol’s development may be found in a report by Trojanowski et al. (Citation2019); however, the Integrated Duty Cycle protocol for HH units is still in draft form (Brookhaven National Laboratory Citation2018). A summary of each phase along with its description and the milestone to indicate when one phase transitioned to the next is seen in .
Table 2. Multi-Phase testing protocol.
Testing of both HHs followed the batch-wise protocol detailed below but differed in start-up procedures as per written manufacturer instructions. Appliance A was cleaned prior to each use to remove all coals and ash from previous burns, while Appliance B required the ash and coals to be left in the combustion chamber for added insulation. For both HHs, initially the kindling and small fuel pieces were arranged in accordance with the manufacturer’s instructions with a few pieces of crumbled newspaper below the fuel charge. Appliance A had the fuel pieces arranged all in one direction, whereas Appliance B had the pieces in a lattice fashion.
Phase 1 captured a cold start which literature has shown can be a period of high emissions (Goncalves et al. Citation2011; Schmidl et al. Citation2011; Win, Persson, and Bales Citation2012). During this phase, the combustion chamber was cold (no coal bed) and kindling and starter fuel pieces were ignited to establish a coal bed. Once 80% of the kindling charge was consumed, Phase 1 was complete, and the first fuel charge was placed on top of the coal bed to begin Phase 2. For HH A, at the end of Phase 1, the catalyst’s temperature was at or near 400°C indicating the catalyst had ignited. The first fuel charge loaded followed a similar loading density to that of M28 WHH (160 kg/m3) (United States Environmental Protection Agency Citation2019) and was added in its entirety all at once for HH A. Appliance B, as per the written manufacturer instructions, required the load to be added in two batches; loading half of the first fuel charge at the beginning of Phase 2 and, once half of that charge burned, the remaining half of the first fuel charge was added – all before Phase 2 concluded. Once 20% of the first fuel charge was consumed, Phase 3 began and was followed by Phases 4, 5 and 6. Phases 3 through 6 are representative of Categories II (16 to 24% of manufacturers rated output), III (25 to 50% of manufacturers rated output), and IV (manufacturers full rated output) in M28 WHH but completed in a shorter time frame, using a single batch of fuel for all phases versus individual full fuel loads for each category and burning each full batch of wood completely.
At the completion of the first fuel charge, a second fuel charge with a higher loading density than the first fuel charge was added. The purpose of this was to represent field practices in which a user loads the entire chamber full instead of to a specified loading density to maximize the time between refueling their firebox. Phase 7 reflected a hot start as the fuel charge was reloaded on top of a hot coal bed. Immediately after 10% of the reload charge was consumed, the load on the HH was minimized to ≤15% of nominal load (M28 WHH Category I equivalent) until 2 hours passed or the HH cycled once. Not all HHs cycle on and off, some are able to modulate low enough to continue burning, and some may idle completely, only firing the appliance for a brief amount of time, so the small flame does not completely extinguish. Therefore, having a fuel percentage burned or required cycle times as the milestone to complete Phase 8 could result in long test times or an unachievable milestone. Following Phase 8, Phase 9 was a recovery period of full output (M28 WHH Category IV equivalent) to establish a full output, steady state combustion period before heading into Phase 10.
It was important to capture the emissions associated with low loads and cyclic operations to measure each HH’s performance in a more realistic manner. If a unit can avoid cycling in Phase 8 because it can operate for 2 hours without cycling, the emissions from cycling would be captured in Phase 10. Phase 10 explored what happens commonly in a home when there is a demand for heat called by the thermostat. In the case of an oil or gas-fired system, once the load is satisfied and there is no longer a demand, the burner is ramped down or shut off. The burner would then re-ignite once there is a demand for heat again. This also is typical operation for automatic fired biomass HHs (pellet and chip fueled appliances). However, cordwood fired appliances do not have an electrical ignition, so they modulate dampers and/or fans to slow combustion to avoid a manual restart. Ultimately, in many cases, high emissions occur during this oxygen-starved period. Phase 10 began once the HH reached its setpoint temperature of 82°C The cooling water was then turned on for five minutes and off for ten minutes until an hour’s time had passed to emulate a thermostat calling for heat and the demand being satisfied. In both cases, the HHs cycled. Each unit ramped their fans and closed dampers to cool down until they reached 71°C and slowly ramped up to return to their setpoint temperature again (82°C).
Sampling methods
Particulate matter (PM) emissions were determined gravimetrically and sampled in accordance with the American Society for Testing and Materials (ASTM) E2515–10 (ASTM International Citation2010), with the following modification. ASTM E2515–10 requires dual sample trains to collect PM on filter media over an entire integrated testing period; however, only one sampling train was used to sample PM over the entire testing period and a second train was used to sample each individual phase. Both sampling trains used Teflon-coated glass fiber filters (Palllflex Emfab T× 40) as the filter media. Sampling flow rates on both trains were also kept consistent at a rate of roughly 94 cm3/s.
Flue gas samples for analysis were taken directly from the stack and included CO, volatile hydrocarbons (HCs as methane), and carbon dioxide (CO2), and were sampled directly at the HH’s exhaust, not at the standard 2.4 meters from the top of the scale in accordance with the Canadian Standards Association’s Performance Testing of Solid-Fuel-Burning Heating Appliances (CSA B415.10) (Canadian Standards Association Citation2010). Each gas analyzer was calibrated prior to each test with both nitrogen and calibration gas. All calibration gases were certification grade from Matheson Tri-Gas Co. with an accuracy of 2%.
CO, CO2, and methane (CH4) were measured directly in the stack using an infrared analyzer (California Analytics, Model ZRE). The CO limit on this analyzer was 50,000 parts per million (ppm) and the CH4 limit was 1,600 ppm; above these values the analyzer is out of range and no longer provides a measured value.
Type K thermocouples were also logged at a five-second interval for all temperature measurements. Including stack temperature (2.6 meters from the stove base), top of the stack (4.6 meters), dilution tunnel, ambient air (laboratory), and in-between the front and back filters in each PM sample probe. The thermocouples have an associated error of 2.2° or 0.75%. Pressure in the dilution tunnel was measured with a digital BAPI ZPS series differential pressure transmitter capable of measuring 0 to 30 pascals.
For cooling water flow control and logging of flue gas composition, cooling water flow, HH scale mass, dilution tunnel velocity, and temperatures, a laboratory data acquisition (DAQ) system was used with Visual Basic programming and logging at 5 second intervals. Each gas analyzer had a resolution of 0.1%. The programming allowed for input of a target heat output rate, and the cooling water flow was continuously adjusted by the program to achieve the target output.
Black carbon (BC) absorption was measured by our collaborators using a Magee Scientific Aethalometer Model 33. The BC concentration was calculated using the instrument’s 880 nm wavelength channel using a mass-absorption cross section of 7.77 m2/g and standard correction factors. One-minute average BC concentrations measured with the instrument were then used to calculate phase mean BC concentrations which were combined with flue gas flow rate data in order to calculate BC emission rate. For more information on the specifics of the measurement process please refer to Lindberg et al. (Citation2022).
Fuel
In all tests, red oak cordwood was used. The test fuel in all cases was prepared by the State University of NY (SUNY), College of Environmental Science and Forestry (ESF) in accordance with partial kiln drying procedures (Smith Citation2014). Each fuel piece was measured within four hours of each test for its moisture content and weight – falling between an average of 19 and 25% on a dry basis. Details regarding the moisture measurement may be found in a report by Trojanowski et al. (Citation2019).
To assess the impacts of different load volumes, two fueling procedures were used during testing. The first, was conducted in accordance with M28 WHH, which requires the fuel charge to have a loading density of 160 kg/m3 and the individual fuel piece length to be 80% of the longest firebox dimension. The second fueling procedure followed the loading procedures found in the manufacturer’s operational manual and were also considered to be more common field practice – filling the firebox up to within 2.5 cm of the top of the HH’s door. Gibbs and Butcher’s report indicates, manufacturers preferred following the instruction manual’s written loading procedures and using cordwood instead of cribwood as it reflected actual in-use emissions (Gibbs and Butcher Citation2010). shows the target piece size and fuel weights for both HHs based on the developed protocol.
Table 3. Fuel charge description with size and fuel charge mass specification used for each appliance during each fuel loading event within the test method.
To obtain representative data for both HHs, three complete testing cycles were carried out for each appliance according to the operational, fueling, and measurement protocol described previously. Measurements of particle number concentration, size, and black and brown carbon concentrations were also made simultaneously during testing. These results are not included here and instead are discussed further in companion papers (Lindberg et al. Citation2022, Citation2022).
For all tests, the efficiency was determined using a stack-loss method, alternative to an output/input calculation. The energy that is discarded out the flue is determined based on flue gas temperature and composition measurements, fuel moisture composition, and assumed ultimate analysis of the dry fuel. The flue losses include flue gas sensible heat, latent heat in the flue gas water vapor, and chemical energy in the flue gas CO. This method is commonly used in standards such as CSA B415.1–10 (Canadian Standards Association Citation2010).
Results
The weighted emission averages of the triplicate tests performed are discussed below as well as the individual tests are described for both HHs. Weighted emission values are calculated from the phase weighting factors provided in the method itself and are summarized in (Brookhaven National Laboratory Citation2018). The weighting factors were assigned based upon the percentage of time spent in each phase for a given heating season. Results are intentionally presented for each HH individually as the key objective was to evaluate the testing procedure. The emissions and performance of each HH are later compared to each other with a small discussion of design influence on emissions.
Table 4. Phase Weighting Factor.
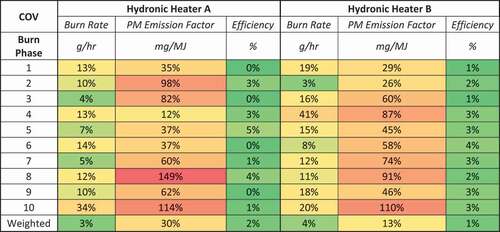
Overall, the calculated coefficient of variation (COV) for the weighted burned rate had very low variance, measuring 3% and 4% for Appliance A and B, respectively. However, individual phases showed more variability across the three tests. The highest COVs were observed during Phase 10 (cyclic operation period) and Phase 4 (25% or less of nominal load). In general, Appliance B showed greater variability in terms of burn rate across all phases. Both HHs also had very low variance in terms of calculated efficiency for the entire burn duration and individual periods across all three tests. However, both HHs had very high COV values with respect to the PM EF (based on energy output). The COV for PM EFs were generally highest during the cyclic operation period which may be due to the burn rate variation, but also did not correlate well with type of burn phase or output. Additionally, the PM EF COVs calculated are based on experimental factors and procedures, that contribute further to their higher values. presented as a heat map shows the COV of burn rate, PM emission factors, and efficiency for both HHs.
Figure 2. Coefficient of variation heat map for burn rate, particulate matter (PM) emission factor, and efficiency for Hydronic Heater A and B.
Particulate matter emissions
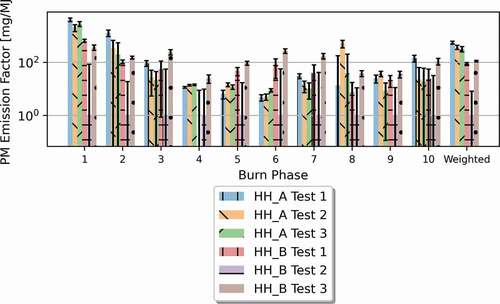
The average EF (based on energy output), emission rate (ER), and emission index (EI) of the three tests for each burn period and the entire test duration for Appliance A and B are given in ’s heat map to demonstrate higher and lower emission periods. More detailed graphical representations of the calculated PM EFs for both appliances are given in Each test is represented by a different color and pattern, with error bars representing the standard error of the mean, describing the accuracy of the mean, where smaller error bars imply better accuracy. Figures representing the ER and EI for HH A and B are provided in the Supplementary Information (SI) document. In all three tests for both HHs, the maximum PM emissions (EF, ER, and EI) occurred during Phase 1, the cold start period. The lowest PM emissions occurred during Phase 6, the burn out period for HH A, while the lowest PM emissions for HH B were shared between the lowest load periods, Phase 4 (less than 25% of nominal load) and 8 (less than 15% of nominal load).
Figure 3. Heat map with average particulate matter (PM) emission factor, emission rate, and emission index for each phase of the operating protocol for both hydronic heaters.
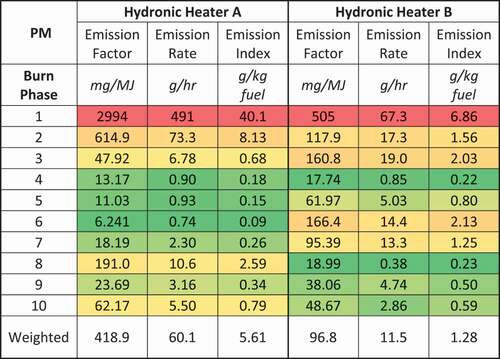
Figure 4. Bar chart showing the particulate matter (PM) emission factor (EF), in units of milligrams of particulate matter per megajoule of energy output (mg/mj), calculated for each experiment during triplicate testing of Hydronic Heater A (HH A).
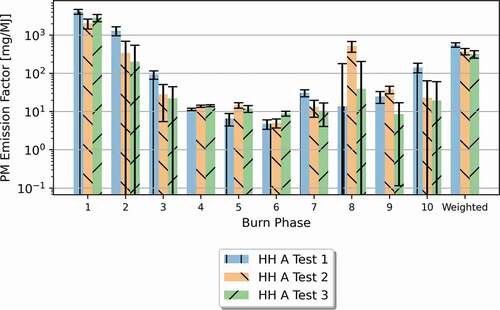
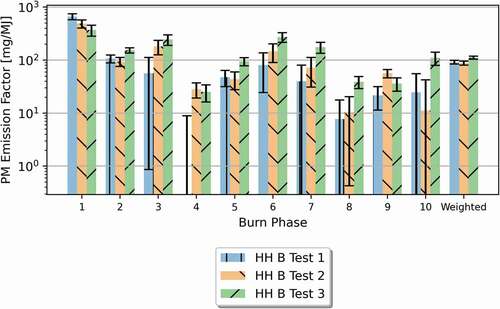
Figure 5. Bar chart showing the particulate matter (PM) emission factor (EF), in units of milligrams of particulate matter per megajoule of energy output (mg/mj), calculated for each experiment during triplicate testing of Hydronic Heater B (HH B).
The overall weighted average for Appliance A’s PM EF was 418.9 mg/MJ, with a range of 6.24 to 2994 mg/MJ. Average values for the ER ranged from 0.74 g/hr to 491 g/hr, with an overall weighted average test value of 60.1 g/hr. The range in EI for HH A was between 0.09 and 40.2 g/kg with an overall weighted average e of 5.61 g/kg.
HH B had a PM EF range of 17.7 to 505 mg/MJ, with an overall weighted average of 96.8 mg/MJ. Average values for the ER ranged from 0.38 g/hr to 67.3 g/hr, with a weighted average test value of 11.5 g/hr. The overall weighted average EI for Appliance B was 1.28 g/kg with a range of 0.22 to 6.86 g/kg.
As seen in , the maximum PM EF calculated from the measured data for Appliance A was 4093.14 mg/MJ and occurred during Phase 1 of Test 1. The minimum occurred during Burn Phase 6 (the burn out period) and was 4.78 mg/MJ, also during Test 1. Overall, Burn Phase 2 followed the cold start in terms of highest PM EFs while the next lowest calculated EF occurred during Phases 4 and 5 but were still nearly double the emissions produced during Phase 6. During Test 2 and Burn Phase 8, the HH A’s catalyst temperature fell below 260°C for unknown reasons, causing a spike in PM. The measurable CO and CH4 values increased significantly during this period, as well as visible smoke.
Similar to Test 1 of HH A, the maximum PM EF for HH B occurred during Phase 1 of Test 1 and was 661 mg/MJ as shown in The minimum occurred during Burn Phase 4 and was 0.00 mg/MJ, also during Test 1. There was no mass collected on the filter during this period. Following Phase 1, Burn Phases 3 and 6 had the next highest PM EFs, while the low Burn Phases 4 and 8 had trended the lowest.
Carbon monoxide emissions
Carbon Monoxide (CO) is an important primary gaseous emission generated during biomass combustion. During transient and burn out combustion conditions, CO concentrations are typically high because the carbon from the fuel is not completely oxidized due to poor air-to-fuel mixing ratios. It follows that CO emissions can be high for RWC appliances. Both Appliance A and B’s average EF, ER, and EI for each phase is given in .
Figure 6. Heat map with average carbon monoxide (CO) emission factor, emission rate, and emission index for each phase of the operating protocol for both hydronic heaters.
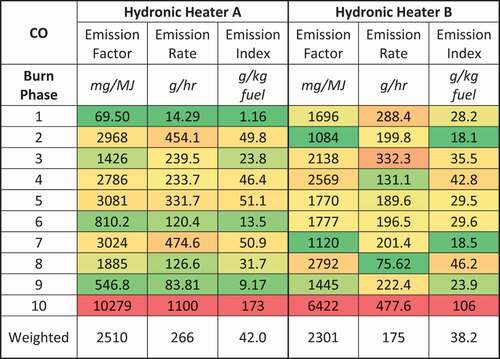
The overall weighted average CO EF for Appliance A was 2510 mg/MJ, with a range from 69.5 to 10279 mg/MJ. The CO ER ranged between 14.3 g/hr and 1100 g/hr and the overall weighted average value was 266.2 g/hr. The EI ranged between 1.16 g/kg and 172.9 g/kg and the overall weighted average value was 42.03 g/kg. Phase 10, the cyclic operation where air-to-fuel mixing ratios were not optimal, CO emissions were highest as seen in the heat map. However, during the burn out period, Phase 6 and steady state full output (Category IV, Phase 9) the CO emission were typically lowest.
The overall weighted average CO EF for Appliance B was 2301 mg/MJ, with a range from 1084 to 6422 mg/MJ. The CO ER ranged between 75.62 g/hr and 477.6 g/hr and the overall weighted average value was 175.0 g/hr. The EI ranged between 18.07 g/kg and 106 g/kg and the overall weighted average value was 38.16 g/kg. As indicated by the heat map shown in , the highest average and individual test values for CO emissions were always during the cyclic operation, Burn Phase 10, similar to HH A.
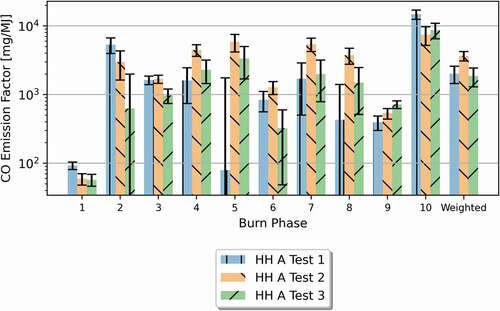
As shown in , Phase 10 of Test 1 for HH A produced a CO EF of 14711 mg/MJ, an order of magnitude greater and nearly 2.7X that of the second highest emission period (Phase 2 of Test 1 with an EF of 5,305 mg/MJ). The lowest average emissions were during the cold start, Phase 1. Phase 7 had higher CO emission values due to poor ignition of the catalyst after reloading the second fuel charge, followed by the catalyst temperature dropping in Phase 8 as mentioned above.
Figure 7. Bar chart showing the carbon monoxide (CO) emission factor (EF), in units of milligrams of CO per megajoule of energy output (mg/mj), calculated for each experiment during triplicate testing of Hydronic Heater A (HH A).
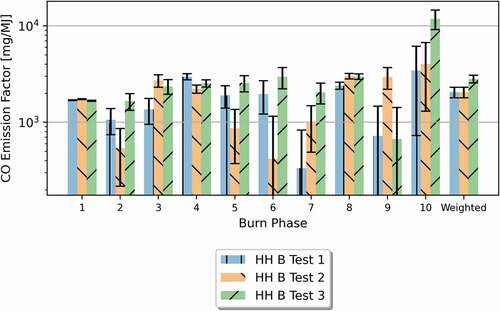
shows the CO EFs of HH B for all three tests, with the highest values during Phase 10 of the burn cycle. The lowest were shared amongst Phases 2, 6, and 7. Overall CO EFs were consistently less than 4000 mg/MJ, with the exception of Phase 10 of Test 3. In all the calculated CO EF, ER, and EI, the cyclic operation (Phase 10) significantly increased the emissions, likely due to the unit responding quickly to the decreased heat demand once the demand was satisfied. In this situation the unit would quickly close its damper to reduce airflow and slow the fans to decrease the combustion to avoid overheating. The lack of oxygen supplied to the fuel resulted in increased CO emissions.
Figure 8. Bar chart showing the carbon monoxide (CO) emission factor (EF), in units of milligrams of CO per megajoule of energy output (mg/mj), calculated for each experiment during triplicate testing of Hydronic Heater B (HH B).
Additional information regarding the results and trends of HH A and B’s ER and EI for CO can be found in the Supporting Information (SI) document.
Methane emissions
Methane is an important pollutant byproduct of biomass combustion due to its strong greenhouse gas potential. Johansson et al. found that methane was prevalent in wood smoke for older wood-fired HHs and the effect on climate change could be greater than that of an oil HH, and that replacing an older HH with a modern wood-fired heater or pellet-fired appliance would reduce methane emissions by 8 to 9000 times (Johansson et al. Citation2004). Studies have shown that methane emissions are highest during periods of low-temperature combustion or incomplete combustion, which are common during transient combustion conditions, such as the start-up or shut-down cycle for HHs (USEPA Citation2003).
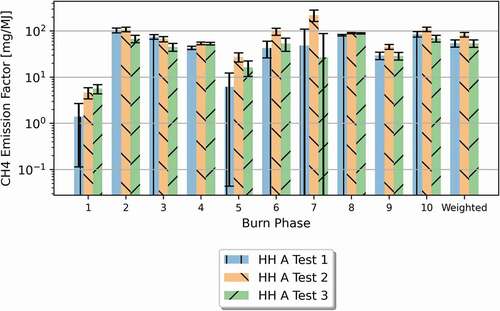
Appliance average methane EF, ER, and EI for each phase is given in for Appliance A and B. Methane is often produced during periods of incomplete combustion and insufficient oxygen, such as smoldering periods. Methane is also prevalent in biomass combustion due the fuel’s high moisture content. In all three tests of Appliance A, the highest emissions were observed during Phase 7, the reload period, as the lowest were during the cold start, Phase 1. Phase 7, the reload period, has a significant amount of fresh wet fuel added to a coal bed, which likely contributed to the increase in CH4 emissions. The overall weighted average methane EF was 64.1 mg/MJ. The range in ER for HH A was between 0.85 g/hr and 15.71 g/hr with an overall weighted average value of 6.71 g/hr. The range in EI for HH A was between 0.06 g/kg and 1.67 g/kg with an overall weighted average value of 1.07 g/kg.
Figure 9. Heat map of average methane (Ch4) emission factor, emission rate, and emission index) for each phase of the operating protocol for both hydronic heaters.
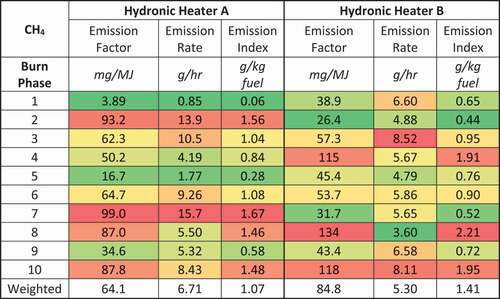
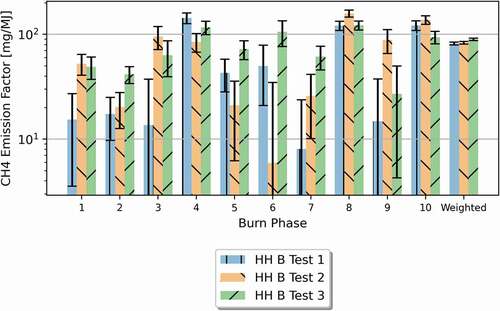
In general, the highest methane emissions for Appliance B were observed during the low load periods such as Phase 4 (25% output), Phase 8 (15% output), and Phase 10 (cyclic operation). The overall weighted average EF for Appliance B’s methane was 84.8 mg/MJ, with a range from 26.4 to 134 mg/MJ. The ER ranged between 3.60 g/hr and 8.52 g/hr and the overall weighted average value was 5.30 g/hr. The EI ranged between 0.44 g/kg and 2.21 g/kg and the overall weighted average value was 1.41 g/kg.
The maximum CH4 EF for HH A occurred during Phase 7 of Test 2, with a value of 221.9 mg/MJ. The minimum CH4 EF for HH A occurred during Phase 1, Test 1 with a value of 3.89 mg/MJ as shown in .
Figure 10. Bar chart showing the methane (Ch4) emission factor, in units of milligrams of CH4 per megajoule of energy output (mg/mj), calculated for each experiment during triplicate testing of Hydronic Heater A (HH A).
The maximum CH4 EF for HH B occurred during Phase 8 of Test 2 with a value of 158 mg/MJ. The lowest CH4 EFs were observed during Phase 6, the burn out period, of Test 2 as shown in . During Phase 8 the boiler is set to operate at or below 15% of its nominal output. As mentioned above, this particulate unit controls the output based on a primary damper and draft fan. At low load operations the HH closes its damper and slows the fan to reduce oxygen to slow combustion. This causes a smoldering period in which emissions are increased.
Figure 11. Bar chart showing the methane (Ch4) emission factor, in units of milligrams of CH4 per megajoule of energy output (mg/mj), calculated for each experiment during triplicate testing of Hydronic Heater B (HH B).
Additional information regarding the results and trends of HH A and B’s ER and EI for CH4 can be found in the SI document.
Black carbon
Appliance average black carbon (BC) EF, ER, and EI for each test section are given in for both appliances. These values were calculated by applying the measured BC concentration, discussed in a paper by Lindberg et al. (Citation2022) for each test phase, to the EF, ER, and EI, results found for PM.
Figure 12. Heat map of Appliance A and B average black carbon (BC) emission factor, emission rate, and emission index for each test phase of the operating protocol.
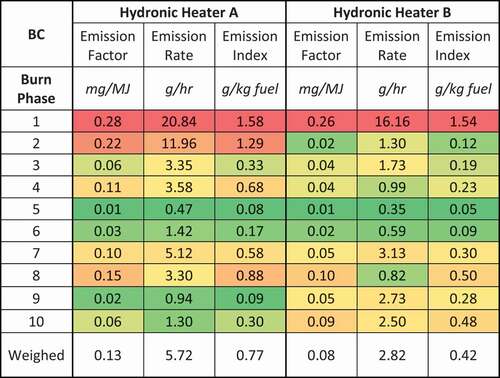
The entire test appliance average BC EFs for the two appliances is very similar, with values of 0.13 and 0.08 for Appliance A and B, respectively. The results for HH A were between 0.01 and 0.28 mg/MJ. The results for HH B were between 0.01 and 0.26 mg/MJ. The maximum BC EFs for both appliances occurred during Phase 1, the cold start. For HH B this value clearly stood out. For HH A the BC EF during Phase 2 was nearly as high during Phase 1. The minimum BC EF for both appliances occurred during Phase 5, the medium-high output test section. Notably for HH B, a local minimum also occurred during Phase 2, where HH A was operating with a relatively high BC EF.
Efficiency
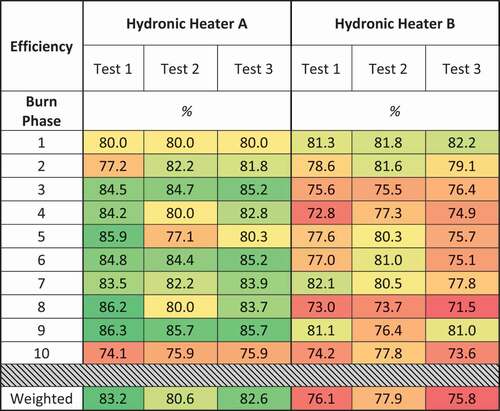
The average overall efficiency for all periods for HH A and HH B were 82.1% and 76.6%, respectively. The calculated efficiencies for each test and burn phase for both HHs is seen in and shown as a heat map for comparison purposes amongst the phases and appliances. The highest efficiencies for HH A were always observed during Burn Phase 9, the second full nominal load phase, while the lowest efficiencies were always achieved in the last phase, during cyclic operation. Appliance B observed its highest efficiencies for two of the tests during the first period (cold start) and one test during the reload period (Phase 7). The lowest efficiencies were found during low load operation phases, specifically Phase 8 for the second and third test and Phase 4 for the first test.
Figure 13. Heat map of Appliance A and B calculated efficiency for each phase of the operating protocol.
Discussion
A summary of the average annual emissions along with the COV from both HHs in shown in . Overall, HH A had a higher PM and CO EF, ER, and EI compared to HH B. However, HH B had a slightly higher CH4 EF, ER, and EI. The lower PM and CO emissions in HH B are likely due to the advanced combustion staging and use of gasification. Additionally, overall HH B, efficiencies were slightly lower than HH A. The COVs showed moderate variance for both appliances. HH A did show higher COVs values than HH B, despite the greater variance in burn rates for HH B discussed above. The higher emission COVs for HH A may be due to the catalyst operation and light off.
Table 5. Annual average emissions and efficiency from both hydronic heaters.
Comparison and relevance to certification tests
EPA’s wood fired HH requirements as of 2020 limit the emission output to 43.0 mg/MJ (0.10 lb/MMBtu), with an alternative limit of 64.5 mg/MJ (0.15 lb/MMBtu) if tested with cordwood. The weighted burn cycle PM EFs measured for HH A and B were nearly 6.5 and 1.5 times the cordwood test limit, respectively. Values for CO and CH4 were not reported for either unit in certification test reports at the time for comparison. Note that the integrated duty cycle test method discussed in this paper requires annual CO emissions (EF, ER, and EI) to be reported. The data reported here shows the emissions from each phase, rather than an integrated value over the entire test like tradition test methods. The results are significantly higher than would be measured with certification test methods, emphasizing the importance of capturing transient periods to better predict in-field performance.
As of 2020, the US EPA also states that residential wood heaters may only have a maximum ER of 18 g/hr for individual test runs, which is not met by Appliance A. When both appliances were tested for compliance to M28 WHH, both reported ERs of 1.04 g/hr, yet the ERs report here are 58 and 11 times greater for HH A and HH B, respectively. Additionally, when comparing the PM EFs presented here to those obtained during compliance testing, the emissions for HH A and HH B are 14 and 3 times greater, respectively. This difference in PM emissions performance alone when run to EPA’s MM28 WHH versus the field-like protocol used here illustrates the potential underestimate of actual in-field emissions.
Comparison of hydronic heater A and B
Particulate matter
The data shown earlier in indicates that the overall appliance average PM emission of HH A is approximately 4 times that of HH B across all three metrics. Considering the average values only, the range in EF for HH A was between 6.24 and 2994 mg/MJ with an overall weighted average value of 418.9 mg/MJ. Meanwhile for HH B the EF ranged between 17.7 and 505 mg/MJ and the overall weighted average value was 96.8 mg/MJ.
The highest EF was calculated for Burn Phase 1, the cold start portion of the test, for both appliances as discussed above. Appliance A’s EF during the cold start was 2994 mg/MJ, roughly 7 times the annual appliance average value. For Appliance B the cold start EF was 505 mg/MJ, which is approximately 5 times the appliance average value. These results indicate that the appliance average EF values are not representative of the EFs calculated during extreme high and low EF periods for HH A. Phase 1 (cold start) represents a transient test condition where only 10% of the fuel charge is combusted and over a relatively short duration (less than 20 minutes for both appliances), compared to the greater than six-hour overall test duration. Even so, despite the diminutive fuel charge and duration the PM EF during this period is so great that it significantly impacts the appliance average. Some likely causes for the high PM EFs during this period are cold firebox temperatures and high fuel moisture and volatile content. As the volatiles are driven off during the following phases, emissions tend to decrease. It follows that direct measurement of PM EFs in transient combustion conditions is necessary to describe the emissions from biomass combustion appliances and that any test method for biomass should include measurements during cold-start conditions.
Overall, the PM EF of HH A is greater than HH B as seen in It is also clearly evident in that in each experiment for both appliances Phase 1 has a significantly higher PM EF than that measured during the remainder of each experiment. For HH A, the PM EF is also elevated during burn Phase 2 of Test 1 relative to the other two tests of that HH. Consequently, the high PM EF in Test 1 leads to high variability in the PM EF during burn Phase 2 for HH A. In contrast, HH B has a smaller PM EF magnitude.
Figure 14. Bar chart comparing the PM EF (mg/mj) calculated for each experiment during triplicate testing for hydronic heating Appliances A and B.
Black carbon
RWC emissions are responsible for elevated concentrations of BC in ambient air during the wintertime across the globe (Briggs and Long Citation2016; Healy et al. Citation2017; Liu, Yan, and Zheng Citation2018; Mousavi et al. Citation2019; Rajesh and Ramachandran Citation2017). This is of particular concern due to effects of black carbon on human health and warming effect on the climate. PM and BC are co-emitted, as BC is a principal component of PM. As such, combustion conditions which generate high PM emissions likely also generate high concentrations of BC.
The highest BC EF, ER and EI’s for both appliances were observed during Phase 1, the cold start, with values falling as steady state was achieved (Phase 5) and once most of the fuel was consumed such as in the burn out (Phase 6) and combustion was considered more complete. During periods of incomplete combustion (Phase 1 or Phase 7) BC emissions increased. Details regarding BC emissions and measured concentrations from this study may be found in Part 3 by Lindberg et al. (Citation2022).
Carbon monoxide
From the data presented above, the overall appliance average CO emission of the two appliances is of the same order of magnitude. However, the appliance average CO EF for HH A was higher than for HH B. Additionally, the calculated CO EFs for HH A were also more variable, such that in some phases HH A produced less CO than HH B.
The highest CO EFs for both appliances occurred in Phase 10, the cyclic operation. The lowest CO EFs for both appliances occurred during different phases for the two appliances. The minimum CO EF for HH A occurred during Phase 1 (the cold start) with a value of 69.5 mg/MJ, however this value could be an anomaly caused by excess airflow into the appliance through the open door during the ignition step. The second lowest CO EF for HH A occurred during Phase 9 with a value of 547 mg/MJ, during a nominal 100% heat output test section. For HH B the lowest CO EF was found during the Phase 2 with a value of 1084, during the ramp-up portion of the test, when the HH is “firing hard” to ramp-up to its maximum output.
In comparison to the PM EF results, the CO EF results for the individual test sections were much closer to the overall appliance average values. However, high CO EF values were found during the Phase 10, the cyclic portion, for both appliances. One possible explanation for the coincident high CO is the forced rapid changes in heat output which are part of the cyclic test section. The lowest CO EFs were observed during burn phases where fuel loading occurred, and heat output was 100% of the appliances maximum rated output. Win et al. found CO emissions generally were greater in the burn out phase than during start-up phase, but were still significant in comparison to stationary operation (Bertrand et al. Citation2017). In this work we found burn out (Phase 6) CO EFs were of the same order of magnitude as start-ups (Phases 1, 2, and 7). This difference could be due to a variety of factors including appliance type and technology level, as well as the specific definition of burnout and start-up in terms of fuel mass consumption and duration.
Methane
Similar to the CO EF result, the HC EFs are of the same order of magnitude for both appliances. The HC EFs for HH B were slightly higher than for HH A. One possible explanation for this may be that HH B is a gasification unit and as the wood is gasified, CH4 is produced. This CH4 should be combusted in the next stage of combustion if combustion were complete. However, it is likely the gases were not fully combusted leading to higher CH4 emissions. The highest CH4 emissions were observed during Phase 10 (for both appliances) and during the reload for HH A (Phase 7) and Phase 3 or 8 for HH B. However, the range in the HC EF values was comparatively small relative to the calculated PM and CO EFs. Based on these findings, there is some indication that heat output condition and fuel loading may impact the variability of HC EFs in wood-fired HHs, but not greatly affect the HC EF magnitude. Given this conclusion, the appliance average HC EF is fairly representative of the overall appliance emissions for these devices even during transient combustion conditions.
Methane emission factors from wood combustion are currently not required as a reported value so information is scarce. However, methane emissions reported by The Climate Registry reports default CH4 emission factor values for wood boilers as 8.6 mg/MJ (9.3 g/MMBtu, as listed), significantly less than the values observed here (The Climate Registry Citation2020). EPA’s AP-42 provides emission factors and indices for both wood residue fired boilers (larger than the residential appliances discussed here) and residential wood stoves. The values reported for wood residue combustion in boilers is 9.02 mg/MJ, again significantly lower than the weighted average values found in this study (USEPA Citation2003). The emission indices given for stoves varies from 5.8 g/kg for catalytic wood stoves to 15 g/kg for conventional stoves, with no data on pellet stoves (United States Environmental Protection Agency Citation1996). These values however are higher than HHs studied in this paper with weighted averages of 1.07 and 1.41 g/kg for HH A and HH B, respectively, but the technology is different.
Comparison of emissions with literature data
Johansson et al. pointed out in 2004 that information on emission characteristics from residential biofuel HHs was scarce (Johansson et al. Citation2004), but yet after more than a decade, studies on cordwood fired HHs are still deficient. In contrast, there are numerous studies on automatic fed appliances such as pellet and chip HHs or stoves, cordwood fed stoves, and cookstoves. However, across all the studies, there exists a large amount of deviation amongst EFs from wood heaters in the literature, with a large source of that due to data collection methods. Nussbaumer et al. point out, dilution tunnel PM emission factors are significantly higher than those measured from a hot stack due to the addition of condensable PM (Nussbaumer, Klippel, and Johansson Citation2008). Therefore, the data presented in this report will only be compared to literature values measured from dilution tunnel (or similar dilution methods) and for log wood HHs, only.
Johansson et al. from their 2004 study focused on the performance of two old-type wood HHs, both with up-draft combustion, and two modern wood HHs with external thermal storage, both with down-draft but one with a flue gas fan to assist in combustion and the other with natural draft (Johansson et al. Citation2004). The HHs were operated either at 100% output or using small and large batches of cordwood and mostly fueled with dry wood (15% moisture content), except for a few studies that used 26 and 38% moisture content fuel. Measurements for their study began after the ignition of the second wood batch and lasted to the end of the burn-out of the third batch, ultimately missing the cold start period, therefore for comparison purposes, Phase 1 has been excluded.
Overall CO emissions ranged from 507 to 3781 mg/MJ for the modern wood HHs and from 4100 to 16,400 mg/MJ for the old-type wood HHs, compared to our values ranging from 546 to 10,279 mg/MJ to 1120 to 6422 mg/MJ for HH A and B, respectively for Periods 2 through 10. Excluding the cyclic period of our study, period 10, our reported values fall well within the range of their study. The reported CH4 emission values from their study range from 610 to 4800 mg/MJ for the old-type HH and 0.8 to 73 mg/MJ for the modern HH, indicating the significance of modern designs and combustion performance. Our measured values match much closer to those of the modern designs with ranges from 16.7 to 99.0 mg/MJ for HH A and 26.4 to 134 mg/MJ for HH B, again only considering Burn Phases 2 through 10. Lastly, PM emissions reported by Johansson et al. show values of 87 to 2200 mg/MJ and 18 to 89 mg/MJ for old-type and modern HHHs, respectively. Our values measured 6.24 to 615 mg/MJ and 19.0 to 166 mg/MJ for HH A and B, respectively. In general, their study found large differences in emissions based on HH type, with old-type wood HHs having more PM emissions than the modern HHs and emissions could be considerably decreased when a storage tank was connected (Johansson et al. Citation2004).
A study by Kinsey et al. in 2012 studied the four different residential wood HHs, three of which were cordwood fired, to determine the CO, total hydrocarbons (THC), CH4, and PM emissions (Kinsey et al. Citation2012). Appliance A was a single stage updraft unit, Appliance B was an improved version of A and was downdraft, while Appliance D was the most modern with two-stages, downdraft, gasification, and an external thermal storage tank. Each HH was fired with red oak in a higher moisture range than our study (27–38% moisture content) and was tested to a simulated heat demand for a 232 m2 home in Albany, NY, as described by Butcher and Trojanowski (Butcher and Trojanowski Citation2020).
As indicated by their data, there was a wide range of PM emissions depending on both appliance and fuel type (Kinsey et al. Citation2012). For Appliance A, the PM emissions index varied between approximately 25 g/kg to 47 g/kg dry fuel with the emissions from red oak. The PM emissions index almost doubled when unseasoned white pine was burned in the same unit. However, emissions were much lower for Appliances B and D, with values of 4.6 and 3.3 g/kg, respectively. The authors attributed the lower PM emissions from Appliance B and D to the more advanced technologies and generally higher combustion efficiencies compared to the older Appliance A design. Specifically, Appliance B employed a secondary combustion chamber and larger thermal mass while Appliance D had two stage combustion with gasification and an external thermal storage unit that allowed batches of fuel to be burned during short, highly intensive, presumably more efficient, periods and the extracted heat is stored for later use.
CO and THC emissions reported by Kinsey et al. (Citation2012) were much higher, but matched well with burn period 10, the cyclic load operation in our study. Their study reported CO EI values of 190, 125, and 140 g/kg for Appliances A, B, and D respectively, while our weighted average values were 42.0 and 38.2 g/kg for HH A and B, respectively. However, the cyclic load period values for our study were 173 and 106 g/kg for HH A and B, respectively. Kinsey et al. report that the high CO emission factors were due to the opening and closing of the damper which alternated between flaming and smoldering conditions – matching similar patterns observed during the cyclic pattern of our study. The THC values were reported 54, 15, and 12 g/kg for Appliances A, B, and D respectively, and the CH4 emissions accounted for 4% of the THC, making the values closer to 2.16, 0.6, and 0.48 g/kg for Appliances A, B, and D, respectively. Our reported CH4 weighted values were 1.07 and 1.41 g/kg for HH A and B, respectively.
Another study from Bruns et al. (Citation2015) in 2015 is in good agreement with the data presented here in terms of the measured primary CO and CH4 gas-phase and PM emissions. CO emission factors reported from their study ranged from 31.65 ± 0.08 to 64.96 ± 0.05 g/kg while values in the current work for flaming conditions only (excluding the weighted average, cold start, burn out, and cyclic periods) ranged from 9.17 to 51.1 g/kg and 18.1 to 46.2 g/kg for our HH A and B, respectively. The authors measured CH4 ranged from 2.368 ± 0.001 to 4.717 ± 0.003 g/kg, whereas our measurements (for flaming conditions only) ranged from 0.28 to 1.67 g/kg and 0.44 to 2.21 g/kg for HH A and B, respectively. The measured PM emission indices from the study range from 0.81 ± 0.02 to 0.260 ± 0.005 g/kg compared to our 0.15 to 8.13 g/kg for HH A and 0.23 to 2.03 g/kg for HH B in flaming conditions only, creating a larger range than the compared study.
As the authors specifically mention, not only does burn variability affect EFs and their variability amongst literature, but so does the measurement method. They used a modern burner, beech wood with a lower moisture content of 10 ± 2%, and only studied the effect of average and high load (more fuel). They also used fire starters made of wood shavings, paraffin and natural resin and much smaller fuel loads which can significantly affect the light-off of the fuel, but they only sampled during the flaming phase, avoiding any transient and cold start phases and the reason we have excluded some periods for comparison purposes.
Recommendations for future research and test method development
User practices, along with combustion technology, can have a significant impact on appliance performance. Vicente et al. found that log size affected emissions more than batch size (Bruns et al. Citation2015), however batch size still remains important because of oversizing and output estimates. As pointed out by Kindbom et al. moist fuel, overloading by 150% or more, and poor maintenance generally increases emissions, while smaller log sizes, upright arrangement of the fuel, and top-down ignition practices decrease the emissions – perhaps all of which should be studied in detail or included in future test methods for a better emissions inventory of real-world practices (Kindbom et al. Citation2017).
Beyond the impact on health, and from not only a national perspective but global environmental perspective as well, understanding the impact of greenhouse gas (GHG) emissions from RWC, specifically due to CH4 is important as pointed out in the study by Johansson et al. Their study explicitly showed how an old-type wood HH may have more than twice as high an impact on climate change as an oil HH, because of high CH4 emissions (Johansson et al. Citation2004). Robinson indicated in their study that CH4 emissions from a stove in a living room had a weighted average of 1.3 tonnes of CO2-eq, similar to that of CO2 emissions from heating an entire home (160 m2) with natural gas, ultimately showing wood heating could cause more than 10 times as much global warmings as gas or reverse cycle air-conditioning (Robinson Citation2011). Andreae also indicated the need for improved accuracy in activity estimates, especially for biofuel use – trace gases (methane) (Andreae Citation2019).
Lastly, Kindbom et al. also discuss the variability amongst laboratory tests, even when repeating the “same” measurement methodology, and the importance of considering this when developing EFs (Kindbom et al. Citation2017). The variation in their study showed ranges of ±5% to as much as 70%. Similarly, Bruns et al. found significant variability among their study with no obvious reason, indicating the real-world variability of wood combustion emissions in HHs (Bruns et al. Citation2015). The average weighted PM EF COV as presented above for Appliance A and Appliance B, was 30% and 13%, respectively, indicating the large variability associated with laboratory tests, even when run by the same operator to the same protocol.
When comparing phases within the varied load profile test data presented here to the load profiles to the M28 WHH test method (such as Phase 4 of the method discussed within compared to M28 WHH Category II), emission output factors were slightly greater for both HHs. This may be owed to differences in HH temperatures as the unit changes between phases, smaller coal beds, fuel species and type, and shorter phase operation times. However, short periods with high emissions have significant impacts on health and the environment and cannot be ignored. This is evident in Phase 1, start-up, which in both cases contributed the most PM and had the greatest EFs but were the shortest period of time. The data presented in this paper only provides information on PM and primary gaseous emission factors as indicated by concentrations, leaving a large gap regarding the potential health effects associated with the type of particles. It is well understood poor combustion practices lead to higher concentrations of organics and condensable PM while complete combustion produces more inorganic particles such as salts, with a lower cytotoxicity (Kocbach Bølling et al. Citation2009). Perhaps reporting particle type (inorganic vs organic) should also be considered for regulatory purposes.
With all of these findings, the authors leave the readers with some recommendations to consider for future work:
Test methods that are more representative of real-life performance that include the impact of fuel quality such as larger, wet fuel pieces and multiple burn phases including start-up and cyclic periods.
Running multiple tests for emission data. This point may increase the amount of capital and time needed for testing, but it may also provide better quality data as current data indicates high variability.
Dilution methods for sampling to provide better and more complete emission inventory data for better predictive cases in modeling and policy driven incentives or decisions.
Reporting CH4 and BC emissions to better understand the impact wood-burning has on our climate budget. Specifically, CH4 emissions reported in EPA’s AP-42 for an oil-fired residential furnace are 5.54 mg/MJ; roughly a third of the lowest average methane emission factor observed in these tests (United States Environmental Protection Agency Citation2010).
Conclusion
In this study the effect of heat demand and fuel loading and their impact on emissions from wood-fired HHs was investigated by testing two such appliances using an integrated-duty cycle test method. This test method included transient operating conditions, such as cold and hot-starts (ignition) and modulation between different heat output states at various rates. These are conditions that a HH will regularly operate in when installed at a home and are not included in current steady-state certification tests.
Annual appliance average emission factors determined for HH A and HH B were 419 and 96.8 mg/MJ, respectively when run to the protocol described here. These measured values for Appliance A and B were nearly 6.5 and 1.5 times higher than current 2020 certification limits for appliances tested with cordwood, respectively. Further, the measured PM emission factors were 14 and 3 times greater than the reported emission values achieved when operating HH A and HH B, respectively during M28 WHH. The annual PM emission rates and indices for HH A were 60.1 g/hr and 5.61 g/kg fuel, respectively. PM emission rates and indices for HH B were 11.5 g/hr and 1.28 g/kg fuel, respectively.
Results from the study showed that transient operating conditions produce emissions at different rates than during typical operation. Specifically, 1) Cold starts during Phase 1 had elevated PM EFs for both appliances; in the case of HH A the average value for this period over three tests was nearly 3000 mg/MJ, these emissions were 7X the weighted average value for the test method; 2) During Phase 10, the cyclic portion, where heat demand was modulated (on for 5 minutes, off for 10) CO EFs were measured above >5000 mg/MJ for both appliances, which was more than 2.5X greater than the appliance averages. It follows that the appliance average PM EF and CO EF were greatly affected by the high emissions during these transient periods. In contrast, HC EFs were relatively stable throughout all burn phases. These findings demonstrate that wood-fired HH emissions during transient operating conditions can be significantly greater than emissions during steady-state test conditions, such as those used in typical certification tests. Additionally, these short transient periods with high emissions can have significant impacts on health and the environment.
The COV was also determined after triplicate testing and yielded favorable results; 3–4% variation in burn rate, 13–30% variation in the PM EF, and 1–2% variation in the efficiency. The results presented here show the use of integrated duty-cycle test protocols that capture cold-starts and reloading are better for representing in-use operations of wood-fired HHs and provide a mechanism for more realistic emissions and delivered efficiency measurements. Additionally, the results are reproducible with the ability to perform a test in one day.
SUPPORTING_INFORMATION_20211008.docx
Download MS Word (195.3 KB)Acknowledgment
The authors would like to thank Dr. Ellen Burkhard the project manager for her guidance and support. In addition, the authors would like to thank George Allen and Lisa Rector at Northeast States for Coordinated Air Use Management (NESCAUM) for their work in developing the test method and for technical support. The authors would also like to thank the NY State Department of Health (NYSDOH) and the NY State Department of Environmental Conservation (NYSDEC) for loaning equipment and technical support and Dr. William B. Smith at the State University of NY college of Environmental Science and Forestry (SUNY ESF) for assistance in fuel preparation.
Data availability statement
The data that support the findings of this study are available from the corresponding author, R. Trojanowski, upon reasonable request.
Disclosure statement
No potential conflict of interest was reported by the author(s).
Supplementary material
Supplemental data for this paper can be accessed on the publisher’s website.
Additional information
Funding
Notes on contributors
Rebecca Trojanowski
Rebecca Trojanowski is an engineer within the Energy Conversion group at Brookhaven National Laboratory. Her interests focus on research and development efforts to advance building energy systems, reduce fossil fuel dependency, and technical solutions to reduce combustion related emissions. She has focused much of her career on biomass combustion and the related emissions after graduating from Worcester Polytechnic Institute and while continuing to pursue her PhD at Columbia University.
Jake Lindberg
Jake Lindberg is a recent doctoral graduate from the Chemical and Molecular Engineering Department at Stony Brook University. His primary research areas are renewable energy generation and combustion particulate analysis. In specific he is interested in the intersection of these two areas, namely: production and use of renewable fuels (such as renewable natural gas, hydrogen and blended hydrogen fuels, and liquid biofuel products such as biodiesel and ethanol fuels and fuel blends) and the investigation of the particulate and gaseous emissions created as a byproduct of renewable fuel combustion.
Thomas Butcher
Thomas Butcher received his Ph.D. from the State University of New York at Stony Brook in 1987. He is a Research Engineer at the Senior Scientist level and Head of the Energy Conversion Group at Brookhaven National Laboratory in Upton, NY. Thomas Butcher researches solutions to achieve reduced fossil fuel use in residential and commercial building energy applications. His focus is on biofuel end use, combustion efficiency and emissions, and new system concepts. He conducts research into applications of biofuels and alternative fuels, efficiency in heating/cooling equipment, advanced oil burner development and particulate emissions for wood boilers.
Vasilis Fthenakis
Vasilis Fthenakis is world-known for his research at the interface of energy, water and the environment. He has a Diploma in Chemistry from the National University of Athens, MS in Chemical Engineering from Columbia University, and PhD in Fluid Dynamics and Atmospheric Science from New York University. Dr. Fthenakis is the Founding Director of the Center for Life Cycle Analysis and professor of Earth and Environmental Engineering at Columbia University, and a Distinguished Scientist Emeritus at Brookhaven National Laboratory (BNL). He is the author of two books, editor of four books, and author of about 400 articles that have been cited more than 130,000 times; h-index=56. His current research focus is on the nexus of renewable energy, water, and the environment. He is the receiver of several awards and distinctions from the US-Department of Energy (DOE), BNL, National Renewable Energy Laboratory (NREL), IEEE. He is the recipient of the 2018 IEEE William Cherry Award “for his pioneering research at the interface of energy and the environment that catalyzed photovoltaic technology advancement and deployment world-wide”, elected a Fellow of the Institute of Electrical and Electronic Engineers (IEEE) in 2021 for “contributions to photovoltaics technology” and has been a Fellow of the American Institute of Chemical Engineers (AIChE) since 2002 “in recognition and appreciation of superior attainments, valuable contributions, and service to Chemical Engineering” His current research focuses on solar water desalination, solar hydrogen, renewable energy systems integration, and life cycle analysis. He is editor-in-chief of Energies-environmental section, associate editor of Progress in Energy and serves in the Editorial Boards of Energy Technology, Progress in Photovoltaics, and Journal of Loss Prevention. Early on in his career, he served as a safety and environmental consultant for major oil and chemical companies, and as an expert on investigating major chemical accidents in the U.S.
References
- Ahmadi, M., G. Allen, B. Morin, and L. Rector. 2020. Interim report: Development of an integrated duty-cycle test method for cordwood stoves. NYSERDA Report 21-02. Albany: NYSERDA.
- Ahmadi, M., J. Minot, G. Allen, and L. Rector. 2020. Investigation of real-life operating patterns of wood-burning appliances using stack temperature data. J. Air Waste Manage. Assoc. 70 (4):393–409. doi:10.1080/10962247.2020.1726838.
- Allen, G., and L. Rector. 2020. Characterization of residential Woodsmoke PM2.5 in the Adirondacks of New York. Aerosol Air Qual. Res. 20:2419–32. doi:10.4209/aaqr.2020.01.0005.
- Andreae, M. O. 2019. Emission of trace gases and aerosols from biomass burning – an updated assessment. Atmos. Chem. 19 (13):8523–46. doi:10.5194/acp-19-8523-2019.
- ASTM International. 2010. E2779-10 standard test method for determining particulate matter emissions from Pellet Heaters. West Conshohocken, PA: ASTM International.
- Bertrand, A., G. Stefenelli, E. A. Bruns, S. M. Pieber, B. Temime-Roussel, J. G. Slowik, A. S. H. Prévôt, H. Wortham, I. El Haddad, N. Marchand. 2017. Primary emissions and secondary aerosol production potential from woodstoves for residential heating: Influence of the stove technology and combustion efficiency. Atmos. Environ. 169:65–79. doi:10.1016/j.atmosenv.2017.09.005.
- Briggs, N. J., and C. M. Long. 2016. Critical review of black carbon and elemental carbon source apportionment in Europe and United States. Atmos. Environ. 144:409–27.doi:10.1016/j.atmosenv.2016.09.002.
- Brookhaven National Laboratory. 2018. A test method for certification of cord wood-fired hydronic heating appliances based on a load profile: Measurement of Particulate Matter (PM) and Carbon Monoxide (CO) emissions and heating efficiency of wood-fired hydronic heating appliances. Boston: Northeast States for Coordinated Air Use Management.
- Bruns, E. A., M. Krapf, J. Orasche, Y. Huang, R. Zimmermann, L. Drinovec, G. Močnik, I. El-Haddad, J. G. Slowik, J. Dommen, et al. 2015. Characterization of primary and secondary wood combustion products generated under different burner loads. Atmos. Chem. Phys. 15(5):2825–41. doi:10.5194/acp-15-2825-2015.
- Burnet, P. G., N. G. Edmisten, P. E. Tiegs, J. E. Houck, and R. A. Yoder. 1986. Particulate, carbon monoxide, and acid emission factors for residential wood burning stoves. J. Air Pollut. Control Assoc. 36:1012–18. doi:10.1080/00022470.1986.10466139.
- Butcher, T., and N. Russell. 2011. Review of EPA Method 28 Outdoor Wood Hydronic Heater Test Results. Albany: NYSERDA.
- Butcher, T. A., and R. Trojanowski. 2020. Effect of Thermal Storage on the Emissions and Efficiency Performance of a Wood Pellet-fired Residential Boiler. ACS Omega 5 (44):28517–28. doi:10.1021/acsomega.0c03080.
- Calvo, A. I., L. A. C. Tarelho, C. A. Alves, M. Duarte, and T. Nunes. 2014. Characterization of operating conditions of two residential wood combustion appliances. Fuel Process. Technol. 126:222–32. doi:10.1016/j.fuproc.2014.05.001.
- Canadian Standards Association. 2010. Performance testing of solid-fuel-burning heating appliances. Ontario: Canadian Standards Association.
- The Climate Registry. 2020. 2020 default emission factors. https://www.theclimateregistry.org/wp-content/uploads/2020/04/The-Climate-Registry-2020-Default-Emission-Factor-Document.pdf.
- Garcia-Maraver, A., M. Zamorano, U. Fernandes, M. Rabaçal, and M. Costa. 2014. Relationship between fuel quality and gaseous and particulate matter emissions in a domestic pellet-fired boiler. Fuel 119 (1):141–52. doi:10.1016/j.fuel.2013.11.037.
- Gibbs, R., and T. Butcher. 2010. Staged combustion biomass boilers: Linking high-efficiency combustion technology to regulatory test methods. Albany: New York State Energy Research and Development Authority (NYSERDA).
- Goncalves, C., C. Alves, A. P. Fernandes, C. Monteiro, L. Tarelho, M. Evtyugina, C. Pio. 2011. Organic compounds in PM2.5 emitted from fireplace and woodstove combustion of typical Portuguese wood species. Atmos. Environ. 45(27):4533–45. doi:10.1016/j.atmosenv.2011.05.071.
- Healy, R. M., U. Sofowote, Y. Su, J. Debosz, M. Noble, C. -H. Jeong, J.M. Wang, N. Hilker, G. J. Evans, G. Doerksen. 2017. Ambient measurements and source apportionment of fossil fuel and biomass burning black carbon in Ontario. Atmos. Environ. 161:34–47. doi:10.1016/j.atmosenv.2017.04.034.
- Jalava, P. I., M. S. Happo, J. Kelz, T. Brunner, P. Hakulinen, J. Mäki-Paakkanen, A. Hukkanen, J. Jokiniemi, I. Obernberger, M. -R. Hirvonen. 2012. In vitro toxicological characterization of particulate emissions from residential biomass heating systems based on old and new technologies. Atmos. Environ. 50:24–35. doi:10.1016/j.atmosenv.2012.01.009.
- Johansson, L. S., B. Leckner, L. Gustavsson, D. Cooper, C. Tullin, and A. Potter. 2004. Emission characteristics of modern and old-type residential boilers fired with wood logs and wood pellets. Atmos. Environ. 38 (25):4183–95.
- Johansson, L. S., C. Tullin, B. Leckner, and P. Sjövall. 2003. Particle emissions from biomass combustion in small combustors. Biomass Bioenergy 25 (4):435–46.
- Kaivosoja, T., P. I. Jalava, H. Lamberg, A. Virén, M. Tapanainen, T. Torvela, U. Tapper, O. Sippula, J. Tissari, R. Hillamo, et al. 2013. Comparison of emissions and toxicological properties of fine particles from wood and oil boilers in small (20–25 kW) and medium (5–10 MW) scale. Atmos. Environ. 77:193–201.
- Kindbom, K., I. Mawdsley, O. -K. Nielsen, K. Saarinen, K. Jónsson, and K. Aasestad. 2017. Emission factors for SLCP emissions from residential wood combustion in the Nordic countries. Denmark: Nordic Council of Ministers.
- Kinsey, J. S., A. Touati, T. L. B. Yelverton, J. Aurell,S. -H. Cho, W. P. Linak, and B. K. Gullett. 2012. Emissions characterization of residential wood-fired hydronic heater technologies. Atmos. Environ. 63:239–49.
- Kistler, M., C. Schmidl, E. Padouvas, H. Giebl, J. Lohninger, R. Ellinger, H. Bauer, and H. Puxbaum. 2012. Odor, gaseous and PM10 emissions from small scale combustion of wood types indigenous to Central Europe. Atmos. Environ. 51:86–93.
- Klauser, F., E. Carlon, M. Kistler, C. Schmidl, M. Schwabl, R. Sturmlechner, W. Haslinger, and A. Kasper-Giebl. 2018. Emission characterization of modern wood stoves under real-life oriented operating conditions. Atmos. Environ. 192: 257-26.
- Kocbach Bølling, A., J. Pagels, K. E Yttri, L. Barregard, G. Sallsten,P. E. Schwarze, and C. Boman. 2009. Health effects of residential wood smoke particles: The importance of combustion conditions and physicochemical particle properties. Part Fibre Toxicol 6(29).
- Kodros, J. K., E. Carter, M. Brauer, J. Volckens, K. R. Bilsback, C.L&apos, C. L'Orange, M. Johnson, and J. R. Pierce. 2018. Quantifying the Contribution to Unvertainity in Mortality Attributed to Household, Ambient, and Joint Exposure to PM2.5 from Residential Solid Fuel Use. GeoHealth 2:25–39.
- Koraïem, M., and D. Assanis. 2021. Wood Stove Combustion Modeling and Simulation: Technical Review and Recommendations. Int. Commun. Heat Mass Transfer. 127: 105423.
- Lamberg, H., K. Nuutinen, J. Tissari, J. Ruusunen, P. Yli-Pirilä, O. Sippula, M. Tapanainen, P. Jalava, U. Makkonen K., Teinilä, et al. 2011. Physicochemical characterization of fine particles from small-scale wood combustion. Atmos. Environ. 45 (40):7635–43.
- Leskinen, J., J. Tissari, O. Uski, A. Virén, T. Torvela, T. Kaivosoja, H. Lamberg, I. Nuutinen, T. Kettunen, J. Joutsensaari, et al. 2014. Fine particle emissions in three different combustion conditions of a wood chip-fired appliance - Particulate physicochemical properties and induced cell death. Atmos. Environ. 86:129–39.
- Lindberg, J., M. Wurth, B. P. Frank, S. Tang, G. La Duke, R. Trojanowski, T. Butcher, and D. Mahajan. 2022. Realistic operation of two residential cordwood fired appliances; part 2: Particle number and size. J. Air Waste Manag. Assoc.
- Lindberg, J., R. Trojanowski, M. Wurth, S. Tang, G. La Duke, B. P. Frank, T. Butcher, and D. Mahajan. 2022. Realistic operation of two residential cordwood fired appliances; part 3: Black and brown carbon emissions. J. Air Waste Manag. Assoc.
- Liu, Y., C. Yan, and M. Zheng. 2018. Source apportionment of black carbon during winter in Beijing. Sci. Total Environ. 618:531–41.
- Morin, B., A. Marin, L. Rector, M. Ahmadi, and G. Allen. 2022. Impacts of wood specieis and moisture content of emissions from residential wood heaters. J. Air Waste Manag. Assoc.
- Mousavi, A., M. H. Sowlat, C. Lovett, M. Rauber, S. Szidar, R. Bof, A. Borgini, C. De Marco, A. A. Ruprecht, and C. Sioutas. 2019. Source apportionment of black carbon (BC) from fossil fuel and biomass burning in metropolitan Milan, Italy. Atmos. Environ. 252–61.
- Noonan, C. W., T. J. Ward, and E. O. Semmens. 2015. Estimating the Number of Vulnerable People in the United States Exposed to Residential Wood Smoke. Environ. Health Perspect. A30–A31.
- Nussbaumer, T. 2008. Biomass combustion in Europe: Overview on technologies and regulations : Final report. Albany: New York State Energy Research and Development Authority (NYSERDA).
- Nussbaumer, T., N. Klippel, and L. Johansson. 2008. Survey on measurement and emission factors on particulate matter from biomass combustion in IEA countries. In 16th European Biomass Conference and Exhibition. Valencia.
- Nuutinen, K., J. Jokiniemi, O. Sippula, H. Lamberg, J. Sutinen, P.Horttanainen, and J. Tissari. 2014. Effect of air staging on fine particle, dust and gaseous emissions from masonry heaters. Biomass Bioenergy 67:167–78.
- Orasche, J., T. Seidel, H. Hartmann, J. Schnelle-Kreis, J. C. Chow, H. Ruppert, and R. Zimmermann. 2012. Comparison of emissions from wood combustion. Part 1: Emission factors and characteristics from different small-scale residentialheating appliances considering Particulate matter and Polycyclic Aromatic Hydrocarbon (PAH)-related toxicological potential of particle-bound organic species. Energy Fuel 26:6695–704.
- Orr, G., T. Lelyveld, and S. Burton. 2009. Insitu monitoring of efficiencies of condensing boilers and use of secondary heating. Cheltenham: GASTEC.
- Ozgen, S., S. Becagli, V. Bernardoni, S Caserini, D. Caruso, L. Corbella. 2017. Analysis of the chemical composition of ultrafine particles from two domestic solid biomass fired room heaters under simulated real-world use. Atmos. Environ. 150:87–97.
- Ozgen, S., S. Becagli, V. Bernardoni, S Caserini, D. Caruso, L. Corbella. 2017. Analysis of the chemical composition of ultrafine particles from two domestic solid biomass fired room heaters under simulated real-world use. Atmos. Environ. 150:87–97.
- Penn, S. L., S. Arunachalam, M. Woody, W. Heiger-Bernays, Y. Tripodis, and J. I. Levy. 2017. Estimating State-Specific Contributions to PM2.5- and O3-Related Health Burden from Residential Combustion and Electricity Generating Unit Emissions in the United States. Environ. Health Perspect. 324–32.
- Rajesh, T. A., and S. Ramachandran. 2017. Characteristics and source apportionment of black carbon aerosols over an urban site. Environ. Sci. Pollut. Res. 24 (9):8411–24.
- Rector, L., M. Ahmadi, A. Marin, B. Morin, and K. Raymond. 2021. Assessment of EPA’s Residential Wood Heater Certification Program. Boston: Northeast States for Coordinated Air Use Management (NESCAUM).
- Reichert, G., C. Schmidl, W. Haslinger, H. Stressler, R. Sturmlechner, M. Schwabl, and C. Hochenauer. 2018. Novel Method Evaluating Real-Life Performance of Firewood Roomheaters in Europe. Energy Fuel 32 (2):1874–83.
- Reichert, G., R. Sturmlechner, H. Stressler, M. Schwabl, C. Schmidl, H. Oehler, R. Mack, and H. Hartmann. 2016. Definition of Suitable Measurement Methods and Advanced Type Testing Procedure for Real Life Conditions. Austria: Bioenergy 2020+.
- Robinson, D. L. 2011. Australian wood heaters currently increase global warming and health costs. Atmos Pollut Res 2 (3):267–74.
- Rogalsky, D. K., P. Mendola, T. A. Metts, and W. J. Martin II. 2014. Estimating the Number of Low-Income Americans Exposed to Household Air Pollution from Burning Solid Fuels. Environ. Health Perspect. 122 (8):806–10.
- Saxena, R. C., D. K. Adhikari, and H. B. Goyal. 2009. Biomass-Based energy fuel through biochemical routes: A review. Renewable Sustainable Energy Rev. 13:167–78.
- Schmidl, C., M. Luisser, E. Padouvas, L. Lasselsberger, M. Rzaca, C. Ramirez-Santa Cruz, M. Handler, G. Peng, H. Bauer, and H. Puxbaum. 2011. Particulate and gaseous emissions from manually and automatically fired small scale combustion systems. Atmos. Environ. 45:7443–54.
- Shen, G., M. Xue, Y. Chen, C. Yang, W. Li, H. Shen, andY. Huang. 2014. Comparison of carbonaeous particulate matter emission factors among different solid fuels burned in residential stoves. Atmos. Environ. 89:337–45.
- Shen, G., M. Xue, S. Wei, Y. Chen, Q. Zhao, B. Li,H. Wu, and S. Tao. 2013. Influence of fuel moisture, charge size, feeding rate and air ventiliation conditions on the emissions of PM, OC, EC, parent PAHs, and their derivatives from residential wood combustion. J. Environ. Sci. 25 (9):1808–16.
- Siegenthaler, J. 2017. Hydronics for High Efficiency Biomass Boilers. NYSERDA.
- Sippula, O., K. Hytönen, J. Tissari, T. Raunemaa, and J. Jokiniemi. 2007. Effect of Wood Fuel on the Emissions from a Top-Feed Pellet Stove. Energy Fuel 21 (2):1151–60.
- Smith, W. B. 2014. Evaluation of wood fuel moisture measurement accuracy for cordwood-fired advanced hydronic heaters. Albany: NYSERDA.
- Torvela, T., J. Tissari, O. Sippula, T. Kaivosoja, J. Leskinen, A. Viren, A. Lahde, and J. Jokiniemi. 2014. Effect of wood combustion on the morphology of freshly emitted fine particles. Atmos. Environ. 87:65–76.
- Trojanowski, R., T. Butcher, W. George, and Y. Celebi. 2019. Performance of a Biomass Boiler in a Load Profile Test. United States: OSTI.
- United States Environmental Protection Agency. 1996. 5TH EDITION AP-42 Section 1.10 Residential Wood Stoves. United States EPA.
- United States Environmental Protection Agency. 2010. AP 42, Fifth Edition, Volume I Chapter 1: External Combustion Sources.
- United States Environmental Protection Agency. 2019. Method 28 WHH for Measurement of Particulate Emissions and Heating Efficiency of Wood-Fired Hydronic Heating Appliances.
- United States Environmental Protection Agency. 2021. Air Emissions Inventories. 2017 National Emissions Inventory (NEI) Data. United States Environmental Protection Agency.
- U.S. Energy Information Administration. 2014 . Today in Energy- Increase in wood as main source of household heating most notable in the Northeast. March 17. https://www.eia.gov/todayinenergy/detail.php?id=15431.
- U.S. Energy Information Administration. 2021. Biomass Explained–Wood and wood waste. May 11. https://www.eia.gov/energyexplained/biomass/wood-and-wood-waste.php.
- US EPA Office of Air Quality Planning and Standards (OAQPS). 2016. Process for Developing Improved Cordwood Test Methods for Wood Heaters. US EPA.
- USEPA. 2003. Compilation of air pollutant emission factors, AP-42, 5th Ed., Vol.1,Section 1.6 - Wood residue combustion in boilers. USEPA.
- Vicente, E. D., M. A. Duarte, A. I. Calvo, T. F. Nunes, L. Tarelho, and C. A. Alves. 2015. Emission of carbon monoxide, total hydrocarbons and particulate matter during wood combustion in a stove operating under distinct conditions. Fuel Process. Technol. 131:182–92.
- Vicente, E. D., M.A. Duarte, L. A. C. Tarelho, T. F. Nunes, F. Amato, X. Querol,C. Colombi, V. Gianelle, and C. A. Alves. 2015. Particulate and gaseous emissions from the combustion of different biofuels in a pellet stove. Atmos. Environ. 120:15–27.
- Win, K. M., T. Persson, and C. Bales. 2012. Particles and gaseous emissions from realistic operation of residential wood pellet heating systems. Atmos. Environ. 59:320–27.