
 ?Mathematical formulae have been encoded as MathML and are displayed in this HTML version using MathJax in order to improve their display. Uncheck the box to turn MathJax off. This feature requires Javascript. Click on a formula to zoom.
ABSTRACT
Advanced dispersion models such as AERMOD specifically address the portion of a plume emitted in convective conditions that is sufficiently buoyant to rise into the stable layer above the elevated inversion. This portion of the plume mass is often referred to as the “penetrated plume” because that plume component breaks through the elevated inversion and penetrates into the stable layer aloft. A premature mixing of the penetrated plume to the ground has been identified in the current formulation of AERMOD, which is the U.S. EPA-preferred short-range dispersion model and used in several other countries. This behavior has been observed based on data from field studies where the model is found to overpredict ground-level concentration events due to the penetrated plume component, with the timing of these peak predictions too early in the day. A proposed update to AERMOD to address the penetrated plume issue (referred to as “HBP” for modifications particularly important for “highly buoyant plume”) is documented and evaluated in this manuscript. The revised approach involves a check on the convective mixing height for the current hour as well as the next hour to determine how much of the penetrated plume has been captured by the convective boundary layer by the end of the current hour. The amount of the penetrated plume mass that is allowed to mix to the ground in the HBP modifications depends upon the result of this calculation. The HBP modification has been evaluated as an update to AERMOD for three databases along with a sensitivity analysis of the effects of the HBP changes on a variety of stack heights and buoyancy fluxes. The findings of the evaluation indicate that the HBP changes to AERMOD result in reduced overprediction tendencies.
Implications: A proposed enhancement to AERMOD to address a premature mixing of penetrated plume material to the ground has been performed by implemented and evaluated by the authors. The enhancement, referred to as the highly buoyant plume (HBP) is based on work developed by Jeffrey Weil. HBP is designed to better characterize the penetrated plume behavior in the model such that it aligns more closely with observations based on data from field studies.
Introduction
The AERMOD dispersion model (Cimorelli et al. Citation2005), recommended by United States Environmental Protection Agency (U.S. EPA) for general short-range modeling applications out to a distance of 50 km, is widely used in air quality permit and compliance applications in many countries (Environmental Protection Agency (EPA) of Victoria Citation2013; Ministry of the Environment, Conservation and Parks (MECP) Citation2020). This model has been tested and evaluated against a large number of traditional stack release databases, including the 18 publicly available databases on EPA’s Support Center for Regulatory Atmospheric Modeling (SCRAM) website (Environmental Protection Agency Citation2021a).
In convective conditions, AERMOD has a three-plume treatment for stack emissions: direct, indirect, and penetrated components. For any given hour, the plume mass can be divided into as many as all three of these plume types. As shown in , the direct and indirect plume components remain within the convective mixed layer, which features vigorous vertical mixing above the surface layer (the lowest ~10% of the mixed layer). The penetrated plume component is the portion of the plume that is sufficiently buoyant to break through the elevated inversion into the stable layer aloft. In this stable layer, the vertical turbulence is much lower (typically less than half) than it is in the convective mixed layer, and the penetrated plume is observed to remain in that layer until late morning/early afternoon when the convective mixing height rises to intercept the plume due to diurnal heating.
Figure 1. Schematic of AERMOD’s three-plume treatment in convective conditions.
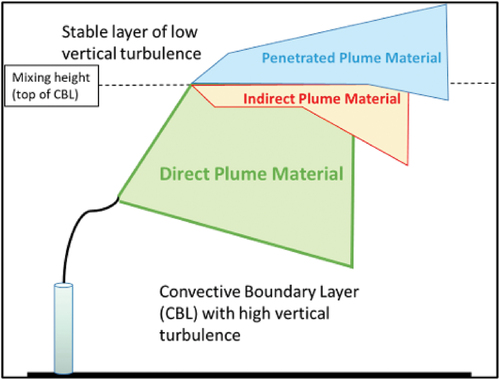
The current AERMOD formulation (version 21112 and previous versions) treats the dynamics of the penetrated plume in a conservative manner. In certain cases, AERMOD simulates a penetrated plume as mixing into the convective layer and assumes the total plume mixes to the ground within the hour, well before the convective mixed layer rises to the plume level. An alternative approach, presented in this manuscript, provides a more realistic treatment of the penetrated plume.
Behavior of the penetrated plume
Weil, Corio, and Brower (Citation1997) note that the penetrated plume rises into the stable layer above the convective boundary layer and is subsequently mixed to the ground only when the convective mixing height rises to intercept it. As a result, the penetrated plume mixes to the ground over time, yet not necessarily during the same hour that it is emitted into the stable layer aloft.
Research-grade experiments in the 1980s were able to detect plume concentrations aloft using laser imaging, detection, and ranging (“LIDAR”) instrumentation. The methods used for the EPRI Kincaid and Bull Run field studies are described by Moore, Milich, and Liu (Citation1988). LIDAR data collected from the Bull Run field study provided insight into the evolution of the plume behavior over the course of convective-driven hours (sunrise to sunset). Moore, Milich, and Liu (Citation1988) found that the compact nature of the plume was preserved until the hour when the convective mixing height finally rose through the layer occupied by the plume, which typically occurred around midday. This behavior demonstrates that prior to this time, the penetrated plume remained above the mixing height and did not mix down to the ground until it was intercepted by the rising convective mixed layer.
Based upon the findings noted above, the likelihood of elevated ground-level concentrations resulting from a penetrated plume is low until the convective mixed layer has risen to intercept the plume. The penetrated plume interception event, often referred to as “daytime fumigation,” typically leads to elevated concentrations only during a single hour of the day. The multiple-hour evolution of this process presents a challenge to steady-state models, such as AERMOD, because it has no information of the next hour’s conditions. AERMOD’s current treatment of penetrated plume material results in the premature mixing of the penetrated plume into the convective boundary layer typically too early in the day and during more hours than expected. This will typically result in a premature and repetitious mixing of the penetrated plume to the ground that only occurs once during the daytime hours.
Current representation of penetrated plumes in AERMOD
The 2021 AERMOD’s formulation (U.S. EPA Citation2021b) (version 21112) computes vertically integrated values between the plume centerline and the higher level of the plume’s bottom edge and receptor at the ground. However, this calculation has the potential to overstate the vertical plume growth if the vertical plume depth (a function of vertical plume dispersion, sigma-z) assumed by the model is too large. The computation of sigma-z (used to determine the plume’s bottom edge) in AERMOD is a function of the stability in the layer occupied by the plume. By definition, the penetrated plume resides in a stable layer above the mixing height, but the AERMOD formulation assumes a neutral layer for computing the penetrated plume sigma-z, which substantially overestimates the sigma-z value. This formulation, according to the AERMOD model formulation document, assumes that the penetrated plume mixes into the CBL and thus encounters a non-stable layer for the portion of the plume that reaches the ground. However, this assumption is only correct if the mixing height rises fast enough to capture at least a portion of the penetrated plume by the end of the current hour, according to (Weil, Corio, and Brower Citation1997).
As a result, AERMOD averages sigma-w over a depth that, in reality, can involve large changes in sigma-w with height above the mixing height, as illustrated in Section 4.1.5 of EPA’s AERMOD formulation (U.S. EPA Citation2021b). Hence, for hours when the actual mixing height has yet to intercept the plume, the averaged, computed value does not represent local turbulence conditions at the penetrated plume’s centerline height. For many cases, where the vertical integration occurs over a significant depth within the convective boundary layer, the modeled plume spreading will be greatly exaggerated because the actual values of sigma-w in the convective boundary layer can be an order of magnitude higher than those in the stable layer aloft.
Proposed HBP enhancement to AERMOD
The proposed enhancement to AERMOD to address the penetrated plume issue is referred to as “HBP” for modifications particularly important for “highly buoyant plume” cases. The modification is based in part on a refined approach (Weil Citation2020) to better characterize the penetrated plume behavior in AERMOD. This revised approach involves a check on the convective mixing height for the current hour as well as the next hour to determine how much of the penetrated plume has been captured by the CBL by the end of the current hour. This is the first time that AERMOD has been enhanced to look ahead to the next hour in order to improve its performance.
The amount of the penetrated plume mass that is allowed to mix to the ground in the HBP modifications depends upon the result of this calculation. There are three possible outcomes.
Case 1 (No penetrated plume impact): If the average of the current and the next hour’s convective mixing height (each value represents the half-hour mark, so the average is assumed to be at the end of the current hour) is below the bottomFootnote1 of the penetrated plume final height, then no portion of the penetrated plume is assumed to mix into the convective boundary layer. In this case, the contribution of the penetrated plume mass at the receptor is assumed to be zero.
Case 2 (Full penetrated plume impact): If the mixing height at the end of the current hour is above the top of the penetrated plume, then the full mass of the plume is assumed to reach the ground, and the current AERMOD formulation is used for that hour.
Case 3 (Partial penetrated plume impact): For convective mixing heights (by the end of the current hour) that are in between the bottom and top of the penetrated plume, a fraction of the plume mass computed using a vertical Gaussian distribution is assumed to reach the ground using the current AERMOD formulation.
To further illustrate these three cases, an example using a plume centerline at a height of 500 m is shown in . In this case, the vertical extent of the plume (out to 2.15 sigma-z’s) is between 400 and 600 m (yellow zone in ).
Figure 2. Conceptual drawing of the three-case treatment used in HBP.
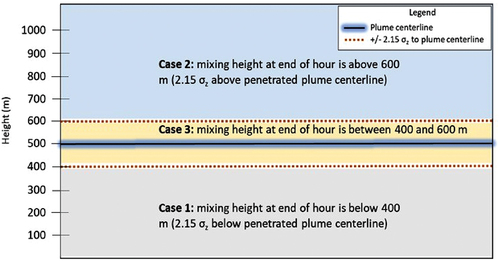
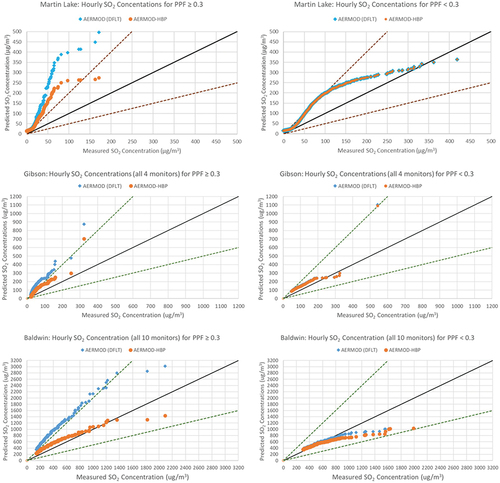
Figure 3. Q-Q plots of category 1 (PPF ≥ 0.3) and category 2 (PPF < 0.3) hours for each.
The approach implemented in the HBP modifications, and the resulting plume behavior, is consistent to what is seen in research-grade experiments such as the 1982 EPRI Bull Run study. The approach also extends AERMOD’s capability for dealing with only 1 hr at a time by enabling it to determine the rate of change for the convective mixing height, with the possibility that the rising mixing height could intercept at least part of the penetrated plume in the current hour. Additionally, the HBP modifications generally only affect AERMOD during the critical period of the late morning through early afternoon rise of the convective mixing height into the layer containing the penetrated plume. For all other hours, AERMOD-HBP is equivalent to AERMOD run with default options.
Candidate evaluation databases
In the case of the penetrated plume associated with tall stacks with considerable buoyancy, ideal database settings would include flat terrain, rural conditions, and isolated sources. Typically, ideal databases involve coal-fired power plants due to the availability of hourly SO2 emissions data (including exhaust parameters) from Continuous Emissions Monitoring Systems (CEMS), representative hourly meteorological data, and concurrent ambient monitoring data. A review of available field studies resulted in three candidate databases: Martin Lake Generating Station (Martin Lake), Gibson Generating Station (Gibson), and Baldwin Power Plant (Baldwin). Each candidate database was further screened for a large sensitivity to the HBP changes for hours affected by the penetrated plumes, and with minimal difference in predicted concentrations for all other hours. Further details regarding the candidate databases are available in the supplemental information (SI) document.
Screening analysis for HBP Sensitivity
All three databases (Martin Lake, Gibson, and Baldwin) were modeled with AERMOD version 21112 (current release at the time of this study) using default, regulatory options, hereafter referred as AERMOD-default. A second model run used a modified version of AERMOD version 21112 that included the proposed HBP modification for penetrated plumes, hereafter referred as AERMOD-HBP. Meteorological input files for AERMOD, for each database, were processed with AERMET version 21112 (current release at time of this study).
Each database was initially screened to determine if the model performance would be sensitive the HBP enhancements. This screening process involved the generation of quantile–quantile (Q-Q) plots of independently ranked predicted versus observed concentrations both unpaired in time and space. For those databases that consisted of multiple monitors (Gibson and Baldwin), all the monitors and modeled receptors (sited at the monitor locations) were grouped together for this screening analysis.
Modeled and observed hours for each database were grouped in one of two categories. Category 1 included hours when the penetrated plume contributed to a substantial portion of the predicted ground-level concentration. Category 2 included all remaining hours not meeting the criteria established for Category 1 hours. A “substantial portion” determination was based upon examining model debug output to determine the average partial penetration fraction (PPF) for each hour.
An average PPF cutoff of 0.3 or higher was determined, through a series of sensitivity tests, to be a reasonable threshold for a potentially significant portion of the modeled concentration to be impacted by the penetrated plume. The percent of hours meeting the 0.3 or greater PPF threshold ranged from 10% to 20% across the 3 databases evaluated.
shows the Q-Q plots developed for the screening analysis for each modeled database. Category 1 hours (those with PPF greater or equal to 0.3) are on the top and Category 2 (all remaining hours) are on the bottom. For the Category 1 plots, AERMOD-default results in a model overprediction by a factor of 3 to 5 (Martin Lake), or a factor of 2 (Gibson and Baldwin). AERMOD-HBP still overpredicts, but to a lesser degree for Martin Lake. For Gibson and Baldwin databases, AERMOD-HBP are relatively unbiased outside of the top 1 or 2 ranked pairs. For Category 2 hours, the models are nearly identical with a slightly larger difference between the two models for the Baldwin dataset. The differences at Baldwin are attributed to a combination of the use of several more monitors being evaluated and more hours when the penetrated plume component is significant but have a PPF that is slightly below the cutoff of 0.3.
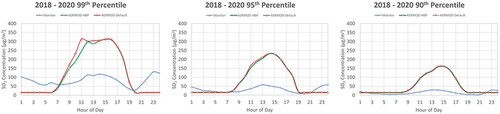
Figure 4. Three-year (2018–2020) averaged hour-of-day percentile concentration plots for Martin Lake.
The Baldwin Q-Q plots show that this is the only database that displays an underprediction bias for Category 2 hours by both models. One possible explanation for the model underprediction is undocumented emissions from the nearby Randolph Coal Preparation Plant. The preparation plant is located about 5 km to the east of Baldwin with historical SO2 emissions around 4,200 tons per year.
Overall, the sensitivity analysis indicates a clear overprediction bias by AERMOD-default for Category 1 hours (i.e., when the PPF is greater or equal to 0.3) and improved model performance using AERMOD-HPB for these same hours. The two models generally have similar results for the lower PPF hours, so the effects of AERMOD-HBP are thus restricted to the penetrated plume-dominated hours, as designed.
Evaluation tests for selected field databases
The second phase of the model evaluation further examined the quality of the databases, investigated meteorological conditions for the higher observed and modeled concentrations, and objectively evaluated AERMOD-HBP compared to AERMOD-default using a series of statistical measures. Specifically, the additional analyses included the following:
Meteorological conditions for the top 10 hourly concentrations,
Concentrations by hour of day, and
Statistical measures included in U.S. EPA’s Model Evaluation Methodology (MEM) system.
The statistical performance measures from the Model Evaluation Methodology (MEM) system (Strimaitis et al. Citation1993) are consistent with U.S. EPA guidance (U.S. Environmental Protection Agency Citation1992). Statistical measures included in MEM are the robust highest concentration (RHC), a composite performance measure (CPM), and a model comparison measure (MCM). The RHC is typically used to evaluate a model’s performance at the high-end distribution of concentrations. The number of high-end values used in this evaluation included the top 25 modeled and observed concentrations. The RHC is computed as follows:
where X(N) is the Nth largest value and is the average of the N − 1 largest values. The CPM is a weighted linear combination of the absolute fractional bias between the models being evaluated (i.e., AERMOD-default and AERMOD-HBP). The MCM is the difference between the CPMs for the models that are evaluated. The equation for CPM is as follows:
where (AFB)r,s is the absolute fractional bias for diagnostic condition r at station s; (ABS)3 is the absolute fraction bias for 3-hr averages; and (AFB)24 is the absolute fractional bias for 24-hr averages.
The absolute fractional bias (AFB) is computed as follows:
where M is the predicted concentration and O is the observed concentration.
Typically, the ratio of the model comparison measure to the standard error is used to provide a convenient measure of the significance for the difference between two or more models. The complex nature of the MCM statistic hinders the ability to apply the usual statistical measures for estimating the standard error. Instead, the MCM applies a resampling technique, known as bootstrapping, to compute the standard deviation of the measure over all bootstrap-generated outcomes. The significance of the MCM depends on whether or not its confidence interval overlaps zero. As discussed in the Section 1.3.5 of Strimaitis et al. (Citation1993), the better performing of two models is an improvement on a statistically significant basis when their confidence interval does not overlap zero. A key advantage to using the MEM system is its ability to easily focus model performance on specific diagnostic classes for a more in-depth analysis. This is of particular importance for the evaluation performance of AERMOD-HBP since it is specifically designed to target hours when the penetrated plume would reside in the stable layer aloft (i.e., above the mixed layer). Details describing these additional analyses are available in the SI document. In order to evaluate whether there were any potential unaccounted sources affecting peak observed concentrations, a review of observed data versus wind speed and direction was conducted. This analysis suggested that none of the databases’ highest observed concentrations were significantly impacted by unaccounted sources. Further details regarding this analysis are available, in the SI document.
Evaluation results for Martin Lake
A summary of the detailed evaluation results for Martin Lake are presented in this section. Additional figures, tables, and details discussing an in-depth review of the analyses are available, in the SI document.
In general, AERMOD-default predicted the highest 1-hr SO2 concentrations during the morning hours, under light wind conditions (less than 4 m/s). The top 10 highest 1-hr SO2 observed concentrations were split between late afternoon and stable, nighttime conditions for this single monitor database. The nighttime hours corresponded with higher wind speed events (greater than 8 m/s), while low winds were most prevalent during the afternoon observed events. The peak nighttime observed conditions were treated the same by both models being evaluated (with underprediction tendencies), and so the HBP enhancements do not affect model performance for these conditions.
After a review of representative upper air soundings for the peak observed nighttime events, the cause of the high observations is believed to be due to intermittent enhancement of vertical turbulence associated with a low-level jet and the associated subcritical Richardson numbers associated with high wind shear. Other research (Freedman Citation2011; Hanna and Chang Citation1992; Lyons, Panofsky, and Wollaston Citation1964) that has considered this issue note that a large increase in the vertical turbulence at night can occur in high wind speed shear conditions, resulting in a short-term event of mixing down of elevated plumes similar to that of the penetrated plume during the daytime. However, the vertical mixing will then destroy the shear and then a cyclical process is set up with buildup of the shear again and then destruction of the shear with the fumigation-like plume behavior. Without continuous hourly upper air measurements of wind and temperature profiles, it is not feasible to incorporate this effect into dispersion models. The consideration of the sub-critical Richardson number effect on nighttime vertical turbulence is beyond the scope of this study, but it represents a mixing phenomenon that is challenging for dispersion models to address.
AERMOD-HBP was found to delay the onset of the highest predicted SO2 concentration events, bringing the timing of the peak daytime predicted concentrations more in line with the timing of the peak daytime observed concentrations. In addition to the better timing of peak daytime concentrations by AERMOD-HBP, the highest SO2 concentrations from AERMOD-HBP aligned closer to the observed compared to the higher concentrations from AERMOD-default.
There is a noticeable difference between the model-predicted 3-year averaged 99th percentile SO2 concentrations between AERMOD-default and AERMOD-HBP for the morning hours, as shown by ). This difference between the models is even more prevalent for the individual year plots, provided in the SI document. The differences become negligible by the 95th percentile SO2 concentrations. The resulting 3-year averaged 99th percentile SO2 concentration plot ()) for AERMOD-HBP indicates that peak modeled concentrations are delayed until the afternoon hours, which is consistent with the behavior of the observational plot.
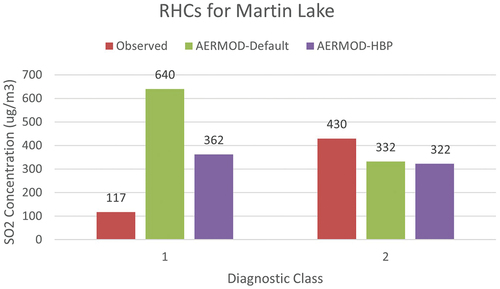
The results from the MEM system on the single Martin Lake monitor indicate that AERMOD-HBP performed better than AERMOD-default and the difference between the two models is statistically significant. shows the RHCs for diagnostic classes 1 and 2 for the Martin Lake monitor. Diagnostic class 1 was designed to account for over 90% of the penetrated plume dominating hours. The highest RHC from AERMOD-default is located in the diagnostic class 1 group. AERMOD-HBP reduces the RHC for the penetrated plume dominating hours (class 1) by approximately 43%. As expected, the RHCs for the remaining diagnostic classes (3 through 7) were similar between the two models.
Figure 5. RHCs for diagnostic classes 1 and 2 for Martin Lake.
summarizes the MCM statistic for the Martin Lake database from the MEM system. A positive MCM reflects the alternative model performance is better than the default; in this case, AERMOD-HBP demonstrates better performance compared to AERMOD-default. The MCM 90% confidence interval does not span zero, indicative of a performance difference that is statistically significant. Additional details on the MEM analysis for Martin Lake are available, in the SI document.
Table 1. MCM statistics from MEM for Martin Lake.
Evaluation results for Gibson
Overall, for Gibson, AERMOD-HBP delays the timing of the peak hourly SO2 concentrations by a few hours for selected events, compared to AERMOD-default. The majority of the top 10 SO2 concentrations from AERMOD-default occur between the hours of 0800 and 1200 LST. Of the four monitors, the wind speeds (from 60-m) are generally stronger for the top 10 SO2 concentrations at East Mt. Carmel, with the majority of modeled and observed top 10 hr with wind speeds greater than 4.5 m/s. The Shrodt monitor featured all the top 10 SO2 concentrations for both models and observed at wind speeds below 4 m/s.
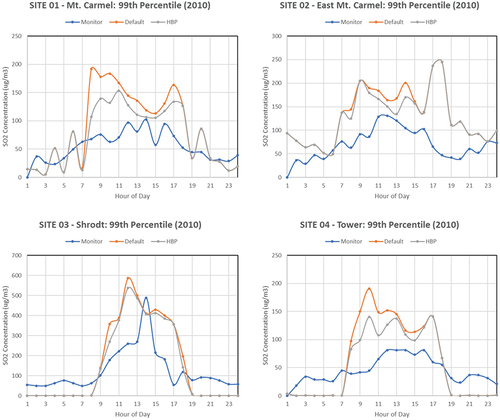
shows the 99th percentile SO2 concentrations for each of the four monitors. The 99th percentile SO2 concentration analysis for each individual monitor reveals two distinct modeled peaks; one in the mid to late morning and a second in the late afternoon. Peak observed 99th percentile SO2 concentrations typically occurred in the mid-afternoon.
Figure 6. One-year (2010) averaged hour-of-day percentile concentrations plots for Gibson.
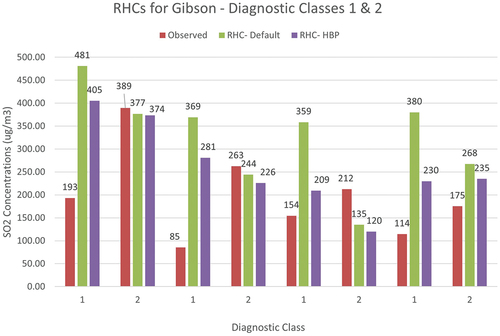
The results from the MEM system on the 4-monitor Gibson database indicated that AERMOD-HBP performed better than AERMOD-default and the difference between the two models is statistically significant, at two of the four monitors and all monitors combined. The other two monitors (East Mt. Carmel and Shrodt) still show AERMOD-HBP performs better, but the model performances are not significantly different. shows the RHCs for diagnostic classes 1 and 2 for the four Gibson monitors. Diagnostic class 1 was designed to account for over 90% of the penetrated plume dominating hours. The highest RHC from AERMOD-default is located in the diagnostic class 1 group. AERMOD-HBP reduces the RHC for the penetrated plume dominating hours (class 1) by approximately 15–40%. As expected, the RHCs for the remaining diagnostic classes (3 through 7) were similar between the two models.
Figure 7. RHCs for diagnostic classes 1 and 2 for Gibson.
summarizes the MCM statistic for the Gibson database for each monitor and all monitors combined from the MEM system. In all cases, the MCM is positive. The MCM 90% confidence interval does not span zero for half of the monitors and when all data is combined, indicative of a performance difference that is statistically significant. Additional plots and discussion on the top 10, hour-of-day, and MEM analysis for Gibson are available, in the SI document.
Table 2. MCM statistics from MEM for Gibson.
Evaluation results for Baldwin
For the Baldwin database, the majority of AERMOD-default high SO2 concentrations across all monitors occur under low wind (less than 4 m/s) conditions. AERMOD-HBP does introduce some higher wind events associated with top 10 SO2 concentrations at more than half of the monitors (sites 2, 3, 5, 6, 7, 9, 10). The highest AERMOD-default SO2 concentrations occur at monitors located southeast of Baldwin (sites 5 through 7). Both models performed rather poorly at monitor 4, the closest southeast monitor to Baldwin. Monitor 9, similar proximity to Baldwin as monitor 4, located to the south of Baldwin also exhibited some underprediction tendency. It may be that building downwash issues may be present at monitors 4 and 9, which is beyond the scope of this study.
More than half (6 of 10) show AERMOD-default and AERMOD-HBP with top 10 SO2 concentrations about 2–3 hr earlier than the earliest observed SO2 concentrations. AERMOD-HBP does not appear to delay the onset of the mixing down of the penetrated plume, which was noted at some of the monitors in the other databases. For monitors 5 through 10, the highest SO2 concentrations from AERMOD-default occur during the mid to late morning and are significantly higher than AERMOD-HBP and the observed SO2 concentrations.
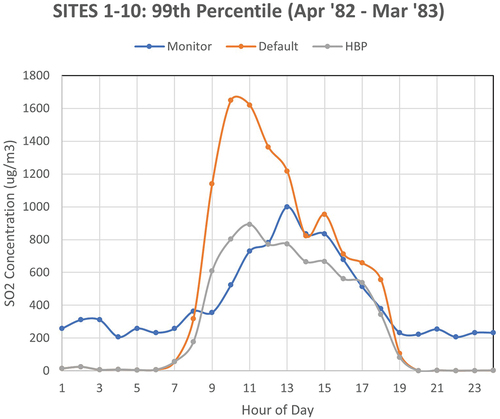
shows the 99th percentile SO2 concentrations for all 10 monitors combined. This plot shows significantly high concentrations from AERMOD-default during the mid to late morning hours. AERMOD-HBP reduces the peak morning 99th percentile SO2 concentrations dramatically and is more in line with observations until midday.
Figure 8. Hour-of-day 99th percentile concentration plot for all 10 Baldwin monitors.
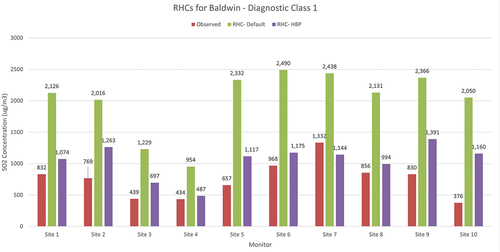
The results from the MEM system on the 10-monitor Baldwin database indicated that AERMOD-HBP performed better than AERMOD-default at all monitors (and combined). The difference between the two models is statistically significant at 4 of the 10 monitors and all monitors combined. shows the RHCs at each monitor for diagnostic class 1. Diagnostic class 1 was designed to account for over 80% of the penetrated plume dominating hours, for this database. For 9 of 10 monitoring sites, the highest RHC from AERMOD-default is in the diagnostic class 1 group. The exception is monitor 4, which the highest AERMOD-default RHC is slightly higher in diagnostic class 2 than diagnostic class 1. The highest observed RHC was found to occur in diagnostic class 2 for 9 of 10 monitors, with only monitor 7 having the highest observed RHC in diagnostic class 1. AERMOD-HBP reduces the RHC for the penetrated plume dominating hours (class 1) by approximately 40–55%. As expected, the RHCs for the remaining diagnostic classes (3 through 7) were similar between the two models.
Figure 9. RHCs for diagnostic class 1 for Baldwin.
summarizes the MCM statistic for the Baldwin database for each monitor and all monitors combined from the MEM system. In all cases, the MCM is positive. The MCM 90% confidence interval does not span zero at 4 of the 10 the monitors and when all data are combined, indicative of a performance difference that is statistically significant. Additional plots and discussion on the top 10, hour-of-day, and MEM analysis for Baldwin are available, in the SI document.
Table 3. MCM statistics from MEM for Baldwin.
Consequence analysis for AERMOD-HBP
This study also assessed whether the beneficial changes due to the HBP approach in AERMOD would be similar for stacks that are short (less than 100 m) and/or have lower buoyancy fluxes than the ones tested using the field databases. This process, often referred to as a “consequence analysis”, was performed by U.S. EPA (U.S. Environmental Protection Agency Citation2003) for AERMOD’s replacement of the Industrial Source Complex model.
The consequence analysis consisted of five buoyant stack configurations of varying heights and typical stack exhaust parameters representative of stacks of similar heights at power generating stations (). Three of the stack configurations had heights less than 100 m. Emission rates were kept constant over all configurations tested.
Table 4. Consequence analysis stack configurations.
AERMOD-default and AERMOD-HBP (both version 21112) were run for all stack configurations, listed in , for two different meteorological datasets. The AERMOD-ready meteorological datasets selected for this consequence analysis include (1) the Raleigh-Durham International Airport (RDU, prepared by the North Carolina Division of Air Quality) and (2) the Dallas-Fort Worth International Airport (DFW, prepared by the Texas Commission on Environmental Quality). The consequence analysis assumed flat terrain and used a polar receptor grid with 36 radials (beginning at 10 degrees and spaced every 10 degrees) at distances of 125, 250, 400, 800, 2000, 4000, 8000, and 16,000 m. To make a comparison between the two models and to maintain consistency with U.S. EPA’s 2003 study, ratios of the maximum modeled concentrations were calculated for various averaging periods (1-, 3-, 24-hr and annual).
The results from the consequence analysis showed that for the shorter stacks (i.e., less than 50 m), there is no difference in the maximum modeled concentrations across all averaging periods. This is consistent with expectations given that it would be much more difficult for plumes from these sources to reach to the stable region aloft for multiple hours, compared to a tall stack source. The 100- and 200-m stack cases show a factor of 1–2.4 greater predicted values for AERMOD-default versus AERMOD-HBP. This is consistent with the improved performance seen with the AERMOD-HBP results using the field databases evaluated in this manuscript.
Discussion and conclusion
AERMOD’s current formulation regarding the penetrated plume, which is the portion of the plume that is sufficiently buoyant to break through the elevated inversion into the stable layer aloft, seems to lead to model overpredictions. Observations of the behavior of the penetrated plume (such as from the EPRI Bull Run 1982 field study) indicate that the plume material stays aloft until the rising convective mixing height intercepts the buoyant plume aloft, causing it to fumigate to the ground. Prior to the time of fumigation, the likelihood of elevated ground-level concentrations from a penetrated plume is very low. However, AERMOD, as it is currently implemented, simulates a premature mixing of the penetrated plume to the ground, and repeats this behavior for hours leading up to the inversion breakup. This behavior has been observed with field studies where the model is found to overpredict ground-level concentration events due to the penetrated plume component, and makes those predictions too early in the day.
To address AERMOD’s conservative approach for the penetrated plume, the HBP approach was implemented into AERMOD and evaluated. The HBP modification involves a check on the convective mixing height for the current hour as well as the next hour to determine how much of the penetrated plume is within the convective mixed layer at the end of the current hour.
Three evaluation databases that featured hourly emissions, meteorology, and monitored concentrations from rural, tall stack, isolated sources in flat terrain. A screening analysis indicated that for each database, hours significantly affected by penetrated plumes showed significant overpredictions by AERMOD-default (at least a factor of 2) and more unbiased results (but not underpredicting) for AERMOD-HBP.
A detailed analysis consisting of meteorological conditions for the top 10 modeled and observed concentrations, behavior of concentrations by time of day, and a variety of statistical measures yielded the following observations for all three databases:
AERMOD-HBP reduces overprediction tendencies in AERMOD-default for peak morning concentrations, resulting in modeled concentrations much closer and reasonable to observations;
At the majority of monitors evaluation across the three databases, AERMOD-HBP was found to delay the peak modeled concentrations by 1–3 hr compared to AERMOD-default;
AERMOD-HBP was shown using specific diagnostic classes to demonstrate its benefit over AERMOD-default for penetrated plume dominating hours and similar results for all remaining hours; and
Overall, AERMOD-HBP was considered to perform better and be statistically significant to AERMOD-default.
Furthermore, a consequence analysis confirmed the difference between AERMOD-default and AERMOD-HBP for tall stacks (100 m and higher) can be a factor of 1 to 2.4. For shorter stacks (below 100 m), both models produce more comparable results as the plumes would very likely remain in the mixed layer and not penetrate to the stable layer aloft.
Abbreviations
AERMET A meteorological pre-processor for AERMOD
AERMOD A short range, steady-state air quality dispersion modeling system developed by the American Meteorological Society/U.S. Environmental Protection Agency Regulatory Model Improvement Committee (AERMIC)
CBL Convective Boundary Layer
CEMS Continuous Emissions Monitoring System
CPM Composite Performance Measure, statistical measure used in MEM
DIAL Differential Absorption LIDAR
HBP Highly buoyant plume modification for AERMOD’s penetrated plume treatment
LIDAR Light detection and ranging, an instrument used for determining distances to a target or object with a laser
MCM Model Composition Measure, difference between default model CPM and alternative model CPM used in MEM
MEM Model Evaluation Methodology, a software package designed to evaluate model performance through statistical measures
PPF Partial Penetration Factor, contribution of modeled plume considered to be penetrated plume material
RHC Robust Highest Concentration, a statistical measure calculated for both measured and modeled concentrations
SCRAM U.S. EPA’s online Support Center for Regulatory Atmospheric Modeling
SO2 Sulfur Dioxide
U.S. EPA U.S. Environmental Protection Agency
Data availability
The data that support the findings of this study are available from the corresponding author, C. W., upon reasonable request.
Supplemental_Information_HBP_27APR22.pdf
Download PDF (4.2 MB)Acknowledgment
The authors would like to gratefully acknowledge EPRI for providing partial funding for this research and for the contributions and collaboration with Jeffrey Weil in applying HBP.
Disclosure statement
No potential conflict of interest was reported by the author(s).
Supplementary material
Supplemental data for this paper can be accessed on the publisher’s website
Additional information
Notes on contributors
Christopher J. Warren
Christopher J. Warren is a project manager and air quality meteorologist with AECOM's Air Quality Modeling group in Chelmsford, MA.
Robert J. Paine
Robert J. Paine, CCM, QEP, is an associate vice president and technical director with AECOM's Air Quality Modeling group in Chelmsford, MA.
Jeffrey A. Connors
Jeffrey A. Connors is a senior project manager and modeling center of excellence leader with AECOM's Air Quality Modeling group in Chelmsford, MA.
Carlos Szembek
Carlos Szembek is a software programmer and senior air quality meteorologist with AECOM’s Air Quality Modeling group in Chelmsford, MA.
Eladio Knipping
Eladio Knipping is a program manager in the Generation Sector at the Electric Power Research Institute (EPRI).
Notes
1 The “bottom” of the penetrated plume is 2.15 sigma-zs below the plume centerline height, where the concentration drops to 10% of that at the plume centerline (with a Gaussian distribution assumed).
References
- Cimorelli, A. J., S. G. Perry, A. Venkatram, J. C. Weil, R. J. Paine, R. B. Wilson, R. F. Lee, W. D. Peters, and R. W. Brode. 2005. AERMOD: A dispersion model for industrial source applications. Part I: General model formulation and boundary layer characterization. J. Appl. Meteorol 44 (5):682–93. doi:10.1175/JAM2227.1.
- Environmental Protection Agency (EPA) of Victoria. 2013. Guidance notes for using the regulatory air pollution model AERMOD in Victoria. October 2013. Publication 1551. EPA Victoria.
- Freedman, F. 2011. METR 130: Lecture 4. Spring Semester 2011. Last Accessed October 18, 2021. https://www.sjsu.edu/people/frank.freedman/courses/metr130/s1/Met130_Spring11_Lect4.pdf
- Hanna, S. R., and J. C. Chang. 1992. Boundary-layer parameterizations for applied dispersion modeling over urban areas. J. Boundary-Layer Meteorology 58 (3):229–59. doi:10.1007/BF02033826.
- Lyons, R., H. A. Panofsky, and S. Wollaston. 1964. The critical Richardson number and its implications for forecast problems. J. Appl. Meteorol 3 (2):136–42. doi:10.1175/1520-0450(1964)003<0136:TCRNAI>2.0.CO;2.
- Ministry of the Environment, Conservation and Parks (MECP), 2020. Adopting updated air dispersion models under the local air quality regulation (O. Reg 419/05): Adopting AERMOD/AERMOD 19191 and ASHRAE 2019. Last Accessed April 14, 2022. https://ero.ontario.ca/notice/019-1229
- Moore, G. E., L. B. Milich, and M. K. Liu. 1988. Plume behaviors observed using lidar and SF6 tracer at a flat and hilly site. Atmos. Environ 22 (8):1673–88. . doi:10.1016/0004-6981(88)90396-4.
- Strimaitis, D., E. Insley, M. E. Korc, and F. W. Lurmann. 1993. User’s guide for the model evaluation methodology (MEM) system for comparing model performance. Final report prepared for the U.S. In Environmental Protection Agency, Research Triangle Park, NC, by Sonoma Technology, STI-93261-1392-FR, December, Santa Rosa, CA: Inc.
- U.S. Environmental Protection Agency. 1992. Protocol for determining the best performing model. EPA-454/R-92-025, September. Last Accessed October 7, 2021. https://www.epa.gov/sites/default/files/2020-10/documents/model_eval_protocol.pdf
- U.S. Environmental Protection Agency. 2003. Comparison of regulatory design concentrations. AERMOD vs ISCST3, CTDMPLUS, ISC-PRIME. EPA-454/R-03-002, June. Last Accessed October 7, 2021. https://gaftp.epa.gov/Air/aqmg/SCRAM/models/preferred/aermod/compar.pdf
- U.S. Environmental Protection Agency. 2015. Proposed updates to AERMOD system. Presentation at 11th Conference on Air Quality Modeling, Research Triangle Park, Raleigh, NC, August. https://newftp.epa.gov/Air/aqmg/SCRAM/conferences/2015_11th_Conference_On_Air_Quality_Modeling/Presentations/1-5_Proposed_Updates_AERMOD_System.pdf
- U.S. Environmental Protection Agency. 2021a. AERMOD evaluation databases. Last Accessed November 22, 2021a. https://gaftp.epa.gov/Air/aqmg/SCRAM/models/preferred/aermod/eval_databases/
- U.S. Environmental Protection Agency. 2021b. AERMOD model formulation and evaluation. EPA-454/B-21-003, April. Last Accessed October 7, 2021b. https://gaftp.epa.gov/Air/aqmg/SCRAM/models/preferred/aermod/aermod_mfed.pdf
- Warren, C. J., R. Paine, and J. Connors. Evaluation of AERMOD SO2 predictions for a research-grade field experiment. Guideline on air quality models: Planning ahead. Air and Waste Management Association Specialty Conference, Durham, NC, March 2019.
- Weil, J. C. 2020. New dispersion model for highly-buoyant plumes in the convective boundary layer. Modeling report to the Western Australia department of environmental conservation. January 2020.
- Weil, J. C., L. A. Corio, and R. P. Brower. 1997. A PDF dispersion model for buoyant plumes in the convective boundary layer. J. Appl. Meteorol 36 (8):982–1003. doi:10.1175/1520-0450(1997)036<0982:APDMFB>2.0.CO;2.