
 ?Mathematical formulae have been encoded as MathML and are displayed in this HTML version using MathJax in order to improve their display. Uncheck the box to turn MathJax off. This feature requires Javascript. Click on a formula to zoom.
ABSTRACT
Atmospheric aerosol over the Arabian Sea is significantly impacted by the long-range transported mineral dust from the surrounding continents. This transported mineral dust is hypothesized and tested during several studies to see the impacts on the surface ocean biogeochemical processes and subsequently to the Carbon cycle. It is, thus important to quantify dust contributions and their fluxes to the Arabian Sea. Here we assess temporal variability of dust concentration, their elemental characteristics as well as quantify their dry and wet deposition fluxes over the North-eastern Arabian Sea. The dust concentrations were found to vary from 59 to 132 µg m−3 which accounts for 50% to 90% of total mass during dusty days. However, its contribution during pre and post dust storms ranges between 6% and 60%. Relatively higher dust dry deposition flux of 28 ± 7 mg m−2 day−1 (range: 20–44) is estimated for dusty days compared to pre and post dusty days (range: 0.4–22 mg m−2 day−1). In contrast to dry deposition fluxes, significantly higher fluxes are estimated from wet deposition, averaging around 240 ± 220 mg m−2 day−1. These values are five times higher than those reported from cruise samples collected over the Arabian Sea. The contribution of dust to aerosol mass is further ascertained using elemental composition, wherein a significant correlation was observed between Fe and Al (r2 = 0.77) for samples collected during the dusty period, highlighting their similar crustal sources. Our estimation of dust flux over this region has implications for the supply of nutrients associated with natural dust to the surface water of the Arabian Sea.
Implications: The Arabian Sea, one of the productive oceanic regions among the global oceans, has been identified as a perennial source of atmospheric CO2. This basin is heavily impacted by atmospheric dust deposition/inputs owing to its geographical location being surrounded by arid and semi-arid regions. It has been hypothesized that aeolian dust plays a significant role in modulating surface water biogeochemical processes including primary productivity, in the Arabian Sea. Furthermore, modelling studies have highlighted on the role of dust (containing Fe) in fueling and enhancing primary productivity in the Arabian Sea. However, quantification of dust deposition fluxes (wet and dry) on seasonal time scale is missing in the literature. This paper aims to partially fulfil this research gap by providing a long-term data of wet and dry deposition fluxes over the northeastern Arabian Sea. We have also discussed their seasonal variability and factors affecting this flux. Thus, this study will be valuable contribution to the aeolian research community and have significant implication toward the role of aeolian deposition to the surface water biogeochemical processes in the Arabian Sea.
Introduction
Atmospheric mineral dust is one of the significant components in the earth’s system that affects the radiation budget, biogeochemical cycles, and human health (Jickells et al. Citation2005; Mahowald et al. Citation2005; Okin et al. Citation2004). The absorbing and scattering properties of aerosols affect the earth’s radiative budget (Tegen Citation2003). Mineral dust also has an impact on the ecosystems, as it transports macro (inorganic and organic nitrogen) and micro-nutrients such as iron, phosphorus, and other trace metals (Duce and Tindale Citation1991; Jickells et al. Citation2005; Kumar, Suresh, and Rahman Citation2020; Li et al. Citation2021; Ramaswamy, Muraleedharan, and Babu Citation2017). The dust deposition supplies these nutrients, which have the potential to impact the primary productivity in surface waters (Jickells et al. Citation2005).
The Arabian Sea, one of the productive oceanic regions among the global oceans, has been identified as a perennial source of atmospheric CO2 (Körtzinger, Duinker, and Mintrop Citation1997; Sarma, Kumar, and George Citation1998). It receives mineral dust as well as anthropogenic aerosols from the surrounding arid regions and highly polluted Indo-Gangetic plains in the Indian Sub-continent, respectively (Kumar, Sarin, and Sudheer Citation2008; Kumar, Suresh, and Rahman Citation2020; Ramaswamy, Muraleedharan, and Babu Citation2017; Kaskaoutis et al. Citation2018; Rashki, Kaskaoutis, and Sepehr Citation2018; Rashki et al. Citation2019; Aswini, Kumar, and Das Citation2020; Suresh et al. Citation2021a, Citation2021b). The dust over the Arabian Sea also affects the rainfall intensity and the precipitation chemistry over this region (Das et al. Citation2015; Ramaswamy, Muraleedharan, and Babu Citation2017). The composition of dust derived from different sources to the Arabian Sea varies in different seasons, which is evident from their different geochemical characteristics (Kumar, Suresh, and Rahman Citation2020). The dry deposition in the Arabian Sea region from October to May is mostly dominated by the dust from the Arabian Peninsula and SW Asia (Iran, Afghanistan, and Pakistan), while the wet deposition during the Southwest (SW) monsoon is dominated by the Arabian Peninsula and NE Africa (Kumar, Suresh, and Rahman Citation2020; Suresh et al. Citation2021a). The dust storms are also a major reason for the exceedance of the aerosol concentration over the North-Eastern Arabian Sea (NEAS) in recent years (Agnihotri et al. Citation2015; Suresh et al. Citation2021b).
Several modeling studies have shown that mineral dust deposition plays an important role in primary productivity of the Arabian Sea, as absence of dust deposition would lower the productivity by 50% (Guieu et al. Citation2019; Jickells et al. Citation2005; Mahowald et al. Citation2005). Over the years, majority of work have highlighted dust contributions to the Arabian Sea from the Arabian Peninsula, SW Asia, and NE Africa to the Arabian Sea (Aswini, Kumar, and Das Citation2020; Léon and Legrand, Citation2003; Rashki, Kaskaoutis, and Sepehr Citation2018; Rashki, Middleton, and Goudie Citation2021). Although several studies have shown the influence of mineral dust on ocean biogeochemistry, studies pertaining with quantification of dust fluxes based on real time aerosol collection over the Arabian Sea are very sparse (Kumar, Sarin, and Sudheer Citation2008; Tindale and Pease Citation1999). Thus, our objective in this paper is to quantify wet and dry deposition fluxes over the northeastern Arabian Sea during the dust storm period and the SW monsoon season using the ground-based dry aerosol and wet deposition (rainwater) sample collection, respectively. We also aim to characterize dust aerosols collected from wet and dry deposition using major element (Al, Fe, and Ti) composition and their ratios. We have further discussed their seasonal variability and factors affecting the flux. Thus, this study will be valuable contribution to the eolian research community and have significant implication toward the role of eolian deposition to the surface water biogeochemical processes in the Arabian Sea.
Materials and methods
Sampling description
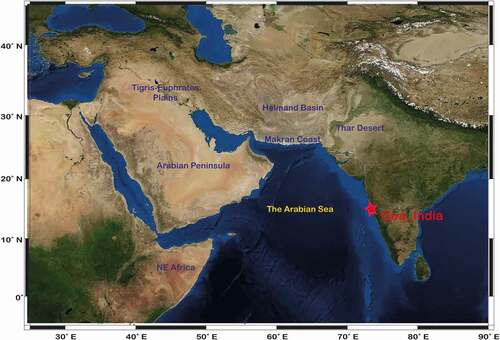
Aerosol and rainwater samples were collected at a coastal station located on the northeastern Arabian sea coast at the CSIR-National Institute of Oceanography, Goa, India (15.45° N, 73.80° E) (). The sampling site is affected by seasonally reversing south west (SW) monsoon winds from June to September and north east (NE) monsoon winds from November to February. Apart from the two major monsoon wind systems, other regional and local winds in the dust source regions like the Summer Shamal winds, Levar winds, Red Sea winds, tropical cyclones and Western disturbance or Winter Shamal also play a major role in transporting the dust to the NEAS. A detailed meteorological setting over this region is described by Kumar, Suresh, and Rahman (Citation2020) and Suresh et al. (Citation2021a). In general, the major processes responsible for the aerosol deposition is either by dry deposition due to gravity and/or impact as well as by wet deposition due to in or below-cloud scavenging. Both dry and wet deposition aerosol samples were collected for the years 2012–2015.
Figure 1. The sampling site Goa and the major dust sources to the Arabian Sea are labeled in the map.
Aerosol sampling
Aerosol samples were collected on a daily basis from 2012 to 2015 at the National Institute of Oceanography, Goa, India by using Envirotech High Volume Samplers (HVS) APM 430, with a flow rate of about 1–1.3 m3 min−1 for a sample period of 22–24 hours. Typical cutoff aerodynamic diameter for collected particulate matter was less than 20 microns. GF/A glass fiber filters (20 × 25 cm sheets) (Whatman®) were used for the sampling. The filters were conditioned in an oven at 80°C and weighed before sampling. After the sampling, the filters were transferred and stored in Ziploc bags. Extreme care was taken while handling the filters to avoid any contamination or wear and tear. Several field blanks were collected by placing filters over the sampler for a few hours without running the pump. This was done to assess the level of contamination during sampling and storing of samples. The total suspended particulate (TSP) mass was calculated from the difference in the filter weight before and after sampling. During the monsoon season (June–September), no aerosol samples were collected due to the unavailability of dry days, as it rained almost every day at the sampling location. Most of the aerosols are removed due to scavenging by raindrops.
Wet deposition sample collection
Rainwater samples were collected in a plastic tray with a base area of 1 m2 every rainy day during the SW rainy season from 2013 to 2015. The sample collecting trays were cleaned with utmost care using MQ water before and after sampling. After sample collection, the rainwater is filtered by using a pre cleaned (Milli-Q water) polycarbonate filter of 0.4 μm pore size to obtain the wet deposition particulates (WDP). The filtered WDP was dried at 40°C in an oven to remove water content and the weight of the samples was measured gravimetrically using a micro-balance. Further detailed information can be found in Suresh et al. (Citation2021a). The samples were used for processing and analyses of geochemical tracers.
Sample preparation for chemical analysis
Crustal elements (Al, Ti, and Fe) were measured by digesting one-eighth portion of the filter (~54 cm2) for aerosol samples and 50 mg of WDP samples. There were 12 major dust storms identified based on the aerosol concentration, Aerosol Index (AI) and air mass back-trajectories (for back-trajectories refer supplementary material S2) (detail of identification of dust sources can be found in Kumar, Suresh, and Rahman Citation2020), that pass over the sampling station Goa for the years 2012–15, and a total of 69 aerosol filter samples were analyzed for the crustal elements (the sample details are given in ). Sixteen wet deposited samples were selected for digestion for each of the three years 2013, 2014, and 2015 (one sample per week). Samples were digested in Savillex vial (15 mL capacity) with 0.5 mL HF and 3 mL HNO3 at 110°C for 24 hours under a clean laminar flow bench. This process was continued until the samples were completely dissolved and then dried. Subsequently, all samples were made up to 50 mL with 2% supra-pure HNO3 in pre-cleaned polypropylene bottles. Multiple field blanks, which were considered as procedural blanks during the analysis, were analyzed for all crustal elements, and depending upon these blank concentrations, corrections were made in samples. The procedural blank concentration (including contribution from chemical reagents and filter blank) for Al, Fe, and Ti are 0.05, 0.05, and 0.04 µg m−3, respectively. Procedural blank concentrations for these elements are estimated by normalizing blank concentration to average air volume filtered (~1500 m3) for the study period. The crustal elements (Al, Fe, and Ti) concentrations were analyzed using ICP-OES (Agilent 710) at the National Institute of Oceanography, Goa. The concentration of all three elements in sample and blank filters were found more than the detection limit (0.05, 0.05, and 0.06 ppm for Al, Fe, and Ti, respectively) of each element measured using the ICP-OES. In addition to samples, a reference standard (NIST SRM 2710a) was also digested following similar procedure and elements were measured in this standard. Few samples and standards were analyzed repeatedly to determine the accuracy and precision of analysis; these replicate measurements show accuracy and analytical reproducibility of 10% or less for all three major elements.
Table 1. Aerosol sample name collected during dust storm, the date of collection, aerosol concentration, Al and Fe concentration, dust concentration and dust flux.
Table 2. Samples collected during dry period of 2012–15 and their total concentration. The dust concentration, percentages and flux were also calculated using Al concentration in the samples.
Aerosol concentration and flux
(A) Aerosol concentration
Aerosol concentrations of total suspended particulates (TSP) were calculated by measuring the mass of the aerosol particles collected on the filter, normalized by the volume of air sampled. All filters were equilibrated with ambient temperature and relative humidity during their weighing. The mass of the TSP collected in the filter was measured gravimetrically. The weighing balance is calibrated periodically and the pressure, temperature, and relative humidity were maintained at appropriate conditions before weighing the filters.
(B) Dry and wet deposition flux
Dry deposition fluxes (Fd) were calculated based on the concentration of aerosols (C) and the depositional velocity of the particles (Vd):
Depositional velocity of aerosol particles was calculated based on Stokes law:
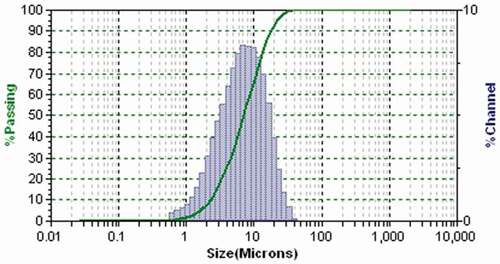
where ρp is the density difference of the dust particle to the air and the density of the dust is considered 2.6 g/cm3 (Chen and Li Citation2011; Schepanski, Tegen, and Macke Citation2009; Vasilatou et al. Citation2017), d is the aerodynamic diameter of the particle, g is the gravity acceleration (in m/s2) constant and η is the viscosity of air (in kg m−1·s−1). To measure the size distribution of the dust that reaches NEAS, the wet deposition samples of 2013 were analyzed by using the Laser Particle Size Analyzer. A mono-modal distribution was observed with a median diameter of 7.96 µm (), which can be considered as “d”, the aerodynamic diameter of the dust particles to calculate settling velocity using Equationequation (3)(3)
(3) . Since dust particles are irregular in shape and the shape of the particles affects the drag force and settling velocity, the dynamic shape factor (χ) has been applied to the above equation. The dynamic shape factor of Quartz (χ = 1.36) (Alexander et al. Citation2016; Davies Citation1979; Reid et al. Citation2003) has been used in this study since the value for silicates is not available in the literature. So the depositional velocity of dust particles after applying the dynamic shape factor becomes
Figure 2. The size distribution of wet deposited dust collected during SW monsoon of 2013.
This equation provides Vd of 335 m day−1 and fluxes for the dry deposition were calculated by using Equationequation (1)(1)
(1) . The settling velocity derived in this work is lower than those reported (~1000 m day−1) by Shelley, Morton, and Landing (Citation2015), Anderson et al. (Citation2016) and Bergametti et al. (Citation2018) in the eastern Atlantic station and western Africa region located close to the Saharan Desert. Also, while estimating the deposition velocity, several factors viz. wind friction velocity, turbulence and molecular diffusion, can impact on its calculation and introduce large uncertainty in its values (Bergametti et al. Citation2018). In this study, the estimated settling velocity is relatively low compared to those reported previously. In addition, the sampling site in this study is located far away (more than 1000 km) from the source region which may result in transport of finer dust, thus the calculated Vd can be a better representative for this study.
The data on the Al concentrations in the samples were used to estimate the dust concentrations and fluxes for the aerosol samples by presuming that the Al in mineral dust is the same as in the Upper Continental Crust (UCC) (UCC with Al content of 8.04%; McLennan Citation2001). It was reported that the wet deposited particles collected after filtration were mainly composed of mineral dust (Ramaswamy, Muraleedharan, and Babu Citation2017; Suresh et al. Citation2021b), which could provide an upper limit of dust flux.
Results and discussion
The details of the dust storm samples and the wet deposition samples collected are given in . The dust storms over the NEAS are more frequent in the summer than in the winter season (Kumar, Suresh, and Rahman Citation2020). Aerosol samples were collected for dust concentration in the 12 dust storms that reached the sampling station (Goa). The dust deposition flux of the 12 major dust storms (details given in ) has been calculated. The wet deposition flux has been calculated directly by measuring the weight of the particulates collected from the rainwater (2013–2015) since these particles form the total eolian flux.
Aerosol concentrations over the eastern Arabian Sea
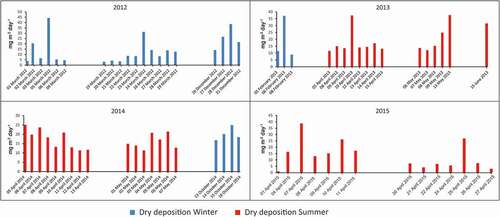
The aerosol concentration over Goa for the years 2012–15 ranges from 1 to 356 µg m−3 () with an average of 101 µg m−3, the majority of the maximum aerosol concentration are observed during the passage of dust storms over the NEAS. The average aerosol concentrations during the study period are higher than the average aerosol concentrations (80.9 ± 29.5 µg m−3; Agnihotri et al. Citation2015) measured at this site from December 2009 to January 2011. The seasonal variability in dry deposited samples is assessed by classifying months into two seasons viz. summer (April and May) and winter (October–March). However, only WDP was collected during the monsoon period (June–September). For logistic reasons, TSP samples were not collected during May 2012, December 2014, and the post-monsoon period of 2015 (October – December). During summer, the aerosol concentration for the period 2012–15 varied significantly from 1 to 356 µg/m3 (average 92 ±54 µg/m3), while during the winter period the concentration varied between 2 and 298 µg/m3 (average 102 ±49 µg/m3). The aerosol concentration during the post-monsoon period varied between 13 and 208 µg/m3 (average 79 ±34 µg/m3).
Figure 3. The aerosol concentrations over the eastern Arabian Sea for the years 2012 to 2015 (x-axis given in months). The maximum concentrations were observed during the dust storm events. The gap between the bars are the days with no sampling. There was no sampling between June and October (SW monsoon season).
Dust percentage in total aerosol concentration
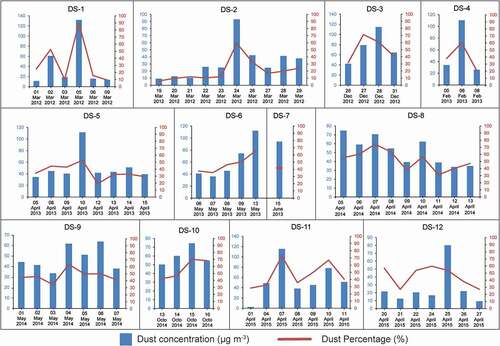
The dust concentrations and dust percentage show an increasing trend from the samples collected before dust storm and highest when the dust storm was passed over the sampling site and then decreases after waning of dust storm, indicating the influence of the dust storms on total dust concentrations at the sampling site (). Dust concentrations vary greatly during the dust storm days, ranging from 60 to 132 µg m−3 () with an average of 85 ± 22 µg m−3. The dust concentrations observed during winter and summer dust storms averaged around 91 ± 24 µg m−3 and 81 ± 20 µg m−3, respectively. Based on this observation, it is difficult to conclude the role of the proximity of dust source region in playing any role in dust concentration over the NEAS. Nevertheless, relatively higher dust is seen in winter when the SW Asia (relatively proximal to our study site) is dominant source compared to summer when the Arabian Peninsula is dominant (See Supplementary material S2 for back-trajectories) (Kumar, Suresh, and Rahman Citation2020). This seasonal variability in the dust sources is important in understanding the influence of the different dust sources at different times of the year. The dust contribution to the total aerosol mass concentrations is relatively higher for the dust storm days (41% to 90% with an average of 60 ± 11%) (), whereas it is relatively low for the pre and post dust storm samples (32 ± 14%). The dust storm DS-7 was collected during the SW monsoon of 2013 when there was a monsoon break (no rain for 3–4 days) and the dust contribution to the total aerosol concentration was 41% which is lower than the average dust contribution. The reason for the low dust contribution during the monsoon is attributed to the high altitude transport of dust during this period (Ramaswamy, Muraleedharan, and Babu Citation2017) in comparison to those during dry period (Kumar, Suresh, and Rahman Citation2020). Due to strong monsoon winds, aerosols in the lower altitudes are typically dominated by sea-salt. The average dust percentages in the dust storm samples are much higher than the dust percentages measured in the Arabian Sea (44 ± 15%) reported by Kumar, Sarin, and Sudheer (Citation2008). The dust percentages for the winter dust storms (excluding pre and post dust storm samples) (average = 67 ± 13%) are higher than the summer dust storms (average = 58 ± 9%), however the average dust percentage for the pre and post dust storm samples of winter (23 ± 13%) is lower than the summer (39 ± 9%). It shows that the summer season in the NEAS is dustier than the winter period. Although some of the normal day’s samples have shown high dust percentages, their aerosol concentrations were too low to be considered as dust storm samples ().
Figure 4. The dust concentration (blue bars) for the twelve dust storm periods along with their dust percentages (red solid line) over the total aerosol concentration. Left hand y-axis is dust concentration right hand y-axis is dust percentage of total aerosol load. Most of the dust storm samples have dust concentrations of more than 50% (except DS-7) of the total aerosol concentration, showing the influence of the dust storms in the aerosol concentrations.
Dry and wet deposition dust fluxes over the eastern Arabian Sea
The aerosol dry deposition fluxes for the samples analyzed during the pre, post, and dust storm samples show a large variation, ranging from 1 to 44 mg m−2 day−1 (). The highest dust flux (44 mg m−2 day−1) was measured during the dust storm of 05 March 2012 which originated from the Helmand basin of SW Asia (indicated by back trajectory analyses; Supplementary Figure S2) (Kumar, Suresh, and Rahman Citation2020). The dust flux for the pre and post dust storm samples shows a large variation with a minimum of 1 mg m−2 day−1 to a maximum of 22 mg m−2 day−1 (average = 11 ±5 mg m−2 day−1). The dry deposition flux of the dust storm days varied from 20–44 mg m−2 day−1 (average of 28 ± 7 mg m−2 day−1) (), the dust flux during the dust storm samples is twice that of the pre and post-storm samples, indicating the role of the dust storm in the deposition flux of dust to the Arabian Sea during the dry seasons.
Figure 5. Dry deposition flux (mg m−2 day−1) for the twelve dust storms observed for the years 2012 to 2015. The samples collected before during and post the dust plume pass over the NEAS are given. In most of the samples, the dust deposition during the dust storm periods is high when the dust plumes pass over NEAS. Blue and Red bars represent the dry deposition flux during winter and summer, respectively.
Out of the twelve dust storms observed during the study period, relatively higher dust fluxes were witnessed during the summer period, except for the year 2012, during which no dust storms were observed in the summer. The dust flux for the summer period varied from 189 to 272 mg m−2 day−1 with a total flux of 729 mg m−2, whereas the dust flux in the winter period varied from 57 to 272 mg m−2 day−1 with the total flux of 431 mg m−2 (). The higher dust flux during the summer season is mainly because of the greater number of dust storms that move toward the NEAS.
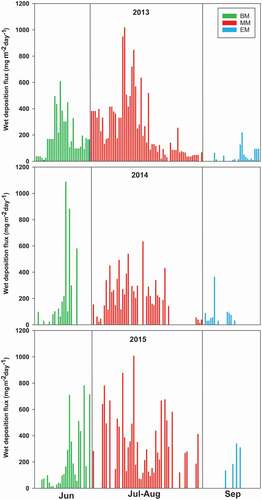
The wet deposition fluxes during the SW monsoon for the years 2013 to 2015 ranged from 8 to 1089 mg m−2 day−1 (), with an average of 240 ± 220 mg m−2 day−1. During the SW monsoon, it rains almost every day in the sampling station (Goa) (Ramaswamy, Muraleedharan, and Babu Citation2017) and the wet deposition is the dominant process for dust removal during SW monsoon season in this region (peninsular India). The three-year average flux for the beginning of the monsoon is 215 ± 226 mg m−2 day−1 which increases to an average of 282 ± 220 mg m−2 day−1 in the middle of the monsoon (during July and August). At the end of the monsoon, the average deposition flux decreased to 98 ± 95 mg m−2 day−1. This trend in the deposition flux is mainly due to the decrease in the rainfall and the availability of dust-bearing winds, which change from the beginning to the end of monsoon (Suresh et al. Citation2021a), that supply a large amount of dust to the Arabian Sea during the SW monsoon period. Also, one of the reasons for this clear trend in the wet deposition flux is due to the steady flow of the wind systems such as the SW monsoon winds, summer shamal winds, the red Sea winds, and the Levar winds (Ramaswamy, Muraleedharan, and Babu Citation2017). The dust-carrying winds viz. Shamal winds and the Red Sea winds are more active during the beginning and middle of the monsoon, in comparison to the end of the monsoon period. The wind intensity, availability of dust-bearing winds play a major role in the wet deposition fluxes in this region. The average wet deposition fluxes for the years 2013 to 2015 are about eight to ten times higher than the dry deposition fluxes, which highlights the importance of wet deposition in this region. Also, it has to be noted that the aerosol dust flux reported in this study is only for the twelve dust storm periods, during which the dust and aerosol concentrations are high. In comparison, during the SW monsoon season, the dust emission is continous (Suresh et al. Citation2021a; Ramaswamy, Muraleedharan, and Babu Citation2017) and the wet deposited particulates were collected for all the rainy days ().
Table 3. Samples collected during wet deposition period of 2013–15 and dust flux along with of Al, Fe and Ti percentages are given below.
Figure 6. Wet deposition flux (mg m−2 day−1) for the years 2013, 2014, and 2015. The monsoon season is divided into beginning (BM), mid (MM) and end of the monsoon (EM). The wet deposition is high during the mid of monsoon period, and low during the end of the monsoon. The rainfall is high and the dust-bearing winds like summer shamal winds and the Red sea winds are active during the mid monsoon period affects the wet deposition flux.
From the above discussion, it is evident that the wet deposition fluxes are significantly higher than the dry deposition fluxes over the study region. We further compared our deposition flux data reported from other coastal, marine as well as continental locations. Very high deposition flux values (average = 6.380 g m−2 d−1) have been reported by Hamza et al. (Citation2011), from a coastal location in the UAE, which is in close proximity to the dust source region. In contrast, very low flux values (0.66 mg m−2 day−1) have been reported from a remote location of Kerguelen Island in the Southern Ocean (Heimburger, Losno, and Triquet Citation2013). The dust flux in this study is very low compared with the UAE (which is one of the major dust source regions), however, very low as compared to those observed at Kerguelen Island. These observations indicate the importance of favorable meteorological conditions, particularly the wind speed and direction, in controlling the dust flux in the NEAS. The spatial variation of dust flux over the marine region is well demonstrated by Vincent et al. (Citation2016), which reported large variability in dust flux from east to west with higher flux in the east (4.2–100 g m−2 year−1) in contrast to the west (2.2 to 16 g m−2 year−1). Such variability is attributed to the wind pattern and intensity as well as the proximity of dust sources to the sampling location. Vincent et al. (Citation2016) have also highlighted higher wet deposition fluxes as compared to dry deposition fluxes, similar to our study.
Elemental composition of the dust
To characterize the aerosols over the NEAS, crustal elements viz. Al, Fe, and Ti were measured in aerosol samples collected before, during and post-dust storm days. The elemental ratios for the major dust storms and wet deposition of 2013 were already reported by Kumar, Suresh, and Rahman (Citation2020) and Suresh et al. (Citation2021a), and in this study, we try to compare them with the pre and post dust storm samples. It is to be noted that Kumar, Suresh, and Rahman (Citation2020) have not measured Ti in the dust storm samples, and only Fe/Al is compared with the pre and post dust storm samples in that work. The Fe was found to correlate significantly (r2 = 0.77; ) with Al in the dust storm samples reported by Kumar, Suresh, and Rahman (Citation2020), which were used as a tracer for crustal contribution in the aerosol compositions indicating their crustal origin (Kumar and Sarin Citation2009; Kumar, Suresh, and Rahman Citation2020; Suresh et al. Citation2021a). The Fe and Ti concentrations for the pre and post dust storm samples varied from 0.11 to 9.18 µg m−3 with an average of 2.8 ±1.2 µg m−3 for Fe and 0.02 to 1.87 µg m−3 with an average of 0.38 ± 0.33 µg m−3 for Ti. The Fe/Al ratio varied from 0.11 to 4.40 (Av = 0.77; SD = 0.79) for the pre and post dust storm samples, whereas Fe/Al for the dust storm samples varied from 0.28 to 0.66 (Av = 0.44; SD = 0.10). The average Fe/Al ratio of the dust storm samples is similar to the UCC of 0.44 (Taylor and Mclennan Citation1985) indicating that these dust storm samples are mainly derived from the lithogenic fraction.
Figure 7. The scatter plots showing correlation analysis of Fe vs Al for the dust storm (a) and pre and post dust storm samples (b). Plots (c) and (d) show the Fe Vs Al and Ti Vs Al for the wet deposition samples of 2014 and 2015, respectively. The data points given as square boxes (d) are not taken for correlation calculation.
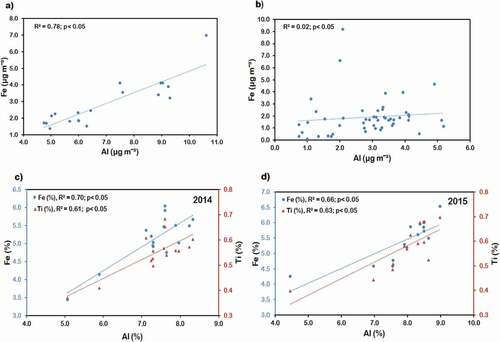
The Ti/Al ratio varied from 0.03 to 0.9 (Av = 0.14; SD = 0.14). The pre and post dust storm samples shows very poor correlation for Fe/Al and Ti/Al (r2 = 0.016; r2 = 0.091 respectively ), suggesting contribution from the non-crustal sources. Since most of the dry deposited aerosol samples were collected during the pre and post-monsoon period, the aerosol samples might be impacted from the anthropogenic aerosols from local sources as well as those transported from the Indo-Gangetic plains toward the Arabian Sea (Kaushik et al. Citation2021).
The elemental composition (Fe, Al and Ti) of particulates measured in wet deposited dust for the three year are provided in . Wet deposited samples for the 2014 and 2015 monsoon months show a relatively homogeneous Fe/Al ratio with an average of 0.70 and 0.72 for 2014 and 2015, respectively. All the wet deposited samples show enriched Fe/Al from the UCC value (0.44; McLennan Citation2001; Taylor and Mclennan Citation1985), which may be due to the dust contribution during the SW monsoon season from the NE African sources which are abundant in Fe-rich basalts. Similarly, Ti/Al ratios did not exhibit any significant temporal variability, with an average ratio of 0.07 for both 2014 and 2015 samples. These ratios are well within the range of the value given by Suresh et al. (Citation2021a) for the wet deposited samples of 2013. Also, the correlation between Fe, Ti to Al of the wet deposited samples of 2014 and 2015 (Fe/Al = 0.70 and 0.76; Ti/Al = 0.60 and 0.71) are similar to the 2013 samples (Fe/Al = 0.75 and Ti/Al = 0.66) reported by Suresh et al. (Citation2021a). The Fe and Ti correlate well with Al for the wet deposited samples, indicating a similar origin and clearly highlighting the dominance of dust in the wet particulate matter. Although the non-dust storm aerosol samples were also enriched in Fe than the UCC like the wet deposited samples, their poor correlation with Al shows the non-crustal origin indicating that natural dust is not the only source for Fe, Ti and Al during non-dusty periods (Kumar, Sarin, and Srinivas Citation2010).
Summary
In this study, the dust concentration, their dry and wet deposition fluxes were estimated for the twelve dust storms events (pre, post and during) that reached the NEAS (2012–2015) and those collected during the SW monsoon season of the years 2013–2015. The collected dust samples (wet and dry) were characterized using major elements (Al, Fe, and Ti) and their ratios. Further, we have assessed long-term seasonal variability in dust fluxes as well as their elemental characteristics.
The dust storms toward the NEAS are more frequent during the summer season (April and May) than the winter season (October to March) during the study period, and most of these dust storms are mainly influenced by the western disturbances. The dust deposition is also higher during the summer months than the winter months for all the dust storms that reached the NEAS. The wet deposition occurs mostly during the SW monsoon period (June to September) and the dust deposition for the three years 2013, 2014, and 2015 are 208, 204, and 308 mg m−2 day−1 respectively. The wet deposition flux is maximum at the middle of the monsoon and minimum at the end of the monsoon. The favorable wind pattern as well as high winds in the source regions play a major role in the wet deposition fluxes in this region. Also, the wet deposition fluxes were significantly higher than the dry deposition fluxes. The non-dust storm samples show large variability in Fe/Al values as compared to dusty day samples (which average around UCC values) suggesting the influence of non-crustal sources during the pre and post dust storm period. Relatively enriched Fe/Al ratios (from UCC) were observed for wet deposited samples for all three years, however, a very significant correlation between Fe and Al was observed for theses samples. This suggests the dominance of crustal sources with characteristics different Fe/Al compositions.
The reported long-term data on dust fluxes, their elemental characteristics and associated seasonal variability at a regional scale are important to constrain the supply of nutrients to the Arabian Sea and have implication for the better understanding of surface water biogeochemical processes.
Suresh-et-al-dust-flux-Supplementary_material-Final.docx
Download MS Word (2.2 MB)Acknowledgments
Financial support for this research is by CSIR Project GEOSINK and CLICNIO (MLP1802). A.K. thanks the Department of Science and Technology, Govt. of India, for providing partial financial support under the INSPIRE Faculty scheme; IFA13-EAS-13 and SPLICE Program (Grant DST/CCP/Aerosol/85/2017(G)). Also, the researchers K. Suresh and Udisha Singh are thankful to the Department of Science and Technology for the funding through INSPIRE Research Fellowship (IF140405) and (IF180350). The authors gratefully acknowledge the NOAA Air Resources Laboratory (ARL) for the provision of the HYSPLIT transport and dispersion model (http://www.ready.noaa.gov). The authors thank Robin John for help during the analyses of major elements in aerosol samples using ICP-OES.
Disclosure statement
No potential conflict of interest was reported by the authors.
Data availability statement
The authors confirm that the data supporting the findings of this study are available within the article as .
Supplementary material
Supplemental data for this paper can be accessed on the publisher’s website
Additional information
Funding
Notes on contributors
K. Suresh
K. Suresh is a Post-Doctoral Fellow at Physical Research Laboratory, Ahmedabad, India. His research focusses on atmospheric mineral dust characterization and their transport over the marine refgion.
Udisha Singh
Udisha Singh is a Ph.D. research scholar working in the field of Atmospheric Science at CSIR-National Institute of Oceanography, Goa, India.
Ashish Kumar Jha
Ashish Kumar Jha is Head of Department of Zoology, Hislop College, Nagpur, India. He works in the areas of trace metal composition and interaction in plants, carbon sequestration, litter decomposition, soil fauna and bee diversity.
Vishnu Murthy Matta
Vishnu Murthy Matta is a Professor working in the field of Marine Pollution at Goa University, Goa India.
A.K. Sudheer
A. K. Sudheer is a Scientist working in the field of Atmospheric aerosol and biogeochemistry at Physical Research Laboratory, Ahmedabad, India.
Ashwini Kumar
Ashwini Kumar is a Senior Scientist working in the field of Atmospheric Science at CSIR-National Institute of Oceanography, Goa, India.
References
- Agnihotri, R., S. G. Karapurkar, V. V. Sarma, K. Yadav, M. D. Kumar, C. Sharma, and M. V. S. N. Prasad. 2015. Stable isotopic and chemical characteristics of bulk aerosols during winter and summer seasons at a station in western coast of India (Goa). Aerosol. Air Qual. Res 15 (3):888–900. doi:10.4209/aaqr.2014.07.0127.
- Alexander, J. M., D. M. Bell, D. Imre, P. D. Kleiber, V. H. Grassian, and A. Zelenyuk. 2016. Measurement of size-dependent dynamic shape factors of quartz particles in two flow regimes. Aerosol. Sci. Technol 50 (8):870–79. doi:10.1080/02786826.2016.1200006.
- Anderson, R. F., H. Cheng, R. L. Edwards, M. Q. Fleisher, C. T. Hayes, K. F. Huang, and Y. Lu. 2016. How well can we quantify dust deposition to the ocean? Philos. Transact. Roy. Soc. A Math. Phys. Eng. Sci 374 (2081):20 150285. doi:10.1098/rsta.2015.0285.
- Aswini, M. A., A. Kumar, and S. K. Das. 2020. Quantification of long-range transported Aeolian dust towards the Indian peninsular region using satellite and ground-based data-a case study during a dust storm over the Arabian Sea. Atmos. Res 239:104910. doi:10.1016/j.atmosres.2020.104910.
- Bergametti, G., B. Marticorena, J. L. Rajot, G. Foret, S. C. Alfaro, and B. Laurent. 2018. Size‐resolved dry deposition velocities of dust particles: in situ measurements and parameterizations testing. J. Geophys. Res. Atmos 123 (19):11–080.
- Chen, J., and G. Li. 2011. Geochemical studies on the source region of Asian dust. Sci. China Earth Sci 54 (9):1279–301. doi:10.1007/s11430-011-4269-z.
- Das, S., S. Dey, S. K. Dash, G. Giuliani, and F. Solmon. 2015. Dust aerosol feedback on the Indian summer monsoon: Sensitivity to absorption property. J. Geophys. Res.-Atmos 120 (18):9642–52. doi:10.1002/2015JD023589.
- Davies, C. N. 1979. Particle-fluid interaction. J. Aerosol. Sci 10 (5):477–513. doi:10.1016/0021-8502(79)90006-5.
- Duce, R. A., and N. W. Tindale. 1991. Atmospheric transport of iron and its deposition in the ocean. Limnol. Oceanogr 36 (8):1715–26. doi:10.4319/lo.1991.36.8.1715.
- Guieu, C., M. Al Azhar, O. Aumont, N. Mahowald, M. L´evy, C. Eth´e, and Z. Lachkar. 2019. Major impact of dust deposition on the productivity of the Arabian Sea. Geophys. Res. Lett 46 (12):6736–44. doi:10.1029/2019GL082770.
- Hamza, W., M. R. Enan, H. Al-Hassini, J. B. Stuut, and D. De-Beer. 2011. Dust storms over the Arabian Gulf: A possible indicator of climate changes consequences. Aquat. Ecosyst. Health Manag 14 (3):260–68. doi:10.1080/14634988.2011.601274.
- Heimburger, A., R. Losno, and S. Triquet. 2013. Solubility of iron and other trace elements in rainwater collected on the Kerguelen Islands (South Indian Ocean). Biogeosciences 10 (10):6617–28. doi:10.5194/bg-10-6617-2013.
- Jickells, T. D., Z. S. An, K. K. Andersen, A. R. Baker, G. Bergametti, N. Brooks, and H. Kawahata. 2005. Global iron connections between desert dust, ocean biogeochemistry, and climate. Science 308 (5718):67–71. doi:10.1126/science.1105959.
- Kaskaoutis, D. G., E. E. Houssos, F. Solmon, M. Legrand, A. Rashki, U. C. Dumka, … R. P. Singh. 2018. Impact of atmospheric circulation types on southwest Asian dust and Indian summer monsoon rainfall. Atmos. Res 201:189–205. doi:10.1016/j.atmosres.2017.11.002.
- Kaushik, A., A. Kumar, M. A. Aswini, P. P. Panda, G. Shukla, and N. C. Gupta. 2021. Seasonal variation in chemical composition of size-segregated aerosols over the Northeastern Arabian Sea. Front. Environ. Sci. 8:619174.
- Körtzinger, A., J. C. Duinker, and L. Mintrop. 1997. Strong CO2 emissions from the Arabian Sea during south‐west monsoon. Geophys. Res. Lett 24 (14):1763–66. doi:10.1029/97GL01775.
- Kumar, A., M. M. Sarin, and A. K. Sudheer. 2008. Mineral and anthropogenic aerosols in Arabian Sea–atmospheric boundary layer: sources and spatial variability. Atmos. Environ 42 (21):5169–81. doi:10.1016/j.atmosenv.2008.03.004.
- Kumar, A., and M. M. Sarin. 2009. Mineral aerosols from western India: Temporal variability of coarse and fine atmospheric dust and elemental characteristics. Atmos. Environ 43 (26):4005–13. doi:10.1016/j.atmosenv.2009.05.014.
- Kumar, A., M. M. Sarin, and B. Srinivas. 2010, August 20. Aerosol iron solubility over Bay of Bengal: Role of anthropogenic sources and chemical processing. Mar. Chem 121(1–4): 167–75. doi:10.1016/j.marchem.2010.04.005.
- Kumar, A., K. Suresh, and W. Rahman. 2020. Geochemical characterization of modern Aeolian dust over the Northeastern Arabian Sea: Implication for dust transport in the Arabian Sea. Sci. Total Environ 729:138576, 1–16.
- L´eon, J. F., and M. Legrand. 2003. Mineral dust sources in the surroundings of the North Indian Ocean. Geophys. Res. Lett 30 (6). doi:10.1029/2002GL016690.
- Li, Y., J. T. Randerson, N. M. Mahowald, and P. J. Lawrence. 2021. Deforestation strengthens atmospheric transport of mineral dust and phosphorus from North Africa to the Amazon. J. Clim 34 (15):6087–96.
- Mahowald, N. M., A. R. Baker, G. Bergametti, N. Brooks, R. A. Duce, T. D. Jickells, N. Kubilay, J. M. Prospero, and I. Tegen. 2005. Atmospheric global dust cycle and iron inputs to the ocean. Global Biogeochem. Cycl 19(4), GB4025. doi:10.1029/2004GB002402.
- McLennan, S. M. 2001. Relationships between the trace element composition of sedimentary rocks and upper continental crust. Geochem. Geophys. Geosys 2 (4). doi:10.1029/2000GC000109.
- Okin, G. S., N. Mahowald, O. A. Chadwick, and P. Artaxo. 2004. Impact of desert dust on the biogeochemistry of phosphorus in terrestrial ecosystems. Global Biogeochem. Cycl 18 (2). doi:10.1029/2003GB002145.
- Ramaswamy, V., P. M. Muraleedharan, and C. P. Babu. 2017. Mid-troposphere transport of Middle-East dust over the Arabian Sea and its effect on rainwater composition and sensitive ecosystems over India. Sci. Rep 7 (1):13676. doi:10.1038/s41598-017-13652-1.
- Rashki, A., D. G. Kaskaoutis, and A. Sepehr. 2018. Statistical evaluation of the dust events at selected stations in Southwest Asia: From the Caspian Sea to the Arabian Sea. Catena 165:590–603. doi:10.1016/j.catena.2018.03.011.
- Rashki, A., D. G. Kaskaoutis, A. Mofidi, F. Minvielle, I. Chiapello, M. Legrand, and P. Francois. 2019. Effects of Monsoon, Shamal and Levar winds on dust accumulation over the Arabian Sea during summer–The July 2016 case. Aeol. Res 36:27–44. doi:10.1016/j.aeolia.2018.11.002.
- Rashki, A., N. J. Middleton, and A. S. Goudie. 2021. Dust storms in Iran–Distribution, causes, frequencies and impacts. Aeol. Res 48:100655. doi:10.1016/j.aeolia.2020.100655.
- Reid, J. S., H. H. Jonsson, H. B. Maring, A. Smirnov, D. L. Savoie, S. S. Cliff, … S. C. Tsay. 2003. Comparison of size and morphological measurements of coarse mode dust particles from Africa. J. Geophys. Res. Atmos 108 (D19). doi:10.1029/2002JD002485.
- Sarma, V. V. S. S., M. D. Kumar, and M. D. George. 1998. The central and eastern Arabian Sea as a perennial source of atmospheric carbon dioxide. Tellus B Chem. Phys. Meteorol 50 (2):179–84. doi:10.3402/tellusb.v50i2.16095.
- Schepanski, K., I. Tegen, and A. Macke. 2009. Saharan dust transport and deposition towards the tropical northern Atlantic. Atmos. Chem. Phys 9 (4):1173–89. doi:10.5194/acp-9-1173-2009.
- Shelley, R. U., P. L. Morton, and W. M. Landing. 2015. Elemental ratios and enrichment factors in aerosols from the US-GEOTRACES North Atlantic transects. Deep sea research part II. Topical Stud. Oceanogr 116:262–72. doi:10.1016/j.dsr2.2014.12.005.
- Suresh, K., A. Kumar, V. Ramaswamy, and C. P. Babu. 2021b. Seasonal variability in aeolian dust deposition fluxes and their mineralogical composition over the Northeastern Arabian Sea. Int. J. Environ. Sci. Technol 19:1–14.
- Suresh, K., U. Singh, A. Kumar, D. Karri, A. Peketi, and V. Ramaswamy. 2021a. Provenance tracing of long-range transported dust over the Northeastern Arabian Sea during the southwest monsoon. Atmos. Res 250:105377. doi:10.1016/j.atmosres.2020.105377.
- Taylor, S. R., and S. M. McLennan. 1985. The continental crust: Its composition and evolution, 312. Boston: Blackwell Scientific.
- Tegen, I. 2003. Modeling the mineral dust aerosol cycle in the climate system. Quat. Sci. Rev 22:1821–34.
- Tindale, N. W., and P. P. Pease. 1999. Aerosols over the Arabian Sea: atmospheric transport pathways and concentrations of dust and sea salt. Deep-sea research. II top. Stud. Oceanogr 46 (8–9):1577–95.
- Vasilatou, V., M. Manousakas, M. Gini, E. Diapouli, M. Scoullos, and K. Eleftheriadis. 2017. Long term flux of Saharan dust to the Aegean sea around the Attica region, Greece. Front. Marine Sci 4:42. doi:10.3389/fmars.2017.00042.
- Vincent, J., B. Laurent, R. Losno, E. Bon Nguyen, P. Roullet, S. Sauvage, … G. Bergametti. 2016. Variability of mineral dust deposition in the western Mediterranean basin and south-east of France. Atmos. Chem. Phys 16 (14):8749–66. doi:10.5194/acp-16-8749-2016.