
ABSTRACT
The default groundwater-to-indoor air attenuation factor (AF) of 10−3 (0.001) to assess the vapor intrusion (VI) pathway and generate VI screening levels for groundwater was developed by the United States Environmental Protection Agency (EPA) based on chlorinated volatile organic compound (VOC) indoor air and groundwater data collected in residential buildings and compiled in EPA’s 2012 VI database. In their VI guidance published in 2015, EPA recognized that this default AF may be overly conservative for nonresidential buildings. In 2015, the Department of Defense (DoD) began developing a first-of-its-kind VI database to assess AFs at commercial and industrial buildings at DoD installations and support the development of alternative generic AF values. This database was expanded in 2019 to include 76 buildings at 22 DoD installations across the United States and is comparable in size to the EPA VI database. The DoD database includes chlorinated VOC data from groundwater and indoor air samples collected from multiple sampling zones within these buildings. Empirical groundwater-to-indoor air AFs were calculated using similar screening methods employed by EPA, including a source strength screen, to filter out potential background source contributions unrelated to VI. Analysis of indoor air-groundwater data pairs found that there is more attenuation occurring from groundwater to indoor air in DoD commercial and industrial buildings relative to residential buildings and that the DoD buildings’ AFs are one to four orders of magnitude lower than EPA’s residential-based default of 10−3. The results support the use of a generic groundwater AF of 10−4 (0.0001) to support VI assessment and develop groundwater screening levels specific to large commercial and industrial buildings as an alternative to the residential default AF.
Implications: The use of groundwater-to-indoor air attenuation factors (AFs) is a key component of vapor intrusion (VI) pathway assessments and VI screening-level development for groundwater. Currently, the United States Environmental Protection Agency (EPA) and many state regulatory agencies use a default groundwater AF of 10−3 (0.001) based on chlorinated volatile organic compound (VOC) data collected in residential buildings. VI assessment data collected at Department of Defense (DoD) installations indicate that there is significantly more groundwater-to-indoor air attenuation occurring at DoD commercial and industrial buildings. For that reason, the default AF of 10−3 results in groundwater screening levels that are overestimating VI-related risks in these types of building. The DoD data support the use of a generic groundwater AF of 10−4 (0.0001) for conducting VI assessment and developing groundwater screening levels at large commercial and industrial buildings.
Introduction
Vapor intrusion (VI) is the process by which vapor-forming chemicals, such as trichloroethene (TCE), tetrachloroethene (PCE), and other volatile organic compounds (VOCs), can migrate from the subsurface into the indoor air of overlying buildings. VOC concentrations decrease during migration as a result of subsurface diffusion processes coupled with the dilution that occurs when VOC vapors enter a building and mix with indoor air (Johnson and Ettinger Citation1991). The aggregate effect of these physical and chemical attenuation mechanisms can be quantified through the use of a VI attenuation factor (AF), which is defined as the unitless ratio of the indoor air concentration arising from VI to the subsurface vapor concentration at the point or depth of interest in the VI pathway (EPA Citation2012a). Subsurface vapor concentrations can be measured directly under a building as subslab soil gas (SSSG), measured exterior to the building at varying depths in the unsaturated zone, or derived from groundwater concentrations by converting the dissolved concentration to a vapor concentration using Henry’s law (EPA Citation2012a). A previous paper focused on the SSSG-to-indoor air AFs (Hallberg et al. Citation2021). The analyses presented in this paper focus on the groundwater-to-indoor air AFs (also referred to as groundwater AFs). These AFs are frequently used during VI assessments to predict potential VI-related indoor air concentrations in buildings overlying VOC plumes on the basis of existing groundwater quality data.
Generally, VI investigations involve the collection of indoor air and SSSG samples inside buildings. The indoor air samples are compared to indoor air screening levels to assess whether there is a risk to building occupants. The SSSG samples are used to determine if there is a VI source beneath the building slab and to confirm whether the VOC concentrations observed in indoor air are consistent with those observed in SSSG, such that they can reasonably be attributed to VI rather than background indoor or outdoor sources of VOCs, which are commonly encountered during VI investigations (EPA Citation2011a, Citation2015a). Prior to conducting building investigations, VI practitioners commonly determine which buildings need to be investigated based on groundwater quality data and the buildings’ positions relative to the VOC plume in groundwater. Typically, the buildings are “screened in” and need to be investigated if they overlie or are located proximate to groundwater, where VOC concentrations in groundwater near the water table exceed certain VI screening levels. To define these VI screening levels in groundwater, an assumption is made that a conservative groundwater AF (i.e., in this context, a groundwater AF that generally overpredicts the indoor air concentration) can conservatively predict potential VI in the buildings of interest (EPA Citation2012a, Citation2015a).
To support the evaluation of groundwater quality data against VI screening levels, a conservative generic groundwater AF was developed by EPA based on data included in their VOC VI database (EPA Citation2012a, Citation2012b). This AF, 10−3 (0.001), was incorporated into the EPA VI screening level calculator (EPA Citation2021), which is used to develop groundwater screening levels that are protective of more sensitive subpopulations. The value of 10−3 corresponds to the 95th percentile AF of the EPA VI indoor air-groundwater dataset after applying several data screens to account for potential background contribution effects, meaning that 95% of the EPA indoor air-groundwater data pairs that passed the screens have a lower groundwater AF (i.e., exhibit more attenuation) than the generic value (EPA Citation2012a). For comparison, the median groundwater AF of the EPA database is 7 × 10⁻⁵, i.e., less than a tenth of the 95th percentile AF (EPA Citation2012a). In the analyses presented herein, as well as in the EPA VI database analyses, there is an assumption that the AF datasets are representative of the underlying populations, such that the descriptive statistics, including the upper percentiles, can be used for predictive applications. Some level of statistical confidence is implied, however, and the results presented herein should be understood as general trends that did not undergo formal statistical analysis. The use of upper percentiles, such as the 90th or 95th percentiles, is common to support risk assessment and screening level calculations, with the understanding that the combination of upper percentiles and safety factors (e.g., toxicity, risk target, and exposure duration) will result in residual risks that are negligible. For instance, the residential exposure duration used to compute the EPA VI screening levels in indoor air is 26 yr (EPA Citation2020a). This duration corresponds to the 90th percentile of the residential occupancy period in the United States; for perspective, the median residential occupancy period is 9 yr (EPA Citation2011b). Another example of upper percentile use is the concept of reasonable maximum exposure, defined by the EPA as the high-end of the exposure distribution, conceptually above the 90th percentile exposure but less than the 98th percentile exposure (EPA Citation2015b).
The EPA VI database is composed primarily of data from small residential structures. The resulting AFs, which are based solely on analyses conducted on chlorinated VOC data from residential buildings, have been shown to be overly conservative (i.e., the AFs will consistently overpredict indoor air concentrations) when applied to commercial or industrial buildings at United States Department of Defense (DoD) installations (Venable et al. Citation2015; Lutes et al. Citation2021). Moreover, analysis of a limited dataset of nonresidential buildings from the EPA VI database supports the expectation that there is more attenuation in those settings than in residential buildings (EPA Citation2012c).Footnote1 A generic groundwater AF that is unnecessarily conservative results in smaller groundwater screening levels, which themselves lead to additional buildings being unnecessarily screened in and requiring VI characterization where none should be needed.
In their 2015 VI guidance, EPA points to the expectation that larger nonresidential buildings have lower AFs than residential buildings (EPA Citation2015b). Considerations that support this expectation include building size and larger air exchange rate, which result in greater dilution of vapors that may enter from the subsurface; and thicker slabs, which are less prone to cracking and will exhibit lower soil gas entry rates as a result. For those reasons, several states have developed VI guidance documents that assume greater attenuation (i.e., lower groundwater AFs) for commercial or industrial buildings than for residential buildings (Indiana Department of Environmental Management Citation2012, Citation2021; Pennsylvania Department of Environmental Protection Citation2021; Wisconsin Department of Natural Resources Citation2018). EPA, however, has continued to recommend using the generic groundwater AF of 10−3 derived using residential buildings for use in nonresidential settings (EPA Citation2015b, Citation2021). EPA’s rationale is that commercial enterprises are commonly established in converted residential buildings, such that these buildings can be expected to exhibit AFs that are similar to those of residential buildings represented in the EPA VI database (EPA Citation2015b).
EPA’s guidance encourages the use of site-specific data and multiple lines of evidence when assessing VI potential. Due to the nature of DoD industrial buildings, and the significant differences in construction compared to residential buildings, a DoD commercial and industrial building VI database was created to better understand AFs and key variables influencing VI potential in those buildings (Venable et al. Citation2015; Lutes et al. Citation2021). The buildings included in this database are more representative of the type and construction of buildings located in DoD industrial areas than the residential buildings in the EPA VI database. The DoD VI database was also used to derive empirical AFs for use at DoD commercial and industrial buildings, including groundwater AFs and an upper percentile AF that can be used as a generic value for groundwater screening-level derivation. Although formal hypothesis testing was not conducted as part of this study, comparison of the AF distribution statistics, including AF percentiles and frequency diagrams, supports that there is more attenuation occurring in buildings from the DoD VI database than in the residential buildings from the EPA VI database, such that a lower generic AF is appropriate for DoD commercial and industrial buildings.
Methods
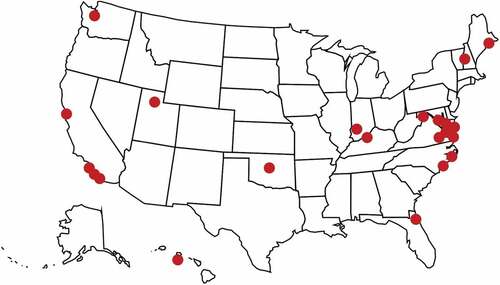
In 2015, DoD created a first-of-its-kind VOC VI database for commercial and industrial buildings under the Navy Environmental Sustainability Development to Integration (NESDI) program (Venable et al. Citation2015). The initial database contained 49 buildings from 12 DoD installations located in the United States. In 2019, the database was updated to include a total of 76 buildings from 22 DoD installations () and is comparable in size to the EPA VI database (Lutes et al. Citation2021). Pertinent information related to the DoD VI database has previously been published in supplemental information (Hallberg et al. Citation2021).
Figure 1. Location of DoD installations that are part of the DoD VI database of commercial and industrial buildings.
The data in the DoD VI database are limited to chlorinated VOCs; i.e., the data do not include petroleum VOCs, which tend to exhibit a lower degree of VI potential because of their greater attenuation due to biodegradation in the vadose zone (EPA Citation2015b; Interstate Technology and Regulatory Council Citation2014). The nine chlorinated VOCs considered for the statistical analyses () include compounds commonly associated with VI, either because of their historical use at DoD installations (e.g., TCE and PCE) or due to their occurrence in the subsurface as degradation products (e.g., cis-1,2-dichloroethene [cis-1,2-DCE]). The dataset was collected during the period 2008–2017 and includes indoor air, SSSG, and groundwater data associated with the various buildings. The vast majority of the indoor air samples – though not all – were collected in canisters and analyzed by the EPA TO-15 method. The sampling duration was typically 8 or 24 hr. Not all the sampling information in the DoD database was readily available, and the impact of sampling duration or analytical methods on the results was not evaluated.
Table 1. Selected VOC background levels in indoor air and resulting source strength screens for groundwater vapor data.
Chlorinated VOC sources are not specified but are typical of those found at DoD sites (e.g., storage tanks and spills) (EPA Citation2004). The building footprints range from 1,600 to 800,000 square feet. The database includes both commercial and industrial buildings built between 1905 and 2011, with uses typical of buildings at DoD installations (e.g., maintenance, offices, and storage) (Hallberg et al. Citation2021). As noted previously, buildings included in the EPA VI database are primarily single-family residences.
The majority of the installations included in the DoD VI database are located in states below 40 degrees north latitude, with the mid-Atlantic states and California well represented (). In contrast, the EPA VI database is predominantly composed of data collected in buildings located in colder climate states (e.g., New York, Colorado, and Massachusetts). Buildings in colder climates are generally considered to be more prone to VI concerns due to the occurrence of differential temperature-related stack effects during the heating season (EPA Citation2015b). The buildings included in the DoD VI database are constructed almost entirely with slab-on-grade foundations, while the EPA VI database includes a mix of structures with slab-on-grade foundations, crawlspaces, or basements. The depth to groundwater at the installations included in the DoD VI database is typically shallow – consistent with a coastal geography – with most installations having depths to water of 15 ft. or less (Hallberg et al. Citation2021). Similarly, most sites and buildings in the EPA VI database have depths to groundwater of less than 15 ft. (EPA Citation2012a). Shallow VOC-containing groundwater tends to be associated with greater VI concerns for overlying structures (EPA Citation2012a).
VI in large commercial or industrial buildings is commonly evaluated by defining specific sampling zones that are established based on several factors, including heating, ventilation, and air conditioning (HVAC) configuration, air exchange, and airflow. Each building in the DoD VI database had one or more sampling zones, and the data were evaluated on a sampling zone basis. A sampling zone can be defined as an enclosed, occupied location within a building where at least one indoor air sample has been collected. This sampling zone should have limited air mixing with other building zones and be defined so that air is expected to be reasonably well and rapidly mixed throughout the zone. The 76 buildings of the VI database each had one or more sampling zones (up to 14 in one building), totaling 274 zones.
For the analysis presented in this paper, indoor air-groundwater concentration data pairs were generated at the sampling zone level on a sampling event basis. This means that whenever indoor air and groundwater data were available for a given sampling event in a given sampling zone, one indoor air concentration and one groundwater concentration representative of the sampling event and sampling zone were paired and used for the AF statistical analysis.
For indoor air, the DoD VI database could often contain one or more indoor air samples per sampling zone, with the samples collected during single or multiple sampling events. Where more than one indoor air sample was collected within a sampling zone during a given sampling event, the arithmetic average of the indoor air concentrations was used. Each sampling event was considered individually, such that distinct indoor air average concentrations were calculated for distinct sampling events. Indoor air samples that had concentrations below detection limit were treated using two different approaches: either they were included in the analysis, with the analyte concentration taken equal to the detection limit in averaging calculations or statistical analyses; or they were excluded from the analysis, i.e., not included in the AF statistical analyses if the indoor air samples for a given sampling zone were all non-detect. In the latter case, only the concentrations of indoor air samples with detections were considered in averaging calculations or statistical analyses for sampling zones with a mix of detect and non-detect indoor air samples.
Where groundwater data were available and a groundwater-related VI pathway is suspected, a sampling zone was associated with a set of two groundwater concentrations: the maximum concentration measured in monitoring wells within 100 ft. of the sampling zone perimeter in any direction, and the maximum concentration beneath the sampling zone determined using an iso-concentration map. Only groundwater data obtained within a year of an indoor sampling event were paired with the indoor air data. Exceptions were made if the VOC plume beneath the sampling zone was stable over a multi-year period or if several indoor air sampling events were conducted over a period exceeding 1 year.
For certain buildings, different sampling zones could be associated with different sets of groundwater concentrations. This is because each sampling zone could have a different group of monitoring wells within 100 ft. of its perimeter, particularly for buildings with large footprints or multiple monitoring wells nearby. Once a set of monitoring wells was assigned to a sampling zone, a single set of groundwater concentrations was associated with that sampling zone, such that the same groundwater concentrations could be associated with several indoor air sampling events within that zone. In other words, the groundwater concentrations associated with a given sampling zone remained unchanged for different indoor air sampling events. Note that this approach differs from that used for the SSSG-to-indoor air AF analyses, where indoor air data were paired with SSSG data collected during the same sampling event (Hallberg et al. Citation2021).
For the purpose of screening indoor air-groundwater data pairs and computing AFs, the groundwater concentrations were converted to groundwater vapor concentrations, i.e., the vapor concentration in equilibrium with groundwater. This concentration was obtained by multiplying the groundwater concentration by the Henry’s law constant (EPA Citation2012a).
The procedures for accounting for potential background sources in the analysis of VI AFs were modeled closely on those used by EPA for their VI database (EPA Citation2012a). Similar to EPA’s approach, the procedure attempted to achieve a balance between adequately excluding data controlled by background sources while retaining as many data points as possible for analysis. The steps applied for screening out VOC indoor air-groundwater data pairs potentially affected by background sources are described below (refer to flow chart in ).
Figure 2. Procedure for screening indoor air-groundwater data pairs.
First, only data pairs with detectable groundwater concentrations for a given VOC were considered. This step corresponds to EPA’s “subsurface concentration screen” (EPA Citation2012a). This step is intended to remove data pairs from the analysis in which indoor air detections are unlikely to be related to VI from groundwater.Footnote2
Second, indoor air-groundwater data pairs were excluded in instances where there were no detections of a given VOC in SSSG; however, this screening was conducted at the building level. In other words, an indoor air-groundwater data pair associated with a sampling zone could be screened in without detection in SSSG if there was another zone in the building with a detection in SSSG. An indoor air-groundwater data pair with no detection in SSSG beneath the sampling zone or beneath other zones of the same building was screened out. This step is intended to remove data pairs from the analysis for which the groundwater concentration is not sufficiently high to result in detectable VOC concentrations in SSSG.
Third, information about background indoor or outdoor sources of VOCs provided in site investigation reports was reviewed. These reports often contained background source survey information, with a few explicitly identifying specific background VOC sources pertinent to the investigations. Cases where an indoor or outdoor source was identified were excluded from the analysis.
Fourth, indoor air-to-SSSG concentration ratios were calculated for different VOCs. VOCs with ratios that were different from the other analytes by one order of magnitude or more were assumed to indicate the potential influence of a background source. This step along with the third step is equivalent to EPA’s “data consistency screen” (EPA Citation2012a).
Fifth, indoor air data were compared with site-specific outdoor (ambient) air concentrations where available to assess the potential for background outdoor sources to influence measured indoor air concentrations. Data pairs where the indoor concentration were less than two times the measured outdoor air concentrations were excluded from the AF calculations given the likelihood that outdoor air is the primary source contribution to the measured indoor air concentrations.
The above five steps are equivalent to EPA’s “baseline screen” process (EPA Citation2012a).”
Sixth, cases where significant atypical preferential pathways were confirmed during the VI investigation were excluded from the AF calculations. An atypical preferential pathway is one by which vapors may move into a sampling zone in a less inhibited manner than the conventional pathway. Examples of conventional VI pathways include floor cracks and expansion joints. Examples of atypical preferential pathways include utility vaults and conduits, sewers, and elevator shafts (EPA Citation2015b). Note that the EPA VI database does not specifically attempt to screen data pairs that may be influenced by atypical preferential pathways (EPA Citation2012a). In fact, Yao et al. (Citation2018) have suggested that such pathways may have affected certain indoor air-groundwater data pairs in the EPA VI database and contributed to raising the generic groundwater AF.
Finally, a groundwater vapor “source strength screen” was implemented consistent with EPA’s data screening approach (EPA Citation2012a) to limit the influence of background VOC contributions on the AF statistical analysis. The source strength screen was applied to both the maximum measured and maximum interpolated groundwater vapor concentrations. This means that an indoor air-groundwater vapor data pair passing the source strength screen (i.e., retained for inclusion in the AF calculations) met the following conditions: the sampling zone had a well within 100 ft. where the groundwater vapor concentration was above the source strength screening concentration (i.e., the maximum measured groundwater vapor concentration exceeded the source strength screen); and part of the sampling zone was above an area of a groundwater plume with an interpolated concentration above the source strength screening concentration (i.e., the maximum interpolated groundwater vapor concentration exceeded the source strength screen). Note that when a sampling event for a given sampling zone passed the source strength screen, then all of the other sampling events for that zone also passed the source strength screen. This is because, as noted previously, the groundwater concentrations associated with a sampling zone remained the same for all sampling events.
The following groundwater vapor source strength screens were selected: 5,000 times the background indoor air concentrations for VOCs with known background reference levels in indoor air and 10,000 μg/m3 (i.e., a constant value screen) for VOCs without background levels (). These screens were established based on a source strength analysis to determine the subsurface source concentrations below which the influence of VI could not be reliably assessed (see “Results and discussion” section). When conducting their source strength analysis, the EPA used a groundwater vapor screen equal to 1,000 times the background concentrations, with the background concentration for a given VOC equal to the median of 90th percentile background levels obtained from a compilation of residential studies from the 1990s and 2000s (EPA Citation2012a, Citation2011a). These background levels were reviewed and adjusted based on a combination of studies in residential and commercial settings to be more representative of the nonresidential nature of the DoD buildings and the sampling period (2008–2017) (). A summary of the background-level analysis was provided previously for the nine VOCs of interest (Hallberg et al. Citation2021) and is not reproduced in this paper. These background levels were found to be generally consistent with results presented in a recently published study documenting sampling for background VOCs in nonresidential buildings (schools and offices) between 2013 and 2015 (Rago et al. Citation2021).
Statistical analyses conducted on the groundwater and indoor air data were developed using statistical software R (The R Foundation for Statistical Computing Citation2021; Wickham Citation2016).
Results and discussion
Following the screening process presented in the “Methods” section, a set of indoor air-groundwater data pairs that passed the baseline, atypical preferential pathway, and source strength screening criteria was generated for each of the nine chlorinated VOCs of interest in the DoD VI database. As an illustration for the screening steps described in the previous section, Table S1 shows the number of indoor air data points remaining after each step (note that certain indoor air data points are part of the same sampling event of a given sampling zone and are thus averaged prior to AF calculations). TCE and PCE, which frequently drive remedial or VI mitigation decisions at DoD facilities, are the VOCs with the highest detection frequencies and, along with cis-1,2-DCE, which is a common biodegradation breakdown compound of TCE and PCE, constitute most of the remaining dataset once the screening steps have been applied. Other VOCs shown in Table S1 either lack available indoor air-groundwater data pairs or tend to be screened out, primarily due to the absence of detection in SSSG (e.g., VC) or because the groundwater vapor concentration is too low to pass the source strength screen (e.g., 1,1-DCA).
shows a plot of the indoor air concentration as a function of the paired groundwater vapor concentration after applying the various screens described in the “Methods” section. Each data point on the figure represents an indoor air-groundwater data pair associated with a given sampling event in a given building sampling zone. The groundwater vapor concentration corresponds to the maximum groundwater concentration measured in monitoring wells within 100 ft. of the sampling zone as described in the “Methods” section. The indoor air concentration corresponds to the average indoor air concentration for the sampling zone and sampling event. Pairs with indoor air concentrations below detection limits were not included for this analysis.Footnote3 A total of 209 pairs are plotted, including 130 TCE, 37 PCE, and 25 cis-1,2-DCE pairs. Lines representing various groundwater AFs are also shown for reference, including the line corresponding to the EPA generic groundwater AF of 10−3 (EPA Citation2012a, Citation2015a).
Figure 3. Plot of indoor air-groundwater data pairs for the VOCs included in the analysis. Each data point represents the average indoor air and maximum measured groundwater concentrations for a given sampling event for a building sampling zone. Only pairs that passed the baseline, atypical preferential pathway, and source strength screening steps are included. The source strength screens for each VOC are shown in . There were no pairs meeting the various screening criteria for 1,1,1-TCA and 1,1-DCE (Table S1). Pairs with an indoor air concentration below detection limit are not shown. The two blue oblique lines represent the groundwater AF lines 10−4 and 1.0. The green line represents the EPA default groundwater AF of 10−3. Also shown is the linear best fit and associated equation, with “IA” and “GW” representing the indoor air and groundwater vapor concentrations, respectively.
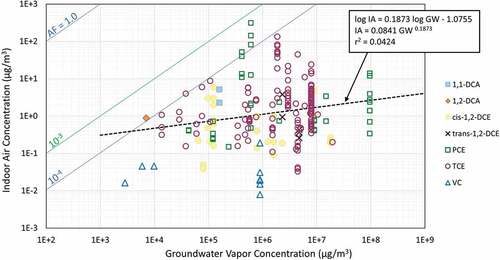
As shown in , none of the pairs are associated with an AF that exceeds EPA’s groundwater AF of 10−3, and few pairs exceed a groundwater AF of 10−4 (0.0001). This is notable because the AF of 10−3 derived by EPA corresponds to the 95th percentile AF obtained from statistical analysis of EPA’s residential data; an AF of 10−4 would correspond approximately to EPA’s 57th percentile residential AF (EPA Citation2012a, Citation2012c).
The data shown in also suggest that the AF values generally decrease with increasing groundwater vapor concentrations, a trend that has also been observed in the EPA VI dataset (Yao et al. Citation2013). The linear best fit of data () indicates that the indoor air concentration generally rises more slowly as a function of the groundwater vapor concentration than theory (i.e., a linear increase in concentration) would predict.
Table S2 provides statistics associated with the groundwater AFs obtained from the data pairs shown in . shows box-and-whisker plots associated with the Table S2 data. As shown, the 90th and 95th percentile AFs range from 1.1 × 10⁻⁶ to 1.2 × 10⁻⁴ and 1.4 × 10⁻⁶ to 1.5 × 10⁻⁴, respectively, depending on the VOC. Based on the analyses shown in , a groundwater AF of 10−4 (0.0001) is found to be appropriate to conservatively predict indoor air concentrations on the basis of groundwater data for DoD commercial and industrial buildings. This value of 10−4 corresponds to the 97th percentile AF of all the VOC data pairs shown in and is consistent with EPA’s upper percentile approach for risk management decisions (EPA Citation2015b).
Figure 4. Box-and-whisker plots summarizing groundwater AF distributions. N indicates the number of indoor air-groundwater data pairs remaining after applying the baseline, atypical preferential pathway, and source strength screening steps. Pairs with an indoor air concentration below detection limit are not included.
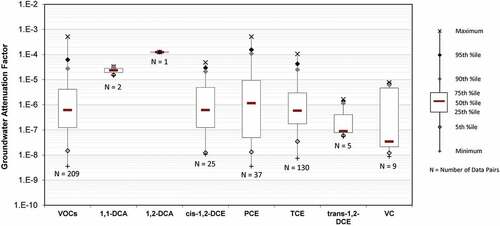
Table S2 and also show some differences in AF statistics between VOCs, despite the fact that chlorinated VOCs with generally similar fate and transport properties should be expected to have similar AF distributions. Possible explanations for these differences include sample size, the presence of unidentified atypical preferential pathways for certain sampling zones, or possible background source contributions to the indoor air for certain data pairs, particularly for PCE. Generally, lower groundwater AFs associated with vinyl chloride likely reflect the fact that VC can biodegrade aerobically in the vadose zone (Patterson et al. Citation2013; EPA Citation2012b). EPA has also reported differences in groundwater AFs between VOCs in their VI database analysis and hypothesized that these could be due to analytical uncertainty, particularly for concentrations close to the detection limits (EPA Citation2012a). The EPA database did not provide observations regarding VC as there was only one indoor air-groundwater pair that passed the various screens (EPA Citation2012a, Citation2012c).
As previously noted, the analyses presented in do not include indoor air-groundwater pairs for which the indoor air concentrations are below detection limits. To evaluate the effects of pairs with indoor air non-detects on the groundwater AF statistics, additional analyses were conducted by including these pairs using their detection limit as the indoor air concentration (i.e., indoor air non-detects taken at the detection limit). The expectation is that these additional pairs would be introducing relatively small AFs to the dataset (given a relatively low indoor air concentration corresponding to the detection limit) and may decrease the value of the upper percentile AFs (i.e., generally more attenuation). Note that in the case of the EPA VI database, the effect of indoor air non-detects is modest and would not modify EPA’s generic groundwater AF (EPA Citation2012a, Citation2012c).Footnote4
For the DoD VI database, the effect of accounting for indoor air non-detects (with the indoor air concentration taken equal to the detection limit) is relatively modest when evaluating the TCE and PCE indoor-groundwater data pairs (; Table S3). For these two VOCs, the statistical analyses completed using pairs for which the indoor air concentrations are below the detection limits do not substantially change the values of the 95th percentile AFs. For the TCE, the 95th percentile AF associated with detectable data in indoor air is 4.2 × 10⁻⁵ (130 data pairs). This value increases slightly to 4.3 × 10⁻⁵ when including data pairs from building sampling zones and sampling events for which there were no TCE detections in indoor air (56 additional data pairs, a total of 186 data pairs; Table S3). For PCE, the 95th percentile AF decreases from 1.5 × 10⁻⁴ when using only pairs with detections in indoor air (37 pairs) to 1.3 × 10⁻⁴ when including both detects and non-detects (14 additional pairs, a total of 51 pairs; Table S3).
Figure 5. Box-and-whisker plots summarizing groundwater AF distributions associated with selected VOCs. Comparison between distributions obtained using indoor air (IA) detects only and IA non-detects (ND) taken at detection limit (DL). N indicates the number of indoor air-groundwater data pairs remaining after applying the baseline, atypical preferential pathway, and source strength screening steps.
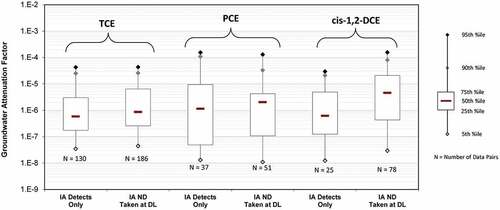
The case of cis-1,2-DCE illustrates the challenge of analyzing data pairs for which the proportion of non-detects in indoor air is greater than the proportion of detects. There are 25 indoor-groundwater pairs that passed the various screens and where cis-1,2-DCE was detected in indoor air and additional 53 pairs where cis-1,2-DCE was not detected in indoor air and is taken at the detection limit (total 78 pairs; Table S3). The 95th percentile AF increases by close to one order of magnitude from 2.9 × 10⁻⁵ when non-detects in indoor air are excluded to 1.6 × 10⁻⁴ when the non-detects are included (; Table S3). Closer review of the underlying cis-1,2-DCE dataset indicates that the larger groundwater AFs are primarily associated with one of the DoD VI database’s installations where the VI driver was TCE and the detection limit for cis-1,2-DCE in several samples was relatively elevated (10 µg/m3). In fact, the eight cis-1,2-DCE indoor air-groundwater data pairs corresponding to the highest groundwater AFs (corresponding to the top 10% of the 78 cis-1,2-DCE passing data pairs) are all associated with indoor air non-detects. A full evaluation of all the chlorinated VOCs in the dataset was not completed nor was the Kaplan–Meier method used in the EPA VI database evaluated (EPA Citation2012a).
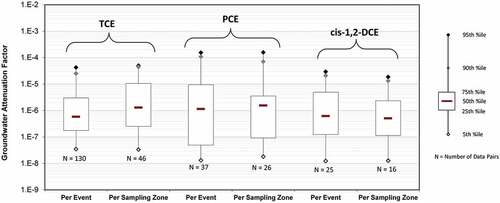
Because some degree of correlation exists between sampling events from a given sampling zone, groundwater AF distributions were also generated after averaging indoor air and groundwater data for passing (i.e., screened-in) sampling events from each sampling zone, such that each AF value for a given VOC corresponds to one sampling zone (rather than one sampling event of a sampling zone). Results for the selected VOCs are presented on and in Table S4. For instance, in the case of TCE, the 95th percentile AF obtained on an individual sampling event basis (130 indoor air-groundwater data pairs corresponding to 130 sampling events, with each sampling zone representing one or more events) is 4.2 × 10⁻⁵. At the sampling zone level (46 data pairs corresponding to 46 sampling zones with passing sampling events), the 95th percentile AF increases to 5.0 × 10⁻⁴. Similarly, the 95th percentile AF for PCE increases slightly from 1.5 × 10⁻⁴ (37 sampling events) to 1.6 × 10⁻⁴ (26 sampling zones). Collectively, the data continue to indicate that a generic groundwater AF of 10−4 corresponds to an upper percentile value that is reasonable for deriving groundwater screening levels at DoD commercial and industrial buildings.
Figure 6. Box-and-whisker plots summarizing groundwater AF distributions associated with TCE, PCE, and cis-1,2-DCE. Comparison between AF distributions derived from building sampling zone averages for individual sampling events (“per event”) and from building sampling zone averages for all sampling events (“all events”). N indicates the number of indoor air-groundwater data pairs remaining after applying the screening and averaging steps. Pairs with an indoor air concentration below detection limit are not included.
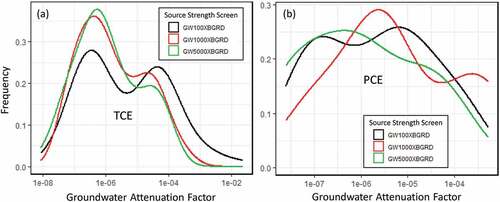
illustrates the effect of three different source strength screens on the AF data distributions for TCE and PCE. The changes in the distribution reflect the potential influence of background sources. As shown in the figures, the lower source strength screen (100 times the background) is associated with a bimodal distribution. This distribution shifts toward a log-normal-like distribution as the source strength screen increases to 5,000 times the background, with most AFs in the range of 10−7 to 10−6, consistent with the TCE and PCE data pair distributions shown in . In other words, the source strength screen progressively eliminates the relatively elevated AFs that more likely reflect background sources and thus do not reflect VI-related attenuation of vapors entering a building. The AF distribution tends to stabilize for source strength screens greater than 5,000 times the background and, consequently, the values of 5,000 times the background (or the fixed value of 10,000 μg/m3) were selected for the analyses shown in .
Figure 7. Groundwater AF frequency distribution plots for TCE (a) and PCE (b) after application of several source strength screens ranging from 100 to 5,000 times the background reference levels for TCE (2.1 µg/m3) and PCE (8.0 µg/m3), respectively.
Conclusion
The results of the analyses conducted on the DoD VI database of commercial and industrial buildings support the use of a generic groundwater AF of 10−4 (0.0001) at large commercial and industrial buildings for making conservative indoor air concentration predictions based on groundwater data and deriving VI screening levels for assessing the conventional VI pathway (i.e., absent atypical VI pathways). This generic AF is viewed as more representative than the default AF of 10−3 (0.001) derived using residential data (EPA Citation2012a), recommended by EPA for both residential and nonresidential buildings (EPA Citation2015b), and commonly required by regulatory agencies for conducting VI evaluations in either setting.
The EPA VI guidance encourages the use of site-specific data when evaluating the VI pathway (EPA Citation2015b). The analyses conducted using the DoD VI database generally follow the methods used by EPA to develop their generic groundwater AF and the results support the use of 10−4 for commercial and industrial buildings similar to those in the DoD database. The rationale cited in the EPA VI guidance for using a groundwater AF of 10−3 for commercial structures on the basis that many of these structures are converted residential buildings is generally not applicable at DoD installations. Finally, the DoD VI database results are consistent with recommendations made by certain states to use less conservative AFs for certain nonresidential buildings.
The DoD database incorporates information that goes beyond indoor air and subsurface concentration data. Information includes key building information (e.g., size, use, and construction year), building zone-specific information (e.g., flooring type and HVAC type), hydrogeological information (e.g., depth to water and subsurface soil type), and distance to the point of primary release of VOCs. Single variable and multivariate analyses have been conducted to assess trends and develop a scorecard that weights various lines of evidence to support the scoring of individual buildings within a site or area of interest and prioritize VI investigations (Lutes et al. Citation2021). Key findings were presented previously (Lutes et al. Citation2021), and a paper documenting the findings and recommendations is in preparation.
GW_AF_Paper-Electronic_Supplementary_Information.docx
Download MS Word (35.2 KB)Acknowledgment
Data processing and analyses presented herein were supported through NESDI funding. Data were collected by a variety of DoD contractors and obtained from the Naval Installation Restoration Information Solution (NIRIS) database. Preparation for this paper was funded by the Jacobs Engineering Group.
Disclosure statement
No potential conflict of interest was reported by the author(s).
Data availability statement
The data that support the findings of this study are available from the corresponding author, LCL, upon reasonable request.
Supplemental material
Supplemental data for this paper can be accessed online at https://doi.org/10.1080/10962247.2023.2175740.
Additional information
Funding
Notes on contributors
Laurent C. Levy
Laurent C. Levy, Ph.D., P.E., is a senior technologist and vapor intrusion practice leader at Jacobs Engineering Group, based in Boston, MA.
Keri E. Hallberg
Keri E. Hallberg, P.E., is a project manager and senior vapor intrusion technologist at Jacobs Engineering Group, based in Charlotte, NC.
Rodrigo Gonzalez-Abraham
Rodrigo Gonzalez-Abraham, Ph.D., is a chemical process engineer at Jacobs Engineering Group, based in Portland, OR.
Christopher C. Lutes
Christopher C. Lutes, M.S., is a principal technologist at Jacobs Engineering Group, based in Raleigh, NC.
Loren G. Lund
Loren G. Lund, Ph.D., is a risk assessment practice leader and talent supervisor at Jacobs Engineering Group, based in Shelley, ID.
Donna Caldwell
Donna Caldwell is a geologist and vapor intrusion subject matter expert at Jacobs Engineering Group, based in Hampton, VA.
Teresie R. Walker
Teresie R. Walker is a quality assurance officer and vapor intrusion subject matter expert at Naval Facilities Engineering Systems Command (NAVFAC) – Atlantic Division, based in Norfolk, VA.
Notes
1 Analysis of the EPA VI database (EPA Citation2012c) using screens and criteria identical to those used by EPA in their residential data analysis (EPA Citation2012a) shows that there are 22 passing indoor air-groundwater data pairs associated with “commercial” or “institutional” buildings. The median and 95th percentile groundwater AFs for these buildings is 1.8 × 10⁻⁵ and 6.0 × 10⁻⁴, respectively, thus showing more attenuation than the residential dataset with median and 95th percentile AFs of 7.4 × 10⁻⁵ and 1.2 × 10⁻³, respectively, based on 774 passing data pairs (EPA Citation2012a). While the nonresidential dataset passing the screens is small (22 passing pairs from 9 buildings at 6 sites), it does support the trend that nonresidential buildings exhibit more attenuation than residential buildings.
2 While data pairs with VOC concentrations below the detection limit in groundwater were excluded, data pairs with both detectable concentrations in groundwater and concentrations below the detection limit in indoor air were considered. This is because these pairs are indicative of VI attenuation. Not evaluating the effect of these data pairs in the analyses (i.e., keeping only the pairs with indoor air detects and excluding all pairs with indoor air non-detects) could potentially bias the AF statistics and raise the values of the upper AF percentiles.
3 Note that including only data pairs with indoor air concentrations above detection limits can be considered a conservative approach. This is because pairs with indoor air concentrations below detection limits would be expected to result in groundwater AFs that are generally lower than those with detectable indoor air concentrations. The addition of relatively low groundwater AFs would be expected to lower the median and upper percentile AFs of the overall AF dataset. Additional discussion regarding data pairs with indoor air concentrations below detection limits and the limitations associated with including them in the analyses is provided later in this paper.
4 Evaluation of the EPA VI database (EPA Citation2012c) – after retaining and screening only the chlorinated VOC indoor air-groundwater data pairs collected in residential settings – shows that the 95th percentile AF decreases from 1.165 × 10⁻³ when excluding indoor air non-detects (total of 743 pairs) to 1.135 × 10⁻³ when including indoor air non-detects with the indoor air concentrations taken at the detection limit (total of 774 pairs, including 31 pairs with indoor air non-detects). Note that EPA uses the Kaplan–Meier method to account for these non-detects (EPA Citation2012a) resulting in a 95th percentile AF of 1.160 × 10⁻³ (EPA Citation2012c). Retaining only one significant digit, all three AFs result in the same 10−3 generic groundwater AF, showing that the effect of indoor air non-detects is negligible. This may be due to the fact that the proportion of indoor air non-detects in the screened dataset is only 4% (31 pairs out of 774).
References
- EPA. 2004. Cleaning up the nation’s waste sites: markets and technology trends. Washington, DC: Office of Solid Waste and Emergency Response Publication EPA 542-R-04-015.
- EPA. 2011a. Background indoor air concentrations of volatile organic compounds in North American residences (1990–2005): A compilation of statistics for assessing vapor intrusion. Washington, DC: Office of Solid Waste and Emergency Response Publication EPA 530-R-10-001.
- EPA. 2011b. Exposure factors handbook: 2011 edition. Washington, DC: Publication EPA/600/R-09/052F. See Table 16–108
- EPA. 2012a. EPA’s vapor intrusion database: evaluation and characterization of attenuation factors for chlorinated volatile organic compounds and residential buildings. Washington, DC: Office of Solid Waste and Emergency Response Publication EPA 530-R-10-002.
- EPA. 2012b. Vapor intrusion database Microsoft Excel® spreadsheet. Accessed July, 2021. https://www.epa.gov/vaporintrusion/vapor-intrusion-database
- EPA. 2012c. Petroleum Hydrocarbons and Chlorinated solvents differ in their potential for vapor intrusion. Washington, DC: Office of Underground Storage Tanks.
- EPA. 2015a. OSWER technical guide for assessing and mitigating the vapor intrusion pathway from subsurface vapor sources to indoor air. Office Solid Waste Emerg. Response Publ. 9200:2–154. Washington, DC.
- EPA. 2015b. Technical guide for addressing petroleum vapor intrusion at leaking underground storage tank sites. Washington, DC: Office of Underground Storage Tanks Publication EPA510- R-15-001.
- EPA. 2020a. Regional screening levels (RSLs) – user’s guide. Accessed July, 2021. https://www.epa.gov/risk/regional-screening-levels-rsls-users-guide
- EPA. 2021. Vapor intrusion screening levels (VISL) calculator. Accessed September, 2021. https://epa-visl.ornl.gov/cgi-bin/visl_search
- Hallberg, K. E., L. C. Levy, R. Gonzalez-Abraham, C. C. Lutes, L. G. Lund, and D. Caldwell. (2021). An alternative generic subslab soil gas-to-indoor air attenuation factor for application in commercial, industrial, and other nonresidential setting. J. Air Waste Manag. Assoc. 71(9): 1148–58. doi:10.1080/10962247.2021.1930286.
- Indiana Department of Environmental Management. 2012. Remediation closure guide. Indianapolis, IN: Office of Land Quality.
- Indiana Department of Environmental Management. 2021. Draft risk-based closure guide. Indianapolis, IN: Office of Land Quality.
- Interstate Technology and Regulatory Council. 2014. Petroleum vapor intrusion: Fundamentals of screening, investigation, and management. Washington, DC: Petroleum Vapor Intrusion Team.
- Johnson, P. C., and R. A. Ettinger. 1991. Heuristic model for predicting the intrusion rate of contaminant vapors into buildings. Environ. Sci. Technol. 25 (8):1445–52. doi:10.1021/es00020a013.
- Lutes, C., L. Levy, R. Gonzalez-Abraham, K. Hallberg, D. Caldwell, L. Lund, T. Walker, and T. Lewis. 2021. Quantitative assessment of vapor intrusion risk in commercial buildings based on a dataset of 76 buildings. Presented at the 31st Annual International Conference on Soil, Water, Energy, and Air, Association for Environmental Health and Sciences (AEHS), March 14–17.
- Lutes, C. C., L. C. Levy, K. E. Hallberg, R. Gonzalez-Abraham, D. Caldwell, L. G. Lund, T. R. Walker, and T. B. Lewis. 2021. Reanalysis of department of defense vapor intrusion database of commercial and industrial buildings. Norfolk, VA: Naval Facilities Engineering and Expeditionary Warfare Center and Naval Facilities Engineering Systems Command Mid-Atlantic.
- Patterson, B. M., R. Aravena, G. B. Davis, A. J. Furness, T. P. Bastow, and D. Bouchard. 2013. Multiple lines of evidence to demonstrate vinyl chloride aerobic biodegradation in the vadose zone, and factors controlling rates. J. Contam. Hydrol. 153:69–77. doi:10.1016/j.jconhyd.2013.07.008.
- Pennsylvania Department of Environmental Protection. 2021. Land recycling program technical guidance manual. Harrisburg, PA: Section IV: Vapor Intrusion.
- Rago, R., A. Rezendes, J. Peters, K. Chatterton, and A. Kammari. 2021. Indoor air background levels of volatile organic compounds and air-phase petroleum hydrocarbons in office buildings and schools. GWMR 41 (2):27–47. doi:10.1111/gwmr.12433.
- The R Foundation for Statistical Computing. 2021. The R project for statistical computing. Accessed September, 2021. https://www.r-project.org/
- Venable, P., T. Chaudhry, D. Caldwell, I. Rivera-Duarte, C. Lutes, L. Lund, and K. Hallberg. 2015. A quantitative decision framework for assessing Navy vapor intrusion sites. Port Hueneme, CA: Naval Facilities Engineering and Expeditionary Warfare Center (NAVFAC EXWC) Report TR-NAVFAC-EXWC-EV-1603.
- Wickham, H. 2016. Ggplot2: Elegant graphics for data analysis. Springer. https://link.springer.com/book/10.1007%2F978-3-319-24277-4.
- Wisconsin Department of Natural Resources. 2018. Addressing vapor intrusion at remediation & redevelopment sites in Wisconsin, Wis. Stat. ch. 292; Wis. Admin. Code ch. NR 700. Remediation and Redevelopment Program Publication RR-800.
- Yao, Y., R. Shen, K. G. Pennell, and E. M. Suuberg. 2013. Examination of the U.S. EPA’s vapor intrusion database based on models. Environ. Sci. Technol. 47 (3):1425–33. doi:10.1021/es304546f.
- Yao, Y., I. Verginelli, E. M. Suuberg, and B. Eklund. 2018. Examining the use of USEPA’s generic attenuation factor in determining groundwater screening levels for vapor intrusion. GWMR 38 (2):79–89. doi:10.1111/gwmr.12276.