
ABSTRACT:
Global e-government innovations are at the forefront of municipal efforts to be better organized and more efficient in delivering services and improving outcomes for the public. Scholars have argued that such innovations are embedded in institutional and environmental factors, and municipal e-government growth evolves through stages as a result of the effects of these factors. However, existing studies rarely model the distinct success factors of the different stages. This article addresses that shortcoming with data from the largest cities in the world’s top 100 “most wired” countries from 2003 to 2016. Cluster analysis addresses whether there are any consistent growth trends, and finds that there are four clusters of e-government development. Regression analysis tests whether stages may be driven by specific factors, and findings reveal that e-government stages mostly have uniform drivers. Population size, GDP, and regional competition have a positive association across all stages. However, democracy level appears to have a more ambiguous status, as it influences some higher stages in large countries but has a negative association in small countries.
INTRODUCTION
E-government is the electronic delivery of information and services to citizens, business, and public administration (Lee et al. Citation2008). Scholars of e-government have learned how modern information and communication technologies (ICTs) spread around the world through public and private sector innovation, and have become relied upon by governments as tools of service provision and organization (Dunleavy Citation1994; Pratchett Citation1999). The stages model theories of e-government have emerged to address e-government diffusion and evolution (e.g., Andersen and Henriksen Citation2006; Lee, Chang, and Berry Citation2011; Layne and Lee Citation2001; Reddick Citation2004). In this theoretical vein, e-government research can sometimes seem to imply a kind of technological determinism, as if the maturity of e-governments through stages of development is inevitable. In fact, the picture is more mixed. According to a large number of empirical studies, determining factors do appear to be strongly influential in e-government development. Chief among these determining factors are financial resources and gross domestic product (GDP); socio-economic factors of the local citizen body, such as education, wealth, and technology access; and political factors, such as the role of elected officials (Gallego-Álvarez, Rodríguez-Domínguez, and García-Sánchez Citation2010; Manoharan Citation2013b; Rodríguez, Sánchez, and Álvarez Citation2011). Additionally, determinants of e-government maturity vary considerably within or between countries, levels of government, or types of e-government (Bonsón et al. Citation2012; Gallego-Álvarez et al. Citation2010; Holden, Norris, and Fletcher Citation2003; Moon Citation2002; Norris and Moon Citation2005), which means that e-government development is certainly neither inevitable nor unilinear.
Despite evidence of variation, research has not yet tested analytical models that explain antecedents of the e-government stages over time. E-government might mature on multiple, interrelated fronts with different variables influencing each stage, and not necessarily in a linear order. While a minimum set of economic, institutional, political, and social conditions must be present for the early stages, it may be that more advanced levels of e-government success later rely on different sets of factors rather than maturing uniformly (Ahn Citation2011). However, understanding of such variations in determinants at different e-government stages has been limited by a lack of multi-country longitudinal studies. Such studies can account for the factors of time and global variation to make stronger arguments about causality and to explain what stages exist and how they come about. The authors of this article suggest that there are two main reasons why such longitudinal and multi-country analyses are vital for advancing the field. The first is that knowledge of human phenomena relies upon theories that stand up to scrutiny in a range of country and cultural contexts, with the possibility of accounting for trends over time (Cetina Citation2009; Merton Citation1968). The second is that e-government is a phenomenon that lends itself to global forms of policy innovation. E-government is based on the global network of the Internet, which encourages global patterns of change. In this article, we explore these global patterns in e-government development and test findings from earlier studies on the determinants of e-government stages, with greater attention to specific dimensions and country contexts. Our research question is therefore two-fold: (1) What evidence exists for global trends in e-government stages? (2) What factors explain the development of the different e-government stages?
In order to address these questions, the article draws on cluster analysis and panel analysis of the Global E-Governance Survey, which is a biennial evaluation of official websites of the largest cities of the 100 “most wired” countries in the world. The survey started in 2003 and there have been seven subsequent surveys, the last covering 2016. The range of countries and the date ranges therefore make the survey an ideal data source for investigating global patterns of e-government development using a longitudinal perspective. The theoretical section of the article will present stage model theories of how e-government evolves and how a government’s social, political, and economic context shapes success in different stages of e-government. A systematic literature review that brings together research in public administration, public management, and information science presents theoretical arguments and hypotheses for determining factors in e-government development worldwide. The article then outlines the research methodology and describes the data settings and the measures we are using for analyses. After the presentation of the results, the final section covers discussion of the findings, presents best practice recommendations, refers to the contributions and implications of our study, and points to directions for future research.
THEORETICAL FOUNDATIONS
E-Government Stages
Many e-government authors have investigated the development of e-government and proposed different types of stage models. Layne and Lee (Citation2001) were among the first to describe e-government as “an evolutionary phenomenon,” and proposed four stages of e-government. In the first stage, cataloguing, governments provide citizens with access to online information. The second stage, transaction, involves adoption of interactive processes between government and citizens, which results in higher efficiencies in service delivery. The third and fourth stages, vertical integration and horizontal integration, cover the transformation and re-conceptualization of government services; for example, such changes may occur through a portal where citizens can access services from different governments, and thus require the collaboration of governments from different levels.
Since Layne and Lee’s work, a civic dimension has been added to the online information and service integration stages of e-government so as to create three major classifications for e-government dimensions: e-information, e-services, and e-participation (Lee, Chang, and Berry 2014; Manoharan Citation2013a; Nam Citation2014). For example, Moon (Citation2002) incorporated a civic stage that includes political participation through e-government, and thus marks an important step in recognizing political maturity alongside administrative maturity of e-government. In subsequent literature, the political and social elements of e-government maturity gained more prominence. Andersen and Henriksen (Citation2006) proposed an extension of the model by Layne and Lee, involving a first phase of “cultivation” encompassing vertical and horizontal integration within government. A second phase focuses on the importance of a personalized web interface for customer processes. A third phase moves towards an increased level of transparency and problem-solving mechanisms in citizen exchange, and a fourth phase involves greater citizen-orientation through systematic data mobility across organizations and transfer of data ownership.
Some authors have also analyzed the extent to which governments have progressed through the stages thus far. Moon (Citation2002) assessed the adoption of e-government in 1,471 municipal governments with populations over 10,000. He concluded that only a few governments have moved into the participative stage, and fewer integrate electronic service delivery across levels of government. Similarly, Reddick’s (Citation2004) study of American municipalities showed that the majority of cities have already implemented services of Stage 1, such as online provision of news and information. However, interactive services of Stage 2, such as the provision of online procurement tools, have been marginally adopted by municipalities. Coursey and Norris (Citation2008) also found that, while the percentage of cities offering financial transactions (e.g., tax payments) and nonfinancial transactions (e.g., service requests) increased between 2000 and 2004, advanced stages of e-government adoption remained low. Based on these results from previous empirical studies, we expect that distinct stages of e-government around the world evidence incrementally limited development of later stages of e-government adoption. That is, the curve of e-government stages is positively skewed, with the majority of world cities in lower stages of e-information with limited integration of service levels or citizen participation.
H1: The e-government level of municipalities around the world shows distinct stages of development, with the majority of municipalities concentrated in information provision, with lesser levels of progression to service and then participation stages.
Factors Influencing E-Government Development
Beyond assessing stages of digital maturity, we examine which factors influence the three different dimensions of the e-government stages. Prior literature on e-government offers a large range of factors that influence its adoption and development, which are often referred to as “success factors” (Gil-Garcia and Pardo Citation2005; Jacobson and Ok Choi Citation2008). These are shown in . A systematic review of articles, book chapters, and conference papers from public administration, public management, and information science was carried out using the Web of Science electronic library, and the conference proceedings of specialist e-governance conferences, the conference of the Digital Government Society, Electronic Government conference (EGOV-IFIP-CeDEM-ePart), and the United Nations E-Gov conference (full bibliography in Appendix A). In our theoretical section, we have included as many of the variables as possible that have been found in prior works. In some cases, we have had to choose between two very similar variables from the literature that are either worded almost identically or operationalized in similar ways. In other cases where there are disagreements in the literature or where evidence is sparse, we lean on other logical and empirical arguments to make decisions or to theorize more explicitly about causal mechanisms in e-governance stages.
TABLE 1 Summary of Findings on Antecedents of E-Government Success across Three Stages
We have chosen to present our model using a three-part institutionalist framework that sees government innovation as the result of internal and external characteristics of public organizations (Frumkin and Galaskiewicz Citation2004; Manoharan and Ingrams, Citation2018; Moon Citation2002). According to Eom (Citation2013:880), this “institutional approach helps e-government researchers not only to locate constraints on actors in e-government policy processes and structural factors that influence the interactions among them, but also to focus on mediators of the impact of information technologies and various environmental factors.” Following the literature review, we found a difference between internal technical factors, on the one hand, and legal and political factors on the other. We therefore discuss internal and institutional factors separately, in addition to the environmental factors. In our discussion of the determinants, we specifically mention the variables that have an effect on all e-government dimensions and those that are expected to have an effect on just one or two specific dimensions.
Environmental factors
Population size is a major environmental factor that helps to encourage municipalities to develop their e-government provisions (e.g., Ahn Citation2011; Brudney and Selden Citation1995; Lee et al. Citation2011; Rogers Citation1995). This appears to hold across e-information (e.g., Ahn Citation2011; Gallego-Álvarez et al. Citation2010; Reddick and Norris Citation2013), e-services (e.g., Gallego-Álvarez et al. Citation2010; Reddick Citation2009; Reddick and Norris Citation2013), and e-participation (e.g., Gallego-Álvarez et al. Citation2010; García-Sánchez et al. Citation2011; Guillamón et al. 2016). Government plays the role of a supplier and must meet the expectations of a densely populated area with a large number of people by being more innovative (Rogers Citation1995; Weare, Musso, and Hale Citation1999). Even across major global cities, population size varies widely.
Another function of the responsiveness of government policymakers to public characteristics concerns the characteristics that are often grouped under socio-economic variables or “human capital,” such as education level. Education has been shown to correlate with higher demand for public information, government services, and a willingness to be more participative in the governance of public affairs (Putnam Citation1995). According to Tolbert, Mossberger, and McNeal (Citation2008), e-government innovation is determined by innovation capacity, reflected largely in local citizen demographics such as level of urbanization, wealth, and education. Similar to wealth and population size, education is expected to influence all three e-government dimensions, which has been confirmed in a prior study by Reddick and Norris (Citation2013) of local governments in the United States.
H2: Population size is positively associated with higher e-information, e-services, and e-participation development.
H3: Education level is positively associated with higher e-information, e-services, and e-participation development.
Internal capacity factors
Perhaps one of the most intuitive and widely confirmed findings about the antecedents of e-government development is the relationship between e-government development and the wealth and financial resources of public organizations, as measured by GDP or taxable wealth (e.g., Bhatti et al. Citation2011; Gallego-Álvarez et al. Citation2010). Regardless of environmental or leadership pressure to innovate, all e-government dimensions require significant investment in technology. Therefore, wealthy governments with a healthy financial situation are more likely to adopt innovative e-government tools (Edmiston Citation2003; Ma Citation2014; Tolbert et al. Citation2008).
In addition to the financial resources, e-government planning and implementation involve knowledge gained through learning and leadership (Lee et al. Citation2011). In trying to explain why governments may evolve slowly through the e-government stages, Ho (Citation2002) suggests that there is a learning curve that is driven by the gradual accumulation and application of new knowledge. Several studies have found that governments with more years of experience working on e-government platforms such as websites develop a better capacity and skill (e.g., Jun and Weare Citation2010; Manoharan Citation2013b; Yun and Opheim Citation2010). Layne and Lee’s (Citation2001) original model suggested that the stages are sequential because e-government capacities build on prior stages; transactions depend on an organizational foundation of electronic information sharing and integration.
Organizational leadership also shapes the planning and capacity that leads to adoption of innovations in e-government (Bhatti et al. Citation2011; Wang and Feeney Citation2016). Sophisticated innovations, such as micro-blogging and publishing financial reports online, depend on a government leader who is internally motivated to develop such programs to improve efficiency or transparency (Ho and Ni Citation2004; Ma Citation2014). Eom (Citation2013) found that e-government development resulted from having officials in favorable positions of legal authority and technological expertise, and Norris and Moon (Citation2005) found that organizations with shortages of such expertise by way of inadequate technology and web skills experience barriers to adopting better e-government applications. These qualities of leadership are normally subsumed under the responsibility of a chief information officer (CIO).
H4: Financial capacity (GDP per capita) is positively associated with higher e-information, e-services, and e-participation development.
H5: Years of experience are positively associated with e-information, e-services, and e-participation development.
H6: Technological leadership is positively associated with higher e-information, e-services, and e-participation development.
Institutional factors
According to Gallego-Álvarez et al. (Citation2010), different types of government organizations and politics play a role in shaping the e-government innovations. Prior work suggests that competition among governments and pursuit of peer-to-peer legitimacy (Jun and Weare Citation2010) affect leadership responsiveness and the ability to adopt new policies and programs (Zhang and Feiock Citation2009). Governments compete with other neighboring governments to gain the respect of citizens and their satisfaction with services (Ho and Ni Citation2004; Lee et al. Citation2011). Lee, Chang, and Berry’s study considers the competition between neighboring country governments as a key driver of e-government diffusion, but it makes sense that major cities of neighboring countries would also compete in this way. Neighboring cities compete by developing e-government infrastructure to become more economically attractive to investors (Jun and Weare Citation2010). Governments are thus expected to be responsive to other governments with which they share geographic proximity and to innovate more in e-government if those neighbors are strong performers.
A substantial amount of theoretical and empirical research has also been undertaken linking characteristics of democratic countries, such as “effective governance,” and e-government (Azad et al. Citation2010; Eom Citation2013; Gulati et al., Citation2014; Stier Citation2015). Findings suggest that institutional arrangements can make the difference between a highly successful e-services initiative and a failing initiative (Eom Citation2013; Gulati et al. Citation2014). On the other hand, Gulati et al. (Citation2014) argue that evidence of the effect of democratic political structures is mixed, but further attention is needed on the relationships between institutional arrangements and specific types of e-government. Despite extensive research on e-democracy and e-participation, there is very little work on the connection between democratic characteristics and transactional and interactional dimensions of e-government.
According to Stier (Citation2015), certain democratic and legal prerequisites need to be in place before e-government initiatives can be successful, but autocratic governments are also making progress. Some cities that score quite low on global measures of democracy, such as Singapore, attain high e-government levels (Calista and Melitski Citation2007; Lee et al. Citation2011). Calista and Melitski (Citation2007) suggest that autocratic countries may eagerly embark on e-government initiatives, but have little interest in the interactional dimensions. However, in empirical findings, the relationship between democracy and higher stages of development remains unclear. Historically, democratic countries have led innovation in e-government. So, while evidence is mixed, it is likely, in the long term, that giving citizens more of a say and facilitating open communication in government policies and programs drive higher success in e-services and e-participation adoption.
H7: Regional competition is positively associated with e-information, e-services, and e-participation development.
H8: Democracy is positively associated with e-services and e-participation development.
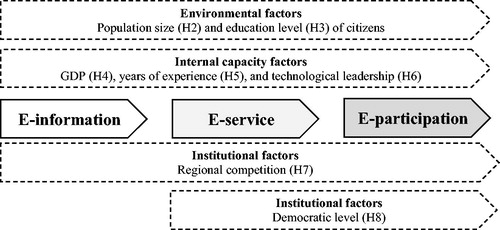
The hypothesized determinants of the three stages of e-government development are shown in . Environmental and internal capacity factors are influential at all stages of development. Institutional factors are shown at the bottom of the diagram in two tracks. One consists of mimetic processes of competition and learning from other governments in the region. Like environmental and internal factors, these are continuous throughout. The second institutional factor is the governance factors, including democratic level and transparency norms. It is these institutional factors which make a difference at the higher levels of e-government development, e-services, and e-participation.
Figure 1. Conceptual model of e-government determinants.
DATA AND METHODS
Setting and Data Collection
The survey instrument used in the research is based on the Rutgers E-Governance Performance Index (Holzer and Manoharan Citation2016), one of the most comprehensive instruments for e-government research, with 104 measures and five distinct categorical areas. The survey assessed the official websites of the largest cities in the world in five categories: two of the categories relate to website e-information (information content and usability); two relate to website e-services (privacy and e-services); and one category relates to website e-participation (citizen engagement). The five categories aim to capture the e-government levels of maturity in the design of municipal websites as an interface for government-citizen information and interaction (Layne and Lee Citation2001; Moon Citation2002; United Nations Citation2010).
Each category included 17–23 measures, which were coded into ordinal scales where the high number shows full success in a website’s adoption of a feature such as a privacy statement (in the privacy category) or a clear menu (in the usability category). The municipalities evaluated were selected based on population size and the percentage of individuals using the Internet. Using data from the International Telecommunication Union (ITU), the top 100 wired nations were identified, and the largest cities by population in each of those nations were selected for the study as surrogates for their countries (shown in Appendix B). To ensure inter-rater reliability, each municipal website was evaluated in the native language by two individuals, and websites with significant variation (more than 10%) were analyzed by a third evaluator. Evaluators were also provided with sufficient examples to guide how the variables needed to be measured and were given comprehensive written instructions for assessing the websites.
Analytical Methods
Two methods are employed in the analysis: (1) cluster analysis and (2) time series regression. To derive patterns of cities in e-government stages, the method first involved conducting a hierarchical cluster analysis using five e-government scores. Similar to other studies on e-government (e.g., Holzer, Manoharan, and Van Ryzin Citation2010), cluster analysis is applied to group cities to construct types which should reflect the level of e-government sophistication. The variables were standardized by z-score transformation and used Euclidean distances with Ward’s method of clustering (Aldenderfer and Blashfield Citation1984). To investigate the groups of e-government across time, a cluster analysis was run using data from 2003, 2009, and 2016.
Second, we conducted analyses on unbalanced panel data to identify the factors influencing e-government stages across municipalities. The time series analysis uses random effects estimates, taking cities as units of analysis across biannual survey years (2003–2016). Random effects estimates are ideal for models that may include unobserved heterogeneity in the units of analysis and when predictors remain constant over time. Further, a Hausman test supported the null hypothesis that a random effects model is a better estimator than fixed effects. Newey West robust standard errors are clustered at the city level to control for unit fixed effects. Robust standard errors also provide wider confidence intervals, which is a precaution here, given slightly high levels of multicollinearity in one model with a 9.88 variance inflation factor (VIF). The other 17 models were in a normal VIF zone of 0.85–4.80. A further reason for robust estimates is that Breusch-Pagan tests in five of the models suggested that variance of the error terms is not constant.
Measures
Dependent variables
Content. Content is the first dependent variable that measures the level of e-information. It uses 25 items to assess five e-information aspects: contact information, public documents, disability access, multimedia materials, and time-sensitive information. The content for contact information included the hours of operation for government offices, access to city codes and city charters, agency mission statements, minutes of public meetings, and budget information. The website was evaluated for the availability of multilingual content, and how it addresses the requirements of disabled users. The website was also evaluated for the presence of audio or video files of public meetings or speeches, calendar of events, and to what extent it integrated the emergency alert systems.
Usability. The category of usability is the second dependent variable for e-information level. It determined the “user-friendliness” of websites’ information based on 19 indicators. These include specific features such as the use of hypertext markup language (HTML), branding and structure (e.g., color consistency, font, graphics, and page length), and if the website indicated the system hardware and software requirements for the users. Related features, such as targeted audience links, use of navigation bars, hyperlinks, and links to the homepage on every web page, were also assessed during the evaluation. Finally, the website search tool was checked in terms of ease of use and the capacity to sort the results as required by the users.
Privacy and security. This category is the first e-services dependent variable. It included 19 measures that focused on two particular aspects of user transactions: the presence of privacy policies and the possibility of user authentication. The evaluation assessed whether users who make an online transaction have access to personal information to report inaccurate information, as well as administrative steps taken by the government to address these privacy concerns, such as encryption, secure servers, and digital signatures. Finally, the survey assessed the intention of websites to monitor citizen activities through cookies and web beacons.
Services. The services category is the second e-services measure. It is composed of 20 items that gauge the extent to which official websites facilitated the provision of public services to citizens, which include those that allow the users to communicate and interact with the city and those that allow users to register online for public events. The initial types of questions focused on the interactivity of websites in terms of reporting crimes or violations, accessing private information (such as medical records or education background), and web portal customization. The questions pertaining to online registration included permits, licenses, online procurement, and the ability to access and bid requests for proposals online. Finally, the availability of transactional services, such as online payments of bills, parking tickets, fees and fines, and online tax payment systems, was determined.
Citizen and social engagement. This category is the single measure used in the research for municipal e-participation level. It employs 17 items to evaluate users’ ability to provide feedback to public administrators and elected officials, along with the presence of discussion boards, blogs, and policy forums. The category also included questions that pertain to the provision of current and accurate information by governments through online newsletters, listservs, and social media channels. Surveys are another important avenue for gathering citizen feedback on government policy and implementation process, and these were also determined on the official websites.
Overall score. Finally, one dependent variable is an overall e-government score that is calculated by adding the five categories together.
Independent variables
Each of the seven independent variables is derived from a different secondary data source. Measurement items are shown in , and descriptive statistics are shown in . Measurements were taken every other year in seven surveys between 2003 and 2016. Due to slight changes in the 100 cities evaluated in each survey year, there are 118 cities that have been evaluated, but only 82 of these have been consistently part of at least five of the seven surveys. Therefore, in order to minimize the estimation problems of missing data, we chose to focus only on these 82 cities in the panel regression.
TABLE 2 Descriptive of Data Operationalization and Sources
TABLE 3 Summary Statistics
Environmental variables. Among the environmental variables, education level was operationalized using data from the QS Global University Rankings to establish the number of universities from the Global E-Governance Survey cities that feature in the top 500 universities in the world. In order to weight the data for better-quality universities as opposed to the quantity, two points were given for a university in the top 100 of the ranking and one point was given for a ranking below 100. Each city’s score was therefore an additive score of the number of quality universities in the city. Finally, population size was measured using World Bank statistics on city population size.
Internal capacity variables. GDP per capita is used as a proxy for the financial capacity of the local government and comes from the Brookings Global Metro Monitor. The Brookings data are incomplete for years prior to 2013, and so figures from earlier years are extrapolated using the average annual rate of GDP growth between the years 2000 and 2014 according to the Global Metro Monitor. The years of experience variable was operationalized using the age of the city’s website. Older websites indicate longer experience of creating e-government programs through websites. The online tool “Wayback Machine” was used to identify the year when the website was launched. The data for whether the city has a CIO were obtained from organizational charts publicly available on the city website. Occasionally, organizational charts could not be found, and thus 73 observations are not included.
Institutional variables. Among the institutional variables, regional competition is operationalized by the mean e-governance index score of the geographic regions where the cities are located. This measure relied on the regional average scores from the UN E-government index for 10 regions according to the UN classification. The higher the average score of the region, the higher the level of regional competition. Democratic level was operationalized using the Freedom House index of democracy (“Free,” “Partly free,” or “Not free”) that assesses seven items on political and civil liberties, such as electoral process, the rule of law, and political participation.
Control variables. Two controls were used: first, the geographic region of the country where the city is located, and second, the development status of the city’s country. The regional control aimed to account for variation in e-government development effects at the regional level. Development status controlled the role of unobserved factors resulting from economic and political status that influence e-government level. Another important area of sample variance comes from the range of sizes in the countries. To distinguish country size effects, all of the variables are estimated in three separate models: (1) cities in small countries; (2) cities in large countries; and (3) all cities together. In the absence of official definitions of “large” and “small” countries, we used modal figures in our data and geographic knowledge to adopt our own classification where a large country has a population of at least 50 million and a land area of at least 200,000 square kilometers according to the CIA World Factbook. This resulted in sample sizes of 39 observations for cities in small countries, and 43 cities in large countries.
shows that the number of observations varies between 534 and 356 for the predictor variables due to missing data at the city level. To address this problem, the study included a statistical method of imputing missing data using the data matrix’s observed values. The statistical package missForest with R tests imputed values by averaging random forests (multiple “trees” of variables in a data matrix) with non-parametric assumptions, and has been shown to outperform other methods such as maximum likelihood and multiple imputation (Overton Citation2016; Stekhoven and Bühlmann Citation2012). MissForest then computes an out-of-bag (OOB) estimate for the true imputation error. Error estimates approaching 0 show a good level of imputation, while estimates approaching 1 are considered poor. OOB estimates for models estimated in this research ranged from 0.001044 to 0.001236, indicating an excellent OOB score.
RESULTS
Cluster Analysis
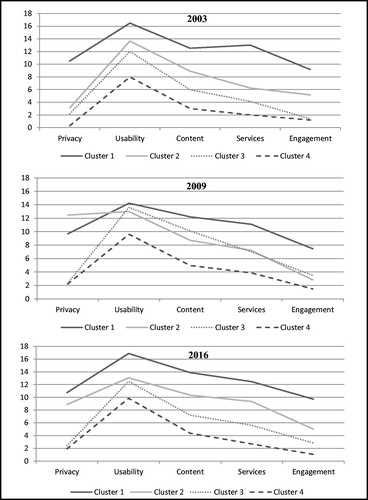
The cluster analysis on the five e-government categories estimates the clustering of each city in relation to one of four cluster groups. Based on inspection of the dendrograms, a four-cluster solution was selected as most meaningful. illustrates the distribution of cities across the clusters using 2003, 2009, and 2016 data. In order to identify the characteristics of all cluster groups, we estimate the mean score for each cluster in relation to each of the five e-government categories. For each e-government category, we use one-way analysis of variance (ANOVA) to test for significant differences in means across the cluster groups. further reports the statistically significant differences between the cluster groups as determined by one-way ANOVA.
TABLE 4 Comparison of Clusters and Analysis of Variance
The results of all cluster analysis suggest four levels of world cities. The profiles are shown in . Similar to Holzer et al. (Citation2010), the cluster profiles indicate that groups differ regarding scores but are similar in terms of shapes. All cluster groups show high means for usability and indicate low degrees for service and citizen engagement and privacy. The first group of “digitally mature cities” shows relatively high mean scores for all five categories. The second group of “digitally moderate cities” suggests decreased mean scores for the e-government categories, especially for service and citizen engagement. In terms of 2009 data, the second cluster group indicates higher scores for privacy than the first one. However, it performs poorly with regard to service and citizen participation. The third group of “digitally minimal cities” shows a similar mean value for usability as the second group. The 2009 data further point to higher means for usability and content. However, there is a large gap between the mean values of privacy in contrast to digitally moderate cities. Finally, the last group of “digitally marginal cities” suggests low values for all categories, with the exception of usability.
Figure 2. Cluster profiles for 2003, 2009, and 2016.
Further results on the performance of countries according to the e-government dimensions are shown in the appendix. Appendix C sheds light on the top performing cities in e-government based on the 2016 overall e-government score. It further outlines the values of each of the five categories of municipal e-governance for these 20 cities.
Multivariate Results
The results of the time series regression are shown in and . shows the overall score across e-government categories, while shows estimates for each of the five categories. There is some notable variation in antecedents across the e-government categories, as well as between cities in small and large countries. In , for example, GDP is a consistent predictor across cities in small and large countries. In contrast, regional competition and population size only make a difference in the large countries. But these results are much more nuanced when we look into the different models for each of the e-government categories. In , interpretation of the models for small countries should be taken cautiously, as three of the models have insignificant F-statistics and are therefore not significant overall. However, the Wald tests suggest that the models are still better than a constant-only model, except for the “participation” model. GDP has a significant effect on e-information and e-services stages in small countries, as does regional competition in e-services stages. Small countries also evidence a surprising finding regarding democratic level, which is that the latter is negatively associated with e-services components of privacy and services.
TABLE 5 Regression Results for Overall E-government Level (Robust Standard Errors in Parentheses)
TABLE 6 Regression Results for Five E-government Components (Robust Standard Errors in Parentheses)
Large countries are notably different from small countries. In large countries, population size is positively associated with the e-services and e-participation stages, while GDP is only influential at the higher stages. Regional competition is significant across all stages. Finally, democratic level is significant, but only for the privacy component in large countries. Considering the results for small and large countries, as well as the coefficients for all countries, both H2, for the effect of population size on e-information, e-services, and e-participation development, and H4, for the effect of GDP, are broadly supported, although there is substantial variation between small and large countries in terms of which stages are affected. H3, for education level, is not supported. In fact, in the case of e-services in large countries, the effect is significant and negative. The effects of other internal capacity factors, years of experience (H5) and technology leadership (H6), on e-information, e-services, and e-participation development are also not supported. H7, for the effect of regional competition on e-information, e-services, and e-participation development, is widely supported, and as expected, the effect is constant across all e-government stages. Also, like GDP and population, regional competition influences small and large countries in different ways. The positive association between regional competition and e-participation stages is only found in large countries. Finally, H8, for the variable of democracy level and its effect on the development of higher e-government levels of e-services, and e-participation, is not statistically supported.
Best Practices in Global Municipal E-Governance
The following presents some of the best practices from the 2016 Global E-Governance Survey—Seoul, Helsinki, Madrid, Hong Kong, and Prague. The city of Seoul ranked first in the survey, repeating its performance in previous surveys, along with high performance in content, service delivery, and citizen and social engagement. The website of Seoul is user-friendly, clearly formatted, and the homepage is within the appropriate length. These, along with relevant search tools, enable users to locate any required information and encourage them to post their questions and feedback. The website provides a simple “easy reads” section for citizens to quickly review important news and updates in the city. Seoul’s website is also a recognized model for enhancing privacy protection and Internet security, as well as offering a high level of usability. Helsinki ranked second and improved significantly from its sixteenth position in the previous 2014 survey, particularly due to its performance in privacy and citizen and social engagement. The website provides adequate content on its homepage in a clear and understandable manner, especially its privacy statement, which includes information on the use of cookies, and the collection and use of data. The website excels in providing opportunities for citizen participation online with interactive tools, discussion forums, and feedback forms, all of which helped elevate Helsinki to first place in the category of citizen and social engagement.
Madrid ranks third owing to high scores in the categories of content, services, and citizen and social engagement. The website enables citizens to utilize a wide range of services online, such as payment of taxes, license and permit applications, parking fees, fines, environmental and car control services, and other related social services. The license and permit application system is particularly well-integrated with citizens’ online municipal accounts, and citizens can both apply and track their applications online. The website of Madrid also offers a “Debates” section to provide opportunities for interactions between citizens and public administrators. Hong Kong ranks fourth overall and ranks highly in usability and service delivery, particularly due to its “one stop platform” that enables citizens to avail themselves of crucial services related to business, administration, and citizenship. The website provides well-organized content highlighted with important information related to budget and policy. The city takes strides to protect users’ privacy and meet security concerns, and also addresses the needs of non-citizens and expatriates, who form a sizable portion of Hong Kong’s residents. Prague took the fifth position, and also was highly ranked in privacy and content categories. The privacy statement addresses important questions related to users’ privacy and security, and the website enables users to locate relevant information in the content category, such as meeting minutes, mission statements, budget reports, and performance information.
DISCUSSION AND IMPLICATIONS
This article contributes to the stream of literature on e-government development through the following contributions, covered only to a marginal extent thus far. First, the article adds to the studies examining the development and current stages of e-government by extending the sample analyzed. Whereas Reddick (Citation2004) and Coursey and Norris (Citation2008) focused on American cities, this study analyzes e-government and e-governance from an international perspective, and provides evidence for the current stage of digital governance from 80 global cities. By applying cluster analysis, it provides an empirical classification of e-government types, reflecting previous studies on a staged adoption of e-government in terms of world cities. This typology provides a basis for comparing e-government stages and determinants across countries. Second, the study uses city-level data which have not been used before to analyze the stages of municipal digital governments. The municipal e-governance survey provides data for analysis of cities’ e-government development in three stages—e-information, e-services, and e-participation—and thus adds to the empirical literature that focuses on the earlier stages of e-government (e.g., Moon Citation2002; Reddick Citation2004; Coursey and Norris Citation2008).
The findings of the regression analysis in the article corroborate earlier findings about the different institutional antecedents associated with different dimensions or practice areas of e-government (e.g., Ahn Citation2011; Chen and Hsieh Citation2009; Lee et al. Citation2011; Wang and Feeney Citation2016), and generate stronger research insights by systematically drawing on information science literature, in addition to public administration and public management. In addressing these associations across three different stages of e-government across time, the results provide more granular evidence of the associations, and explain why some governments may move faster than others and in specific stages. Cross-dimensional approaches such as these are important for understanding broad e-government trends. Furthermore, as the cluster analysis has shown, the dimensions of e-government develop simultaneously; regardless of the level of digital maturity evidenced by a municipal government, the dimensions of e-government are derived in the same order, with usability in the lead and citizen and social engagement following behind. This means that digitally mature cities are ahead on all dimensions, rather than being ahead on some, but not others. The regression analysis supports this view by showing that many success factors, especially GDP, population size, and regional competition, are associated with all three stages. These support earlier findings on GDP per capita (e.g., Edmiston Citation2003; Ma Citation2014) and regional competition (e.g., Lee et al. Citation2011).
However, there are also some specific factors that can contribute uniquely to individual stages. The strongest effects of the antecedents on the higher levels of e-government development occur in larger countries, which echoes earlier views that complexity is a driving factor of higher e-government innovation (Gallego-Álvarez et al. Citation2010; Norris and Moon, Citation2005). We add to this theory of e-government innovation by testing the variable of regional competition, which points to a further driver of e-government development, especially in larger countries in the higher e-government stages. Cities in larger countries face more complex tasks demographically and geographically, and globalization forces of migration and international labor supplies lend themselves to increasing competition (Shipan and Volden Citation2012; Wang Citation2001; Weare et al. Citation1999). As we hypothesized, institutional factors such as democratic level also matter for the higher stages of e-government, but the relationships among these variables are more complex than we expected. Notably, democratic level, which does influence the e-services stage in one component (privacy and security), only seems to make a difference in large countries. In small countries, democratic level is inversely related to the e-services stage. This finding might suggest that small, democratic countries are better at providing traditional services than online services. While prior research does suggest that democratic countries tend to have better capacity and political support for e-government to be more fully developed, such research is mixed, or finds that differences depend on how democratic level is measured (e.g., Lee et al. Citation2011; West Citation2005). Small, non-democratic governments also have an advantage when it comes to building online services quickly across central agencies (Gulati et al. Citation2014), and may do so to enhance support and legitimacy among citizens and among international peers (Stier Citation2015). Large democratic countries, in contrast, may have a comparative disadvantage, as well as less incentive, in driving forward fast gains in e-government development. However, many of these interesting nuances of democratic variables are largely conjecture here, and further institutional analysis is needed to piece together the puzzle.
Other results from the research were surprising in that variables were not found to be supported, despite having support in earlier research. Notably among these are the internal variables relating to technical expertise and leadership, as well as education level. Each of these variables had evidence supporting them, but other studies also have failed to confirm them. Education, in particular, has been found to be interdependent on inclusion of wealth and GDP in models (Tolbert Citation2008; West, 2005), and the latter was a strongly significant variable in this study. Further, while internal variables are important, technology transformation and innovation theory tends to emphasize political and institutional factors over internal administrative or technical capacity (Jun and Weare Citation2010). Institutional and environmental variables tend to be more fixed compared to internal ones, and over the long term they may play the bigger role needed to embed technologies in processes of innovation (Fountain Citation2004; West Citation2005; Yang Citation2003).
Limitations and Directions for Future Research
This study is based on a purposive sample of cities that are in the most Internet-advanced countries in the world. However, the advantage of this is that, by selecting the largest cities in the most wired countries, we are comparing similar entities with a certain level of technological sophistication, and by selecting the largest city in each such country, we further underscore that attribute. Thus, by controlling for “most wired” and largest cities, we are making it possible to look for factors affecting e-government that are not simply a function of the available technology. The study has drawn conclusions from statistical analysis, but there is much more that can be learned from these cities and the determinants of e-government level through an explanatory case study approach. While the present study finds that statistical predictors are important, a case study approach can reveal what the specific mechanisms are, as well as detailing and identifying the common characteristics or distinguishing factors among groups of countries. Case study approaches may also address a limitation in this article that some of the variables identified in prior literature, such as citizen demand, political support, and political competition, could not be measured because of a lack of data for city-level characteristics. Cases focusing on small groups of cities could assess these factors in qualitative ways or through surveys to determine whether they also play important roles in e-government success.
As this study’s results suggest that the determinants of e-government level vary across the different dimensions of e-government, future research could also address the interdependency of these causal relationships. As the dimensions are not independent of one another, there must be interactions among e-governance predictors and outcomes. Case-based approaches are suitable for these types of questions, but so too are quantitative approaches that concentrate on the relationships among a limited number of moderators and outcome variables. There may be more specific associations or combinations of factors associated with specific dimensions. Citizen engagement is among the more critical areas to address in this respect, as the present work is not the first to suggest that government efforts in this area are frequently hampered.
This article offers a global perspective on e-governance development over time. The results of the cluster analysis revealed that there are four global clusters of e-government development relating to mature, moderate, minimal, and marginal stages. The results of the regression analysis show support for the findings of earlier empirical studies on the predictors of the level of e-government provision. However, the original contribution of this study is to show, at a global level, that these predictors are associated with the stages of e-government in different ways. Specific institutional and environmental factors may help to foster the growth of e-government, but this fostering does not occur equally across the spectrum of e-government. Rather, e-government performance responds to specific conditions.
Finally, by revealing the patterns of e-government performance across three stages of e-government, the article provides several specific points for intervention by e-government practitioners and policymakers in government. Such interventions may wish to focus on improving specific areas of e-government performance that are lacking. While governments can provide a conducive environment by focusing on a broad range of institutional and environmental factors, they may wish to improve in the important dimension-specific areas suggested in this article’s research. The knowledge of the factors and barriers of e-government success can help administrators to devise specific strategies to implement e-government projects that will meet their stakeholder demands, remain cost-effective, and reduce the possibility of IT project failure.
The phenomenon of e-government has multiple implications at all levels of government, particularly the local government level, where citizens tend to have greater interaction with public officials. This research examines the trends and best practices in municipal e-government and, more importantly, sets the tone for the transformation from e-governance to smart governance among global municipalities. The dimensions discussed in the article can contribute to crucial steps in the progress towards becoming a smart city. Future studies in municipal e-governance need to examine how governments are building smart cities, and to what extent they involve citizens and stakeholders in the process. What are the various stages of development of smart cities, and what are the critical success factors and barriers affecting these initiatives? More importantly, future research needs to focus on how to measure the performance of smart cities and analyze them from a global comparative perspective.
The best practices discussed in the article provide guidance and lessons for cities that have recently adopted e-government initiatives. Moreover, the comparison of the top-performing cities over the years shows that many cities are not able to repeat their success over consequent surveys. This trend suggests that administrators need to ensure that their e-government applications are not only effective and efficient, but also sustainable for long-term success by addressing specific environmental and institutional barriers to innovation. Perhaps the most important implication for cities adopting e-government is to begin to conceptualize e-government in terms of multiple dimensions, rather than an overall phenomenon. This will enable cities to implement e-government through incremental stages that will allow for citizens to provide their opinions, and for administrators to respond to them in a timely manner, as they implement the new technologies.
Additional information
Notes on contributors
Alex Ingrams
Alex Ingrams ([email protected]) is an assistant professor in the Institute of Governance at Tilburg University. His research interests are in digital government reform, and particularly impacts on transparency and accountability. He also researches other topics focused around the intersection of technology change and governance reform, such as open government, open data, and big data.
Aroon Manoharan
Aroon Manoharan ([email protected]) is an associate professor in the McCormack Graduate School of Policy and Global Studies at the University of Massachusetts, Boston. He received his Ph.D. from the School of Public Affairs and Administration, Rutgers University-Newark. His research interests include e-government, performance measurement, public reporting, citizen participation, strategic planning, and comparative public administration. His recent research focuses on the role of academic programs in strengthening the IT capacity of cities and local governments.
Lisa Schmidthuber
Lisa Schmidthuber ([email protected]) is a doctoral researcher in the Institute for Public and Nonprofit Management at Johannes Kepler University Linz, Austria. Her research interests include innovation management in the public sector in general, and focus on value creation by integrating citizens in innovation processes in particular.
Marc Holzer
Marc Holzer ([email protected]) is a distinguished professor of public administration at the Sawyer Business School, Suffolk University. He is a Past President of the American Society for Public Administration (ASPA) and the former founding dean of the School of Public Affairs and Administration at Rutgers University. He has published numerous articles, books, and monographs in public administration research and theory. He currently chairs the ASPA Endowment supporting education in strong, effective, and ethical public governance.
REFERENCES
- Ahn, Michael. J. 2011. “Adoption of E-communication Applications in US Municipalities: The Role of Political Environment, Bureaucratic Structure, and the Nature of Applications.” The American Review of Public Administration 41(4):428–452.
- Aldenderfer, Mark. S. and Roger. K. Blashfield. 1984. Cluster Analysis. Thousand Oaks, CA: Sage Publications.
- Andersen, Kim Viborg, and Helle Zinner Henriksen. 2006. “E-government maturity models: Extension of the Layne and Lee model.” Government Information Quarterly 23(2):236–248.
- Bhatti, Yosef, Asmus L. Olsen, and Lene Holm Pedersen. 2011. “Administrative Professionals and the Diffusion of Innovations: The Case of Citizen Service Centres.” Public Administration 89(2):577–594.
- Bonsón, Enrique, Lourdes Torres, Sonia Royo, and Francisco Flores. 2012. “Local E-government 2.0: Social Media and Corporate Transparency in Municipalities.” Government Information Quarterly 29(2):123–132.
- Calista, Donald. J. and James Melitski. 2007. “E-government and E-governance: Converging Constructs of Public Sector Information and Communications Technologies.” Public Administration Quarterly 31(1/2):87–120.
- Cetina, Karin. K. 2009. Epistemic Cultures: How the Sciences Make Knowledge. Cambridge, MA: Harvard University Press.
- Chen, Yu‐Che, and Jun‐Yi Hsieh. 2009. “Advancing E‐Governance: Comparing Taiwan and the United States.” Public Administration Review 69(s1):151–158.
- Coursey, David and Donald. F. Norris. 2008. “Models of E‐government: Are they Correct? An Empirical Assessment.” Public Administration Review 68(3):523–536.
- Dunleavy, Patrick., 1994. “The Globalization of Public Services Production: Can Government be 'Best in World'?” Public Policy and Administration 9(2), pp. 36–64.
- Edmiston, Kelly. D. 2003. “State and Local E-government: Prospects and Challenges.” The American Review of Public Administration 33(1):20–45.
- Eom, Seok-Jin. 2013. “Institutional Dimensions of E-government Development: Implementing the Business Reference Model in the United States and Korea.” Administration & Society 45(7):875–907.
- Fountain, Jane E., 2004. Building the Virtual State: Information Technology and Institutional Change. Washington, DC: Brookings Institution Press.
- Frumkin, Peter and Joseph Galaskiewicz. 2004. “Institutional Isomorphism and Public Sector Organizations.” Journal of Public Administration Research and Theory 14(3):283–307.
- Gallego-Álvarez, Isabel, Luis Rodríguez-Domínguez, and Isabel-María García-Sánchez. 2010. “Are Determining Factors of Municipal E-government Common to a Worldwide Municipal View? An Intra-Country Comparison.” Government Information Quarterly 27(4):423–430.
- Gil-García, J. Ramón, and Theresa A. Pardo. 2005. “E-government Success Factors: Mapping Practical Tools to Theoretical Foundations.” Government Information Quarterly 22(2):187–216.
- Ho, Alfred T. K. 2002. “Reinventing Local Governments and the E‐government Initiative.” Public Administration Review 62(4):434–444.
- Ho, Alfred T.K. and Anna Ya Ni. 2004. “Explaining the Adoption of E-government Features: A Case Study of Iowa County Treasurers’ Offices.” The American Review of Public Administration 34(2):164–180.
- Holden, Stephen H., Donald F. Norris, and Patricia D. Fletcher. 2003. “Electronic Government at the Local Level: Progress to Date and Future Issues.” Public Performance & Management Review 26(4):325–344.
- Holzer, Marc and Aroon Manoharan. 2016. Digital Governance in Municipalities Worldwide (2015-16). Seventh Global E-Governance Survey: A Longitudinal Assessment of Municipal Websites Throughout the World. Newark, NJ: E-Governance Institute, National Center for Public Performance, Rutgers University-Newark.
- Holzer, Marc, Aroon Manoharan, and Gregg Van Ryzin. 2010. “Global Cities on the Web: An Empirical Typology of Municipal Websites.” International Public Management Review 11(3):104–121.
- Jacobson, Carol, and Sang Ok Choi. 2008. “Success Factors: Public Works and Public-Private Partnerships.” International Journal of Public Sector Management 21(6):637–657.
- Jun, Kyu-Nahm, and Christopher Weare. 2010. “Institutional Motivations in the Adoption of Innovations: The Case of E-government.” Journal of Public Administration Research and Theory 21(3):495–519.
- Layne, Karen and Jungwoo Lee. 2001. “Developing Fully Functional E-government: A Four Stage Model.” Government Information Quarterly 18(2):122–136.
- Lee, Jungwoo. 2010. “10 Year Retrospect On Stage Models of E-government: A Qualitative Meta-synthesis.” Government Information Quarterly 27(3):220–230.
- Lee, Chung‐pin, Kaiju Chang, and Frances Stokes Berry. 2011. “Testing the Development and Diffusion of E‐government and E‐democracy: A Global Perspective.” Public Administration Review 71(3):444–454.
- Lee, Habin, Zahir Irani, Ibrahim H. Osman, Asim Balci, Sevgi Ozkan, and Tunc D. Medeni. 2008. “Research Note: Toward a Reference Process Model for Citizen-oriented Evaluation of E-government Services.” Transforming Government: People, Process and Policy 2(4):297–310.
- Ma, Liang. 2014. “Diffusion and Assimilation of Government Microblogging: Evidence from Chinese Cities.” Public Management Review 16(2):274–295.
- Manoharan, Aroon. 2013a. “A Three Dimensional Assessment of US County E-government.” State and Local Government Review 45(3):153–162.
- Manoharan, Aroon. 2013b. “A Study of the Determinants of County E-government in the United States.” The American Review of Public Administration 43(2):159–178.
- Manoharan, Aroon and Alex Ingrams. 2018. “Conceptualizing E-Government from Local Government Perspectives.” State and Local Government Review 50(1):56–66.
- Meijer, Albert, and Manuel Pedro Rodríguez Bolívar. 2016. “Governing the Smart City: A Review of the Literature on Smart Urban Governance.” International Review of Administrative Sciences 82(2):392–408.
- Merton, Robert. K. 1968. Social theory and social structure. New York, NY: Simon and Schuster.
- Moon, M. Jae. 2002. “The Evolution of E‐government Among Municipalities: Rhetoric or Reality?” Public Administration Review 62(4):424–433.
- Nam, Taewoo. 2014. “Determining the Type of E-government Use.” Government Information Quarterly 31(2):211–220.
- Norris, Donald. F., and M. Jae Moon. 2005. “Advancing E‐government at the Grassroots: Tortoise or Hare?” Public Administration Review 65(1):64–75.
- Overton, Michael. 2016. “Sorting Through the Determinants of Local Government Competition.” The American Review of Public Administration 47(8):914–928.
- Pratchett, Lawrence. 1999. “New Technologies and the Modernization of Local Government: An Analysis of Biases and Constraints.” Public Administration 77(4):731–751.
- Putnam, Robert. D. 1995. “Bowling Alone: America's Declining Social Capital.” Journal of Democracy 6(1):65–78.
- Reddick, Christopher. G. 2004. “A Two-Stage Model of E-government Growth: Theories and Empirical Evidence for US Cities.” Government Information Quarterly 21(1):51–64.
- Reddick, Christopher. G. 2009. “The Adoption of Centralized Customer Service Systems: A Survey of Local Governments.” Government Information Quarterly 26(1):219–226.
- Rodríguez, Luis, Isabel Maria García Sánchez, and Isabel Gallego Álvarez. 2011. “Determining Factors of E-government Development: A Worldwide National Approach.” International Public Management Journal 14(2):218–248.
- Rogers, Everett M. 1995. Diffusion of Innovations. 4th ed. New York: Free Press.
- Shipan, Charles R. and Craig Volden. 2012. “Policy Diffusion: Seven Lessons for Scholars and Practitioners.” Public Administration Review 72(6), pp.788–796.
- Stekhoven Daniel J. and Peter Bühlmann. 2012. “MissForest—Non-parametric Missing Value Imputation for Mixed-type Data.” Bioinformatics 28(1):112–18.
- Svara, James. 1999. “The Shifting Boundary Between Elected Officials and City Managers in Large Council-Manager Cities.” Public Administration Review 59(3):44–53.
- Tolbert, Caroline J., Karen Mossberger, and Ramona McNeal. 2008. “Institutions, policy innovation, and E‐Government in the American States.” Public Administration Review 68(3):549–563.
- United Nations. Department of Economics. 2010. United Nations E-Government Survey 2010: Leveraging e-government at a time of financial and economic crisis (Vol. 2). New York, NY: United Nations Publications.
- Wang, Xiaohu. 2001. “Assessing Public Participation in US Cities.” Public Performance & Management Review 24(4):322–336.
- Wang, Shu and Mary. K. Feeney. 2016. “Determinants of Information and Communication Technology Adoption In Municipalities.” The American Review of Public Administration 46(3):292–313.
- Weare, Christopher, Juliet A. Musso, and Matthew L. Hale. 1999. “Electronic Democracy and the Diffusion of Municipal Web Pages in California.” Administration & Society 31(1):3–27.
- West, Darrell. 2000. Assessing E-government: The Internet, Democracy and Service Delivery by State and Federal Governments. Providence, RI: Taubman Center for Public Policy, Brown University.
- West, Darrell. 2005. Digital Government: Technology and Public Sector Performance. Princeton, NJ: Princeton University Press.
- Yang, Kaifeng. 2003. “Neoinstitutionalism and E-government: Beyond Jane Fountain.” Social Science Computer Review 21(4):432–442.
- Zhang, Yahong and Richard C. Feiock. 2009. “City Managers’ Policy Leadership in Council-Manager Cities.” Journal of Public Administration Research and Theory 20(2):461–476.
- Ahn, Michael. J. 2011. “Adoption of E-communication Applications in US Municipalities: The Role of Political Environment, Bureaucratic Structure, and the Nature of Applications.” The American Review of Public Administration 41(4):428–452.
- Aladwani, Adel. M. 2016. “Corruption as a Source of E-government Projects Failure in Developing Countries: A Theoretical Exposition.” International Journal of Information Management 36(1):105–112.
- Åström, J., Karlsson, M., Linde, J., and Pirannejad, A. 2012. “Understanding the rise of e-participation in non-democracies: Domestic and international factors.” Government Information Quarterly 29(2):142–150.
- Azad, Bijan, Samer Faraj, Jie Mein Goh, and Tony Feghali. 2010. “What Shapes Global Diffusion of E-government: Comparing the Influence of National Governance Institutions.” Journal of Global Information Management 18(2):85–104.
- Basu, Subhajit. 2004. “E‐government and Developing Countries: An Overview. International Review of Law, Computers & Technology 18(1):109–132.
- Berntzen, Lasse, and Evika Karamagioli. 2010, February. “Regulatory Measures to Support eDemocracy.” In Digital Society, 2010. ICDS'10. Fourth International Conference (311-316), IEEE.
- Bhatti, Yosef, Asmus L. Olsen, and Lene Holm Pedersen. 2011. “Administrative Professionals and the Diffusion of Innovations: The Case of Citizen Service Centres.” Public Administration 89(2):577–594.
- Brudney, Jeffrey L., and Sally Coleman Selden. 1995. “The Adoption of Innovation by Smaller Local Governments: The Case of Computer Technology.” The American Review of Public Administration 25(1):71–86.
- Das, Amit, Harminder Singh, and Damien Joseph. 2017. “A Longitudinal Study of E-government Maturity.” Information & Management 54(4):415–426.
- Eom, Seok-Jin. 2013. “Institutional Dimensions of E-government Development: Implementing the Business Reference Model in the United States and Korea.” Administration & Society 45(7):875–907.
- Faniran, Sanjo, and Kayode Olaniyan. 2009, November. E-governance Diffusion in Nigeria: the Case for Citizens' Demand. In Proceedings of the 3rd International Conference on Theory and Practice of Electronic Governance (145-149), ACM.
- Feeney, Mary.K. and Adrian Brown. 2017. “Are Small Cities Online? Content, Ranking, and Variation of US Municipal Websites.” Government Information Quarterly 34(1):62–74.
- Gallego-Álvarez, Isabel, Luis Rodríguez-Domínguez, and Isabel-María García-Sánchez. 2010. “Are Determining Factors of Municipal E-government Common to a Worldwide Municipal View? An Intra-Country Comparison.” Government Information Quarterly 27(4):423–430.
- García-Sánchez, Isabel-María, Luis Rodríguez-Domínguez, and, Isabel Gallego-Álvarez. 2011. “The Relationship Between Political Factors and the Development of E–participatory Government.” The Information Society 27(4):233–251.
- Gulati, J. Girish, Christine B. Williams, and David J. Yates. 2014. “Predictors of On-line Services and E-participation: A Cross-National Comparison.” Government Information Quarterly 31(4):526–533.
- Guillamón, María-Dolores, Ana-María Ríos, Benedetta Gesuele, and Concetta Metallo. 2016. “Factors Influencing Social Media Use in Local Governments: The Case of Italy and Spain.” Government Information Quarterly 33(3):460–471.
- Ho, Alfred.T.K. and Anna Ya Ni. 2004. Explaining the Adoption of E-government Features: A Case Study of Iowa County Treasurers’ Offices. The American Review of Public Administration 34(2):164–180.
- Holden, Stephen H., Donald F. Norris, and Patricia D. Fletcher. 2003. “Electronic Government at the Local Level: Progress to Date and Future Issues.” Public Performance & Management Review 26(4):325–344.
- Holzer, Marc and Seang-Tae Kim. 2004. Digital Governance in Municipalities Worldwide (2003): An Assessment of Municipal Web Sites Throughout the World. Seoul, South Korea: Global e-Policy e-Government Institute, Sungkyunkwan University, and Newark, NJ: The E-Governance Institute/National Center for Public Productivity.
- Holzer, Marc and Seang-Tae Kim., 2006. Digital Governance in Municipalities Worldwide (2005): A Longitudinal Assessment of Municipal Websites Throughout the World. Seoul, South Korea: Global e-Policy e-Government Institute, Sungkyunkwan University, and Newark, NJ: The E-Governance Institute/National Center for Public Productivity.
- Holzer Marc and Seang-Tae Kim. 2008. Digital Governance in Municipalities Worldwide (2007): A Longitudinal Assessment of Municipal Websites Throughout the World. Newark, NJ: E-Governance Institute, National Center for Public Performance, Rutgers University; and Seoul, South Korea: The Global e-Policy e-Government Institute, Graduate School of Governance, Sunkyunkwan University.
- Holzer, Marc and Aroon Manoharan. 2016. Digital Governance in Municipalities Worldwide (2015-16). Seventh Global E-Governance Survey: A Longitudinal Assessment of Municipal Websites Throughout the World. Newark, NJ: E-Governance Institute, National Center for Public Performance, Rutgers University-Newark.
- Holzer, Marc and Aroon Manoharan. 2012. Digital Governance in Municipalities Worldwide (2011-12). Fifth Global E-Governance Survey: A Longitudinal Assessment of Municipal Websites Throughout the World. Newark, NJ: National Center for Public Performance, Rutgers University.
- Holzer, Marc, Min-Bong You and Aroon Manoharan. 2010. Digital Governance in Municipalities Worldwide (2009). Fourth Global E-Governance Survey: Findings of a Longitudinal Assessment of the Status of E-Governance in the Largest Municipality in the 100 Most Wired Nations. Washington, DC: Public Technology Institute.
- Holzer, Marc, Yueping Zheng and Aroon Manoharan. 2014. Digital Governance in Municipalities Worldwide (2013-14). Sixth Global E-Governance Survey: A Longitudinal Assessment of Municipal Websites Throughout the World. Newark, NJ: National Center for Public Performance, Rutgers University.
- Homburg, Vincent and Andres Dijkshoorn. 2012. “Diffusion of Personalized E-government Services Among Dutch Municipalities: An Empirical Investigation and Explanation.” In Vishanth Weerakkody & Christopher. G. Reddick (Eds.), Public Sector Transformation Through E-government: Experiences from Europe and North America, Routledge.
- Ifinedo, Princely. 2012. “Factors Influencing E-government Maturity in Transition Economies and Developing Countries: A Longitudinal Perspective.” ACM SigMIS Database 42(4):98–116.
- Khalil, Omar E., 2011. “e-Government readiness: Does national culture matter?” Government Information Quarterly 28(3):388–399.
- Krishnan, Satish, Thompson S. H. Teo, and Vivien K. G. Lim. 2013. “Examining the Relationships Among E-government Maturity, Corruption, Economic Prosperity and Environmental Degradation: A Cross-Country Analysis.” Information & Management 50(8):638–649.
- Lau, T.-Y., Aboulhoson, M., Lin, C. and Atkin, D. J. 2008. “Adoption of e-government in three Latin American countries: Argentina, Brazil and Mexico.” Telecommunications Policy 32(2):88–100.
- Lee, Chung‐pin, Kaiju Chang, and Frances Stokes Berry. 2011. “Testing the Development and Diffusion of E‐government and E‐democracy: A Global Perspective.” Public Administration Review 71(3):444–454.
- Ma, Liang. 2014. “Diffusion and Assimilation of Government Microblogging: Evidence from Chinese Cities.” Public Management Review 16(2):274–295.
- Manoharan, Aroon. 2013. “A Study of the Determinants of County E-government in the United States.” The American Review of Public Administration 43(2):159–178.
- Moon, M. Jae. 2002. “The Evolution of E‐government Among Municipalities: Rhetoric or Reality?” Public Administration Review 62(4):424–433.
- Nelson, Kimberly L., and James H. Svara. 2012. “Form of Government Still Matters: Fostering Innovation in US Municipal Governments.” The American Review of Public Administration 42(3):257–281.
- Norris, Donald. F., and M. Jae Moon. 2005. “Advancing E‐government at the Grassroots: Tortoise or Hare?” Public Administration Review 65(1):64–75.
- Pick, James B., and Rasool Azari. 2008. “Global Digital Divide: Influence of Socioeconomic, Governmental, and Accessibility Factors on Information Technology.” Information Technology for Development 14(2):91–115.
- Pratchett, Lawrence. 1999. “New Technologies and the Modernization of Local Government: An Analysis of Biases and Constraints.” Public Administration 77(4):731–751.
- Puron-Cid, Gabriel. 2012, October. “E-Government Success Factors in the Context of an IT-enabled Budget Reform: A Questionnaire Report.” In Proceedings of the 6th International Conference on Theory and Practice of Electronic Governance (336-345), ACM.
- Reddick, Christopher. G. 2004. “A Two-Stage Model of E-government Growth: Theories and Empirical Evidence for US Cities.” Government Information Quarterly 21(1):51–64.
- Reddick, Christopher. G. 2009. “The Adoption of Centralized Customer Service Systems: A Survey of Local Governments.” Government Information Quarterly 26(1):219–226.
- Reddick, Christopher G. and Donald F. Norris. 2013. “Social Media Adoption at the American Grass Roots: Web 2.0 or 1.5?” Government Information Quarterly 30(4):498–507.
- Savoldelli, Alberto, Cristiano Codagnone, and Gianluca Misuraca. 2012, October. “Explaining the eGovernment Paradox: An Analysis of Two Decades of Evidence from Scientific Literature and Practice on Barriers to eGovernment.” In Proceedings of the 6th International Conference on Theory and Practice of Electronic Governance (287-296), ACM.
- Schwester, Richard. 2009. “Examining the Barriers to E-government Adoption.” Electronic Journal of E-Government 7(1):113–122.
- Singh, Harminder, Amit Das, and Damien Joseph. 2007. “Country-Level Determinants of E-government Maturity.” Communications of the Association for Information Systems, 20(1):632–648.
- Stier, Sebastian. 2015. “Political Determinants of E-government Performance Revisited: Comparing Democracies and Autocracies.” Government Information Quarterly 32(3):270–278.
- Titah, Ryad, and Henri Barki. 2006. “E-government Adoption and Acceptance: A Literature Review.” International Journal of Electronic Government Research 2(3):23–57.
- Tolbert, Caroline J., Karen Mossberger, and Ramona McNeal. 2008. “Institutions, Policy Innovation, and E‐Government in the American States.” Public Administration Review 68(3):549–563.
- Van Veenstra, Anne Fleur, Marijn Janssen, and Yao-Hua Tan. 2010, August. “Towards an Understanding of E-government Induced Change–Drawing on Organization and Structuration Theories.” In International Conference on Electronic Government (1–12). Springer, Berlin.
- Wang, Shu and Mary. K. Feeney. 2016. “Determinants of Information and Communication Technology Adoption In Municipalities.” The American Review of Public Administration 46(3):292–313.
- Yun, Hyun Jung, and Cynthia Opheim. 2010. “Building on Success: The Diffusion of e-Government in the American States.” Electronic Journal of e-Government 8(1):71–82.
- Zheng, Yueping., Hindy L. Schachter, and Marc Holzer. 2014. “The Impact of Government form on E-participation: A Study of New Jersey Municipalities.” Government Information Quarterly 31(4):653–659.
- Zhao, Fang, Kathy Ning Shen, and Alan Collier. 2014. “Effects of National Culture on E-government Diffusion—A Global Study of 55 Countries.” Information & Management 51(8):1005–1016.
APPENDIX A
List of Works Cited in