
Abstract
PTP1B plays a key role in developing different types of cancer. However, the molecular mechanism underlying this effect is unclear. To identify molecular targets of PTP1B that mediate its role in tumorigenesis, we undertook a SILAC-based phosphoproteomic approach, which allowed us to identify Cdk3 as a novel PTP1B substrate. Substrate trapping experiments and docking studies revealed stable interactions between the PTP1B catalytic domain and Cdk3. In addition, we observed that PTP1B dephosphorylates Cdk3 at tyrosine residue 15 in vitro and interacts with it in human glioblastoma cells. Next, we found that pharmacological inhibition of PTP1B or its depletion with siRNA leads to cell cycle arrest with diminished activity of Cdk3, hypophosphorylation of Rb, and the downregulation of E2F target genes Cdk1, Cyclin A, and Cyclin E1. Finally, we observed that the expression of a constitutively active Cdk3 mutant bypasses the requirement of PTP1B for cell cycle progression and expression of E2F target genes. These data delineate a novel signaling pathway from PTP1B to Cdk3 required for efficient cell cycle progression in an Rb-E2F dependent manner in human GB cells.
INTRODUCTION
Glioblastomas (GB) or grade IV gliomas are the most common and aggressive malignant primary tumors in the central nervous system (CNS), with an incidence rate of 3.23 per 100,000 persons and a median age of 64 years.Citation1 GB patients have an overall survival rate of 15 months, even when receiving the standard therapy consisting of the maximum bearable surgical removal followed by radiotherapy and chemotherapy with temozolomide.Citation2 Therefore, it is necessary to understand better the molecular mechanisms underlying GB initiation and progression; and identify novel prognostic molecular markers to provide new therapeutic strategies. Recent studies on GB biology have revealed multiple alterations in pro-survival and anti-apoptotic signaling pathways. These include the Ras/RAF/MEK/ERK, PI3K/Akt/mTOR, and Src/Fak networks.Citation3–6
PTP1B is a classical nontransmembrane protein tyrosine phosphatase that plays a key role in metabolic signaling and is a promising drug target for type 2 diabetes and obesity.Citation7–9 Recent evidence indicates that PTP1B is overexpressed in different types of cancer. However, the role of PTP1B in GB development remains unclear.Citation10 For instance, it has been reported that PTP1B might be involved in the progression of different types of tumors by dephosphorylating and activating numerous oncogenic substrates. Moreover, several groups have recently shown that PTP1B dephosphorylates the inhibitory Y529 site in Src, thereby activating this kinase.Citation11–13 Another PTP1B substrate, p62Dok, might be involved in the positive effects of PTP1B on tumorigenesis. When p62DOK is phosphorylated, it forms a complex with p120RasGAP leading to decreased Ras/RAF/MEK/ERK activity.Citation14,Citation15
In contrast, when PTP1B dephosphorylates p62Dok, it can no longer bind to p120RasGAP with the consequent hyperactivation of Ras/RAF/MEK/ERK signaling, promoting cell proliferation and tumor growth. However, tissue samples from PTP1B- deficient breast cancer mouse models gave inconsistent results regarding the tyrosine phosphorylation status of p62Dok.Citation16,Citation17 For all the reasons above, it is essential to identify novel targets of PTP1B that could account for its protumorigenic effects.
We identified novel molecular targets of PTP1B that could mediate its promoting role in cancer using a SILAC-based strategy. This proteomic approach allowed us to identify more than 200 potential novel targets of PTP1B. This work focused on the cyclin-dependent kinase 3 (Cdk3), a protein involved in G0/G1 reentry and into G1/S transition in mammalian cells through the specific phosphorylation of Rb, which promotes its dissociation of the transcription factor E2F and activates the transcription of E2F responsive genes.Citation18,Citation19 Different research groups have demonstrated that CDC25 phosphatases activate Cdks through dephosphorylation of the Thr14 and Tyr15 residues in their ATP binding loop.Citation20,Citation21 However, the identity of the CDC25 family member responsible for the activation of Cdk3 remains unknown. Our results from the phosphoproteomics experiment point to the possibility that Cdk3 might be activated by PTP1B in a CDC25-independent manner. To test this hypothesis, we first performed local docking and molecular dynamics studies that revealed stable interactions between the PTP1B catalytic domain and Cdk3. In addition, in vitro phosphatase assays confirmed that a phosphopeptide corresponding to the residues 9–21 of Cdk3 is dephosphorylated by PTP1B at Tyr15. Next, we observed that a substrate trapping mutant of PTP1B co-immunoprecipitates with Cdk3 in HEK293 cells, that endogenous PTP1B and Cdk3 also co-immunoprecipitate in human GB cell lines, and that PTP1B interacts with Cdk3 in the nucleus and cytoplasm of human GB cells by using a proximity ligation assay. In addition, we found that the pharmacological inhibition of PTP1B with the allosteric inhibitors claramine and trodusquemine,Citation22 or its depletion with siRNAs leads to cell cycle arrest with the diminished activity of Cdk3 and its downstream effectors Rb and E2F. Finally, we observed that the expression of a constitutively active Cdk3 mutant in GB cells bypasses the requirement of PTP1B for cell cycle progression and expression of E2F target genes. These data delineate a novel signaling pathway from PTP1B to Cdk3 required for efficient cell cycle progression in an Rb-E2F-dependent manner in human GB cells.
RESULTS
Loss of PTP1B leads to increased phosphorylation of proteins involved in cell proliferation
PTP1B occupies a central position in oncogenic signaling. In the last decade, several substrates of this phosphatase have been validated.Citation23–25 However, additional substrates that mediate the oncogenic effects of PTP1B in different types of cancer remain to be determined. In order to identify potential PTP1B substrates that might explain its promoting role in tumorigenesis, we used a quantitative proteomics approach based on high-resolution LC-MS upon differential labeling of wild-type and KO fibroblastsCitation26 with SILAC media ( and ). This phosphoproteomic approach allowed the identification of more than 200 potential direct or indirect targets of PTP1B with diverse cellular functions, including cell signaling, cell cycle progression and proliferation, metabolism, differentiation, apoptosis, and transcription ( and Supplemental Tables S1 and S2). Among the proteins predicted to be PTP1B enzymatic targets, we focused on those known to be involved in tumorigenesis (). In particular, we decided to investigate further Cdk3, a protein involved in G0/G1 reentry and into G1/S transition in mammalian cells that recently has been linked to the development of breast, colon, and esophageal cancer.Citation19,Citation27,Citation28
FIG 1 Schematic illustration of the SILAC-based quantitative phosphoproteomic approach. (A) Representative Western blot of Ptp1b +/+ and Ptp1b −/− cells. (B) Ptp1b +/+ and Ptp1b −/− cells were cultured in “light” (red) or “heavy” (blue) medium and stimulated with EGF for 15 min. After lysis, the samples were mixed and incubated with antiphosphotyrosine antibodies for enrichment of tyrosine-phosphorylated proteins. Then, the phosphoprotein fraction was digested with trypsin, and phosphopeptides were enriched again with TiO2 beads. Phosphopeptides were analyzed by LC-MS/MS. (C) Proteins identified in this assay were classified according to their cellular function.
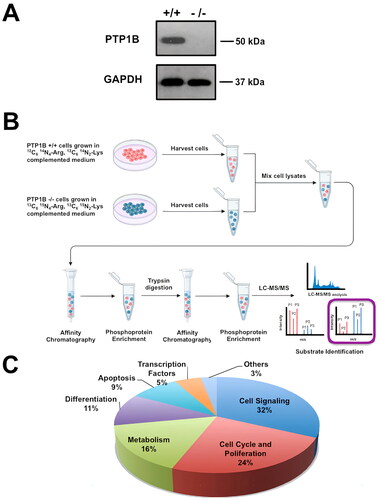
TABLE 1 Identification of cell cycle related substrates of PTP1B
TABLE 2 Minimal distance from the catalytic residues on PTP1B’s phosphatase domain to the phosphorous atom of its substrates
The cyclin-dependent kinase 3 (Cdk3) is a novel substrate of PTP1B
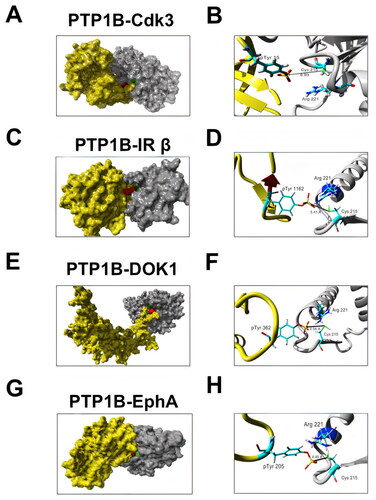
In order to determine if PTP1B dephosphorylates Cdk3 we performed peptide-protein docking experiments followed by molecular dynamics simulations. First, PEPstrMOD online platformCitation29 was used to predict the structure of the sequence of the Cdk3 peptide (KIGEGTpYGVVYKA), where the underlined residue corresponds to phosphoTyr15. Next, we generated the interaction model by docking in the ClusPro online server,Citation30,Citation31 using the crystal structure of PTP1B catalytic domain (PDB ID: 2HNP).Citation32 The image of the predicted complex shows that the phosphorylated Tyr15 of Cdk3 is in close proximity to the catalytic residue Cys215 located in the phosphatase domain of PTP1B, with a predicted distance of 3.4 Å, being within the distance range for the transition state of the dephosphorylation reaction (Supplementary Fig. 1A and B). Motivated by these results, we decided to perform protein-protein molecular docking studies with the complete structures of PTP1B and Cdk3. Since Cdk3 crystallographic structure has not been reported, its full structure was generated by homology modeling using Cdk2, (PBD ID: 1B38)Citation33 as a template due to the high identity between these two enzymes. Our results indicated that the ligand-binding energy for the complex was –1723.932 kcal/mol, and the catalytic residues Cys215 and Arg221 on PTP1B’s phosphatase domain were in close proximity to the phosphorous atom of Cdk3 phospho-Tyr15, with an estimated minimal distance of 4.21 Å ( and and ). In the proposed model, some basic residues such as Asp38 and Glu12 of Cdk3 interact with Arg 221, a critical residue of the catalytic site of PTP1B. This interaction seems to bring closer pTyr15 to the catalytic residue Cys 215 in PTP1B (Supplementary Fig. 1C). Similar values were obtained for a protein-protein docking model of PTP1B in complex with the IR β and DOK1, two well-characterized substrates of this phosphatase; and with the ephrin receptor EphA, one of the novel potential PTP1B substrates identified in our SILAC assay (ligand binding energies of −1677.228 kcal/mol, −1616.39 kcal/mol and −1304.71 kcal/mol, respectively, minimal distance from the catalytic residues on PTP1B’s phosphatase domain to the phosphorous atom of IR β phospho-Tyr1146, 4.18 Å, to the phosphorous atom of DOK1 phospho-Tyr362, 4.18 Å, and to the phosphorous atom of EphA phospho-Tyr772, 4.45 Å, respectively. and ). These results suggest that Cdk3 should be a suitable substrate for PTP1B. In addition, the plot of the RMSD variations indicates that the complexes predicted by molecular docking have a stable conformation during the simulation. The analysis of the variations in the distance between PTP1B and Cdk3 showed that it is lower than 2.5 Å, suggesting that PTP1B forms a stable complex with Cdk3 and theoretically can dephosphorylate it (Supplementary Fig. 1D).
FIG 2 Predicted structure of PTP1B in complex with some of the putative substrates identified by SILAC-based phosphoproteomics. (A) Visualization of the complex of Cdk3 (yellow) and the catalytic domain of PTP1B (grey). The catalytic residue Cys215 of PTP1B and pTyr15 of Cdk are indicated in green and red, respectively. (B) Closer view of the PTP1B-Cdk3 interaction. The distance between pTyr15 of Cdk3 and Cys215 of PTP1B is indicated. (C) Visualization of the complex of IR β (yellow) and PTP1B (grey). The catalytic residue Cys215 indicated in green is close to IR β pTyr1146 indicated in red. (D) Closer view of the PTP1B-IR β interaction. The distance between Cdk3 pTyr1146 and PTP1B Cys215 is indicated. (E) Visualization of the complex of DOK1 (yellow) and PTP1B (grey). The catalytic residue Cys215 indicated in green is close to DOK1 pTyr362 indicated in red. (F) Closer view of the PTP1B-DOK1 interaction. The distance between DOK1 pTyr362 and PTP1B Cys215 is indicated.(G) Visualization of the complex of EphA (yellow) and PTP1B (gray). The catalytic residue Cys215 indicated in green is close to EphA pTyr205 indicated in red. (F) Closer view of the PTP1B-EphA interaction. The distance between EphA pTyr205 and PTP1B Cys215 is indicated.
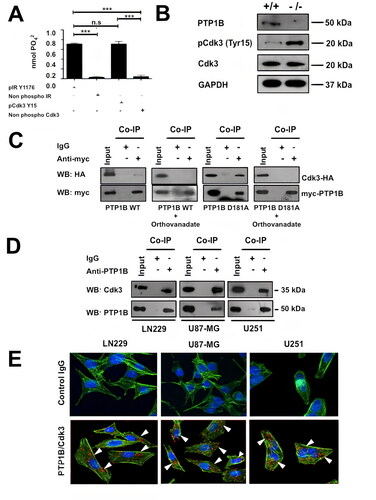
Next, we explored if Cdk3 is a PTP1B substrate using an in vitro phosphatase assay. To this end, purified PTP1B was incubated with a phosphopeptide corresponding to residues 9–21 of Cdk3 or a phosphopeptide derived from the IR β as a positive control. We observed that PTP1B dephosphorylated both peptides with the same efficiency, suggesting that Cdk3 is a substrate of PTP1B ().
FIG 3 PTP1B dephosphorylates a Cdk3 derived peptide in vitro and both proteins interact in GB cells. (A) The in vitro activity of PTP1B against a phosphopeptide corresponding to residues 9-21 of Cdk3 (KIGEGTpYGVVYKA) was determined by using a malachite-green based assay. An IR β phosphopeptide (TRDIpYETDYYRK) was used as positive control and the nonphosphorylated peptides of Cdk3 and IR β were used as negative controls. Each assay was independently repeated with four replicates and the nmol of phosphate released were calculated. Data are presented as means ± SE. (B). Assessment of Cdk3 activity in Ptp1b +/+ and Ptp1b −/− MEFs. Cell lysates were subjected to Western blot with anti-PTP1B, anti-Cdk3 or anti-phospho Cdk3 antibodies. GAPDH was used as loading control. (C) Co-immunoprecipitation of ectopically expressed wild-type or trapping mutant PTP1B and Cdk3. Cell lysates of transfected cells incubated with or without 1 mM of sodium orthovanadate were subjected to immunoprecipitation with anti-myc or isotype control IgG antibodies and the presence of Cdk3 in the complex was assessed with anti-HA antibodies. The presence of PTP1B and Cdk3 in cell extracts prior to immunoprecipitation was verified using specific antibodies (input). (D) Co-immunoprecipitation of endogenous PTP1B and Cdk3. LN229, U87-MG and U251 cell lysates were subjected to immunoprecipitation with anti-PTP1B or isotype control IgG antibodies and the presence of Cdk3 in the complex was assessed with anti-Cdk3 antibodies. The presence of PTP1B and Cdk3 in cell extracts prior to immunoprecipitation was verified using specific antibodies (input). (E) The physical interaction between endogenously expressed PTP1B and Cdk3 in LN229, U87-MG and U251 GB cells was determined using proximity ligation assays. The figure shows representative confocal microscopy images in which PTP1B-Cdk3 interactions appear as individual fluorescent red dots (lower panels). Anti-mouse and anti-rabbit isotype IgG antibodies were used as negative controls (upper panels).
PTP1B interacts with Cdk3 in a cellular context
Since PTP1B dephosphorylates a Cdk3 derived peptide in vitro, we confirmed by immunoblot whether PTP1B −/− MEFs display increased Cdk3 phosphorylation. Given the fact that most inbred strains of mice lack a functional Cdk3 protein because of the presence of a premature termination codon in the cdk3 gene,Citation34 we observed the expression of a C-terminal truncated kinase. However, this enzyme still possess the Cdk regulatory residues Thr14 and Tyr15 in their ATP binding loop, and displays an estimated molecular weight of 20 kDa (). Next, we confirmed whether both proteins interact in a cellular context. To this end, we examined the physical association between an ectopically expressed wild-type PTP1B or substrate-trapping mutant PTP1B D181A and a HA tagged Cdk3 in HEK293 cells by co-immunoprecipitation, our results showed a stable interaction between PTP1B D181A and Cdk3. As expected, treatment with orthovanadate, a general PTP inhibitor that covalently modifies the nucleophilic Cys, disrupted complex formation between PTP1B-D181A and Cdk3 (). Peptide-protein docking experiments followed by molecular dynamics simulations showed that the substrate-trapping mutant PTP1B-Cdk3 complex is very similar to the wild-type PTP1B-Cdk3 model. However, the pTyr15 residue of Cdk3 remains in close proximity to the catalytic Cys215 of PTP1B D181A (Supplemental Fig. 1E). In addition, endogenous PTP1B and Cdk3 complexes were also co-immunoprecipitated from human LN229, U87-MG and U251 GB cell lines (). We then examined the interaction of endogenous PTP1B and Cdk3 in LN229, U87-MG, and U251 GB cells by proximity ligation assays using the corresponding two primary antibodies raised in different species. Then, the cells were incubated with species-specific secondary antibodies attached to a unique DNA strand (PLA probes). If the PLA probes are located less than 40 nm apart in the cell, the DNA strands can interact, forming a circle that can be amplified by DNA polymerase. Hybridization with complementary fluorescent oligonucleotide probes allows the visualization of PTP1B-Cdk3 interactions as fluorescent red dots. The results revealed multiple loci of interactions between endogenous PTP1B and Cdk3 in the cytoplasm and nucleus in LN229, U87-MG, and U251 cells. The highest number of PTP1B and Cdk3 interactions was observed in LN229 and U251 cells. The number of PTP1B-Cdk3 interaction events in U-87 MG cells was 30% and 35% lower (P < 0.05) than in LN229 and U251 cells, respectively. Mouse and rabbit IgGs were used as negative controls ().
Altogether, our results suggest that Cdk3 is a novel substrate of PTP1B and that both proteins physically interact in a cellular context.
Inhibition of PTP1B induces G1/S arrest and impairs Cdk3 activity in human glioblastoma cells
Since Cdk3 is involved in G0/G1 reentry and into G1/S transition in mammalian cells,Citation18,Citation19 we hypothesized that PTP1B inhibition might lead to a decrease in Cdk3 activity with the consequent reduced cell proliferation and/or cell cycle arrest. To test this idea, LN229, U87-MG, and U251 cells were first transfected with siRNAs targeting PTP1B or Cdk3, 48 h posttransfection the cells were lysed and analyzed by western blot, where we observed the specific loss of the intended target (). Next, we tested the effect of PTP1B pharmacological inhibition or depletion in cell proliferation. Our results showed that LN229, U-87 MG and U251 cells treated with 2 µM of the allosteric PTP1B inhibitors claramine or trodusquemine had a significant reduction in cell proliferation compared with vehicle treated cells. Moreover, PTP1B and Cdk3 depleted cells displayed a more dramatic reduction in cell proliferation compared with nontargeting siRNAs transfected cells (). In addition, the effect of both PTP1B inhibitors in the proliferation of wild-type and PTP1B deficient MEFs was also assessed. Our results showed a significant reduction in the proliferation of wild-type fibroblast, but no effect in the proliferative activity of the PTP1B deficient fibroblast (). To further understand the biological relevance of PTP1B-Cdk3 interaction, we analyzed the effect of PTP1B pharmacological inhibition on Cdk3 activity and cell cycle progression. First, LN229, U-87 MG, and U-251 cells were synchronized by serum deprivation for 48 h. Then, the cells were treated with vehicle or 2 µM of claramine or trodusquemine during 3 h and the cell cycle arrest was released by the addition of serum. The cells were lysed at the indicated time points and the activity of Cdk3 was assessed by Western blot. Our results indicated that 12 h after serum stimulation Cdk3 is active in vehicle treated cells, whereas it remains on its inactive phosphorylated form in claramine and trodusquemine treated cells, suggesting that PTP1B inhibition impairs Cdk3 activation ( to ).
FIG 4 PTP1B and Cdk3 depletion impairs cell proliferation. (A) GB cells were transfected with siRNAs targeting PTP1B or Cdk3, and the expression of both proteins was assessed by immunoblot. GAPDH was used as loading control. (B) GB cells were synchronized at G0 by serum deprivation and incubated 3 h with vehicle, claramine 2 µM, trodusquemine 2 µM, or transfected with nontargeting siRNAs or siRNAs targeting PTP1B or Cdk3. Cells were counted every 24 h. Proliferation of LN229, U87-MG and U251 cells is represented as mean ± SE of three independent experiments. (C) Ptp1b +/+ and Ptp1b −/− MEFs were synchronized at G0 by serum deprivation and incubated 3 h with vehicle, claramine 2 µM, trodusquemine 2 µM. Cells were counted every 24 h. Proliferation of Ptp1b +/+ and Ptp1b −/− MEFs is represented as mean ± SE of three independent experiments.
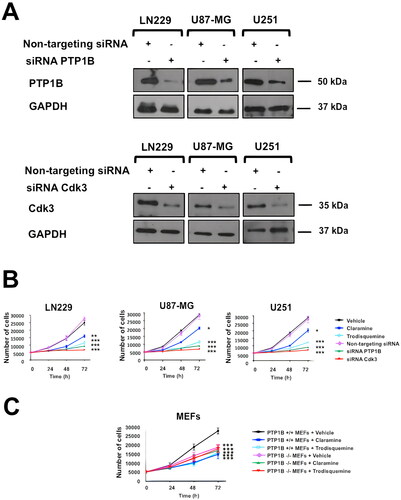
FIG 5 PTP1B reduced activity impairs Cdk3 activation and induces cell cycle arrest in human GB cells. GB cells were synchronized at G0 by serum deprivation for 48 h and incubated 3 h with vehicle (A), claramine 2 µM (B), or trodusquemine 2 µM. Cell cycle arrest was released by the addition of 10% FBS and cells were collected at the indicated times. The activity of Cdk3 was assessed by immunoblot. GAPDH was used as loading control. (D) GB cells were synchronized at G0 and incubated 3 h with vehicle, claramine 2 µM or trodusquemine 2 µM as previously mentioned, or transfected with nontargeting siRNAs or siRNAs targeting PTP1B or Cdk3. Cell cycle arrest was released by the addition of 10% FBS, cells were fixed at indicated time points and stained with propidium iodide. Quantification of the percentage of cells at each phase is represented. Statistical differences between control and experimental groups of cells are indicated (*P < 0.05). Data are representative of three independent experiments.
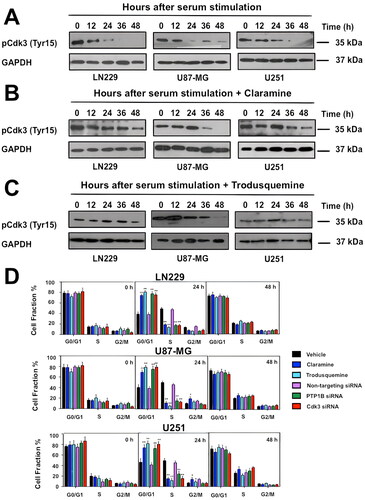
Next, we studied the effect of PTP1B inhibition or depletion in cell cycle progression. To this end, LN229, U87-MG, and U251 cells were synchronized by serum deprivation for 48 h, incubated with vehicle, 2 µM of claramine or trodusquemine, or transfected with nontargeting siRNAs or with siRNAs targeting PTP1B or Cdk3. the cell cycle arrest was released by the addition of serum and the cells were collected every 12 h. Our results indicated that human GB cells treated with claramine or trodusquemine presented a marked arrest in G0/G1 phase compared to vehicle-treated cells. This effect was also observed in PTP1B and Cdk3 depleted cells, suggesting that PTP1B and Cdk3 are essential regulators of cell cycle progression in human GB cells ().
We next proved the effect of PTP1B inhibition on the activation of Cdk3 and its downstream effectors in human GB cells. LN229, U87-MG, and U251 cells were serum-starved during 48 h, incubated for 3 h in the presence of vehicle, claramine or trodusquemine, and stimulated with 10% of FBS. Cells were collected and the phosphorylation levels of Cdk3 and Rb were analyzed by Western blot. Our results indicate that PTP1B inhibition prevented the activation of Cdk3 with the consequent hypophosphorylation of its downstream target Rb (). Similarly, PTP1B knock down with siRNAs had a similar effect on Cdk3 and Rb phosphorylation levels (). Considering that the phosphorylation of Rb is crucial to E2F transcription factor activity, we analyzed the expression levels of some E2F target genes necessary for G1/S transition by RT-qPCR. Since Cdk3 pTyr15 levels were significantly decreased at 24 h after cell cycle release in all the vehicle treated GB cell lines but not in claramine or trodusquemine treated cells ( to ), we selected this time point for measuring the expression of Cyclin A, Cyclin E1 and Cdk1. We observed that PTP1B inhibition with either claramine or trodusquemine repressed the expression of Cyclin A, Cyclin E1, and Cdk1 in all GB cell lines (), suggesting that PTP1B regulates cell cycle progression through the activation of Cdk3-Rb signaling. In order to confirm this idea, we asked if constitutively activated Cdk3 bypasses the requirement for PTP1B in cell cycle progression. Since in HeLa cells, the expression of a Cdk1 Thr14Ala/Tyr15Phe mutant (Cdk1 AF), allows S phase arrested cells enter into G2/M,Citation35 we created a HA-tagged Cdk3 expression vector containing the same mutations by site-directed mutagenesis. LN229, U-87 MG and U251 cells were transfected with the Cdk3 AF plasmid, and the expression of mutant Cdk3 was assessed by Western blot using an anti-HA antibody (). These cells displayed a partial rescue in cell proliferation and serum starvation did not induce cell cycle arrest. The differences observed in the percentage of cells in G0/G1, S and G2/M in the different cell lines might be the result of expressing a constitutively active Cdk3 mutant. Therefore, the expression levels of E2F target genes are higher in Cdk3 AF expressing cells, even in the presence of claramine or trodusquemine ( to ). In contrast, mock transfected cells treated with claramine or trodusquemine displayed reduced levels of cyclin A, cyclin E1 and Cdk1. Together, our results suggest that PTP1B regulates G1/S transition and promotes the expression of E2F downstream targets through the activation of Cdk3-Rb signaling, supporting the view that PTP1B is crucial for cell cycle regulation in GB ().
FIG 6 PTP1B reduced activity negatively affects Cdk3/Rb/E2F signaling in human GB cells. (A) The activities of Cdk3 and Rb in GB cells treated with vehicle, claramine 2 µM or trodusquemine 2 µM were assessed by immunoblot using total and phospho-specific antibodies. (B) The activities of Cdk3 and Rb in GB cells transfected with siRNAs targeting PTP1B were assessed by immunoblot using total and phospho-specific antibodies. (C) The expression levels of the E2F target genes: Cdk1, Cyclin A, and Cyclin E1 were assessed by RT-qPCR. All data were normalized to control GAPDH. Fold changes were calculated using the ΔCt method (2-ΔΔCt). Data are representative of three independent experiments.
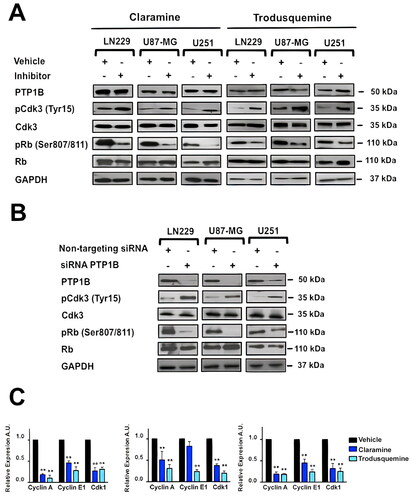
FIG 7 Activated Cdk3 bypasses requirement for PTP1B for proliferation and cell cycle progression. (A) GB cells were transfected with a plasmid encoding a constitutively active Cdk3 mutant. The presence of Cdk3 AF in cell extracts was verified by Western blot using anti-HA antibodies. (B) GB cells were mock transfected or transfected with a plasmid encoding a constitutively active Cdk3 mutant and incubated 3 h with vehicle, claramine 2 µM or trodusquemine 2 µM. Cells were counted every 24 h. Proliferation of LN229, U87-MG and U251 cells is represented as mean ± SE of three independent experiments. (C) GB cells were mock transfected or transfected with a plasmid encoding a constitutively active Cdk3 mutant, synchronized at G0 and incubated 3 h with vehicle, claramine 2 µM or trodusquemine 2 µM as previously described. Cell cycle arrest was released by the addition of 10% FBS, cells were fixed at indicated time points and stained with propidium iodide. Quantification of the percentage of cells at each phase is represented in the bar graphics. Statistical differences between control and experimental groups of cells are indicated (*P < 0.05). Data are representative of three independent experiments. (D) GB cells were mock transfected or transfected with a plasmid encoding a constitutively active Cdk3 mutant, synchronized at G0 and incubated 3 h with vehicle, claramine 2 µM or trodusquemine 2 µM as previously mentioned. Cell cycle arrest was released by the addition of 10% FBS. The expression levels of the E2F target genes: Cdk1, cyclin A, and cyclin E1 were assessed by RT-qPCR. All data were normalized to control GAPDH. Fold changes were calculated using the ΔCt method (2-ΔΔCt). Data are representative of three independent experiments.
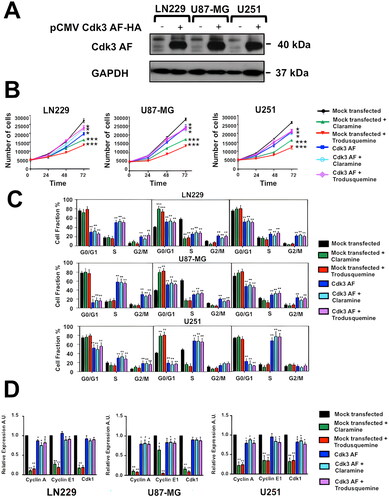
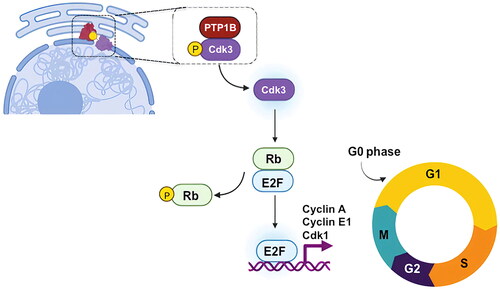
Figure 8 Proposed model for PTP1B regulation of cell cycle. PTP1B dephosphorylates and activates Cdk3, which in turn phosphorylates Rb, favoring its dissociation from E2F and promoting the expression of genes needed for the progression to S phase.
DISCUSSION
Recent evidence suggests that PTP plays an essential role in the development and progression of different types of cancer.Citation10,Citation36,Citation37 For example, Ptpn1 gene is commonly amplified in breast, colon, prostate and gastric cancer.Citation38–41 In addition, recent reports indicate that PTP1B overexpression is associated with poor prognosis in several solid tumors, with a high PTP1B expression linked to poor outcome, including shortened progression-free and overall survival.Citation41–44 However, the molecular mechanisms that explain the contribution of PTP1B and its downstream targets to carcinogenesis are not entirely understood. For example, it is well documented that PTP1B dephosphorylates and activates some oncogenic substrates, such as Src,Citation11–13 and, p62Dok, leading to increased Ras/RAF/MEK/ERK activity.Citation14,Citation15 Previous reports have also shown that PTP1B inhibition is associated with the induction of G0/G1 cell cycle arrest in pancreatic cancer cells,Citation44–46 and that PTP1B inhibition induces a G2 cell cycle arrest in renal cell carcinoma, pancreatic and hepatic cancer cells.Citation47,Citation48 Accordingly, several cell cycle regulators of the G1/S transition, such as Cdk2, Cdk4 and Cyclin D1, were downregulated in PTP1B depleted cells. Interestingly, the molecular mechanism by which PTP1B regulates cell cycle progression in these cellular models has not been explored.
In this work, we identified some novel substrates of PTP1B that could explain its role in cell cycle progression by using a SILAC-based phosphoproteomic approach. Our results indicate that Cdk3 is a new PTP1B target in GB cells. This conclusion is supported by our docking and molecular dynamics simulations, the ability of PTP1B to dephosphorylate in vitro a Cdk3 derived phosphopeptide, and to interact with it in the cytoplasm and nuclei of different human GB cell lines. In addition, the pharmacological inhibition or knockdown with siRNAs of PTP1B promoted a G0/G1 cell cycle arrest in vitro in the four human GB cell lines used in this study. Previous reports have shown that Cdk3 activity fluctuates from the G0 to S phase and reaches its peak in the mid G1 phase, driving Rb phosphorylation at Ser807/811, and modulating the transcriptional activity of E2F.Citation18 Moreover, Cdk3 regulates the activity of several transcription factors such as c-Jun, ATF-1 and NFAT3 among others.Citation49–52 In that regard, the observed antiproliferative effect, the G0/G1 cell cycle arrest, and the consequent downregulation of some cell cycle regulators needed for the G1/S transition after PTP1B inhibition was not totally unexpected. These findings are compatible with recent experiments in which loss of PTP1B induced a G0/G1cell cycle arrest in some types of cancer.Citation44–46 Conversely, another report indicates that during mitotic arrest in chronic myeloid leukemia cells, PTP1B is phosphorylated by Cdk1 and Plk1, increasing its catalytic activity and inducing mitotic catastrophe, suggesting that in this model, PTP1B acts as a tumor-suppressor.Citation53 However, our results show for the first time that PTP1B regulates cell cycle progression through the activation of a Cdk, and acts as an oncogene in human GB cells.
Moreover, our results showed that PTP1B inhibition or depletion downregulates the expression of some E2F genes required for G1/S transition, indicating that in our model, cell cycle progression may be regulated in part by a PTP1B/Cdk3/Rb/E2F signaling pathway. Finally, we showed that activated Cdk3 bypasses the need for PTP1B in human GB cells. These results suggest that Cdk3 is a key target in mediating the oncogenic role of PTP1B in human GB cells. While no cell line faithfully recapitulates GB biology, the three cell lines used in this study share some of its cellular and molecular features, regardless of some important genetic differences among them. Our findings may serve as new therapeutic avenues for the treatment of GB. However, further in vivo studies are needed in order to demonstrate that PTP1B inhibition would be useful for the treatment of these tumors.
Finally, the activation mechanism of Cdk3 needs to be studied in more detail. For instance, there are no previous reports showing a CDC25-independent activation of other Cdks, and the identity of the CDC25 family member responsible for the activation of this Cdk remains unknown. Further studies are needed in order to determine if PTP1B and some CDC25 family member cooperatively or competitively regulate Cdk3 activation.
MATERIALS AND METHODS
Antibodies and reagents
Antibodies used for Western blot or PLA included anti PTP1B (sc-133258) from Santa Cruz Biotechnology (Dallas, TX. USA), HA-tag (#3724), myc-tag (#2276), Rb (#9309), phospho-Rb (Ser807/811) (#8516), and GAPDH (#5174) from Cell Signaling Technology (Boston, MA. USA). Anti-Cdk3 (ab191503) and anti-phospho Cdk1/2/3 (Tyr15) (ab133463) from Abcam (Cambridge, MA. USA). Secondary antibodies conjugated to peroxidase (Goat anti-mouse cat #115-035-003 and Goat anti-rabbit cat #111-035-003) were purchased from Jackson ImmunoResearch Laboratory (West Grove, PA. USA). The allosteric PTP1B inhibitors claramine and trodusquemine (MSI-1436) were purchased from Sigma-Aldrich (Burlington, MA, USA) and MedChem Express (Princeton, NJ. USA), respectively.
DNA constructs and siRNAs
The pcDNA4.1 myc/His PTP1B wild-type and pcDNA4.1 myc/His PTP1B D181A plasmids were a gift from Dr Michel L. Tremblay (McGill University).Citation54 The pCMV Cdk3-HA plasmid was a gift from Dr Sander van den Heuvel (Utrecht University) (Addgene plasmid # 1881).Citation55 The pCMV Cdk3 AF-HA plasmid was generated using the QuickChange Site-Directed Mutagenesis kit (Stratagene, La Joya, CA, USA). The primer sequences for mutagenesis were Cdk3 AF Fwd: 5′ aagatcggagagggcgcctttggggtggtgtacaa 3′ and Cdk3 AF Rev: 5′ ttgtacaccaccccaaaggcgccctctccgatctt 3′. siRNAs targeting human PTP1B (sc-36328) and Cdk3 (sc-37578) were obtained from Santa Cruz (Dallas, TX, USA).
Cell culture
Ptp1b−/− and Ptp1b+/+ MEFs were a gift from Dr Benjamin Neel (New York University)Citation26; these cells were maintained in DMEM (Gibco BRL, Walthman, MA, USA) supplemented with 10% FBS, 50 U/mL penicillin, and 50 μg/mL streptomycin. HEK293T, LN-229, U251, and U-87 MG cells were obtained from American Type Culture Collection (Manassas, VA, USA), and maintained in DMEM (Gibco BRL, Walthman, MA, USA) supplemented with 10% FBS, 50 U/mL penicillin, and 50 μg/mL streptomycin.
For SILAC experiments, Ptp1b−/− and Ptp1b+/+ cells were grown in media containing 12C6,14N4-Arg and 12C6,14N2-Lys, or 13C6,15N4-Arg and 13C6,15N2-Lys (Thermo Fisher Scientific, Waltham, MA, USA) until the populations went through six passages. Then, cells were starved for 3 h prior to ligand stimulation with EGF (50 ng/mL, 10 min; PeproTech, Rocky Hill, NJ, USA), and were lysed in ice-cold lysis buffer (50 mM Tris-HCl, pH 7.5, 150 mM NaCl, 1% Nonidet P-40, 0.1% sodium deoxycholate, 1 mM EDTA, 1 mM sodium orthovanadate, 1 mM PMSF, 0.1 μg/mL aprotinin, 10 mM NaF) for 20 min. Lysates were precleared by centrifugation at 16,500 × g for 15 min. Protein amount determination was performed using the Bradford assay (Bio-Rad, Hercules, CA, USA). In SILAC experiments, cell lysates were mixed 1:1 (double labeling).
Anti-phosphotyrosine immunoprecipitation
For immunoprecipitation, 200 μg of anti-phosphotyrosine 4G10 antibody (cat # ZMS16282, Sigma-Aldrich, St Louis, MO, USA) were added together with 40 μL of protein A-Sepharose (GE Healthcare, Chicago, IL, USA) to mixed cell lysates containing up to 20 mg of total labeled proteins and incubated at 4 °C for 4 h. Precipitates were washed four times with lysis buffer, and precipitated proteins were eluted twice with urea buffer (7 M urea, 2 M thiourea, 50 mM HEPES, pH 7.5, 1% n-octyl glucoside) at 37 °C for 10 min.
In-solution protein digestion
After anti-phosphotyrosine immunoprecipitation, precipitated proteins were denatured in the urea buffer described above, and protein amount was measured using the Bradford assay (Bio-Rad, Hercules, CA, USA). Proteins were reduced by adding 2 mM DTT (final concentration) at 25 °C for 45 min, and thiols were carboxymethylated with 5.5 mM iodoacetamide at room temperature for 30 min. Endoproteinase Lys-C was added in an enzyme/substrate ratio of 1:100, and the proteins were digested at room temperature for 4 h. The resulting peptide mixtures were diluted with water to reach a final urea concentration below 2 M. For double digestion, modified trypsin (sequencing grade, Promega, Madison, WI, USA) was added in an enzyme/substrate ratio of 1:100, and the digest was incubated at room temperature overnight. Trypsin activity was quenched by adding TFA to a final concentration of 1%.
Titansphere enrichment of phosphopeptides
After trypsin digest, phosphopeptides were enriched using Titansphere chromatography (TiO2) columns as previously described.Citation56,Citation57 Peptide samples were diluted 1:6 with 30 g/L 2,5-dihydroxybenzoic acid (DHB) in 80% ACN, 0.1% TFA. 5 μg of TiO2 beads (GL Sciences Inc., Torrance, CA, USA) were washed once with elution buffer (NH3 water in 20% ACN, pH 10.5) and equilibrated with washing buffer (50% ACN, 0.1% TFA). TiO2 beads were loaded with DHB by washing with loading buffer (6 g/L DHB in 15% ACN). Peptide samples were loaded onto TiO2 beads for 30 min at room temperature on a rotating wheel. Subsequently, beads were washed three times with washing buffer, and bound phosphopeptides were eluted twice with 50 μL of elution buffer at room temperature for 10 min. The eluates were filtered through STAGE Tips in 200-μL pipette tips. 30 μL of 80% ACN, 0.5% acetic acid was applied to the STAGE Tips after filtering,Citation58 and the flow-through was combined with the filtered sample. The pH value of the sample was adjusted with TFA to a value of approximately pH 7, and the eluates were concentrated in a vacuum concentrator. Before MS analysis, 5% ACN and 0.1% TFA (final concentrations) were added to the samples.
LC-MS/MS analysis
Mass spectrometric analysis was performed by nanoscale LC–MS/MS using an LTQ-Orbitrap Velos instrument (Thermo Fisher Scientific, Waltham, MA, USA) coupled to an Ultimate U3000 (Dionex Corporation, Sunnyvale, CA, USA) via a Proxeon nanoelectrospray source (Proxeon Biosystems, Denmark). Peptides were separated on a 75 μM PepMap C18 nano column.
Data were acquired in data-dependent mode: full scan spectra were acquired with a resolution of 60,000 after accumulation of 1,000,000 ions. The “lock mass” option was used to improve the mass accuracy of precursor ions. The ten most intense ions were fragmented by collision-induced dissociation (CID) with a normalized collision energy of 35% and recorded in the linear ion trap (target value of 5000) based on the survey scan and in parallel to the orbitrap detection of MS spectra. Peptide identification was performed using the MASCOT search engine. The mass spectrometry proteomics data have been deposited to the ProteomeXchange Consortium via the PRIDE Citation59 partner repository with the dataset identifier PXD046000.
Model of the binding complex of PTP1B catalytic domain and Cdk3
To generate a model that could show the interaction of Cdk3 and its derived peptide (sequence: KIGEGTpYGVVYKA where the underlined pY corresponds to phospho-Tyr15), we decided to perform peptide-protein and protein-protein docking experiments followed by molecular dynamics simulations. First, PEPstrMOD online platformCitation29 was used to predict the structure of the sequence of Cdk3 phosphopeptide while Cdk3 full structure was generated using Cdk2 (PBD ID: 1B38)Citation33 as a template due to the high identity (76.43%) between these two enzymes with the homology modeling module implemented as part of Yasara Structure v.18.4.24. The resulting 3D model for Cdk3 was then used for protein-protein docking experiments. The catalytic domain of PTP1B was also downloaded from the PDB with the accession code (PDB ID: 2HNP).Citation32
ClusPro online server https://cluspro.bu.edu/Citation31,Citation60,Citation61,Citation62 was used for the docking experiments. ClusPro 2.0 generates conformations based on different desolvation and electrostatic potential; those conformations are categorized through clustering.
Molecular dynamics simulations were performed in duplicate using Yasara Structure v. 18.4.24Citation63,Citation64 using the AMBER 14 force field using a previously reported protocol.Citation65 Briefly, each complex was embedded within a TIP3 water box with 10 Å to the box boundary. Periodic boundary conditions were considered. The temperature was set to 298 K, pH to 7.4, with the addition of sodium and chlorine ions for charge neutralization. A Particle Mesh Ewald (PME) algorithm with a cut-off radius of 8 Å was applied. Steepest descent energy minimization was performed, and then a total simulation time of 100 ns with a time step of 2.5 fs was carried out, recording snapshots at intervals of 500 ps. The analysis of the resulting trajectories was performed with a script included as part of Yasara software and included the root mean square deviation (RMSD) and the distance of the catalytic Cys215 and Arg221 on PTP1B’s phosphatase domain and the phosphorus atom on Cdk3 phospho-Tyr15.
For the models of IR β, DOK1 and EphA, the initial structures were retrieved from AlphaFold.Citation66 These structures were minimized using the same protocol in molecular dynamics as described before, for a total simulation time of 100 ns. Then, the complexes of PTP1B and these optimized structures were predicted using ClusPro under the same conditions as explained for the complexes with Cdk3.
In vitro phosphatase assay
According to the manufacturer’s suggested protocol, the in vitro phosphatase assays were performed using the Protein Tyrosine Phosphatase 1B Assay Kit, Colorimetric (Sigma-Aldrich. St Louis, MO, USA). We designed a phosphopeptide for the PTP1B-dependent phosphosite on Cdk3 (pY15: KIGEGTpYGVVYKA). In addition, we included a known PTP1B substrate peptide derived from the IR β (pY1146: TRDIpYETDYYRK), as a positive control, and the nonphosphorylated peptides of Cdk3 and IR β as negative controls. These peptides were synthesized (95% purity, PROBIOTEK, San Nicolás de los Garza, NL, Mexico) and, prior to assays, and freshly diluted to 150 µM final concentration in 1× Assay Buffer (150 mM NaCl, 50 mM MES, 1 mM DTT, 1 mM EDTA, 0.05% NP-40, pH 7.2). The reactions were performed in triplicate in a 96-well plate at 30 °C, adding 75 µM of each phosphopeptide and 2.5 ng of recombinant PTP1B for 30 min. The addition of malachite green solution terminated the reactions, and the absorbance was measured at 620 nm on an Epoch 2 microplate reader (Tekan, Winoosky, VT, USA).
Immunoblotting and co-immunoprecipitation
GB cells were lysed in RIPA buffer (20 nM Tris-HCL pH 7.4, 150 nM NaCl, 1 mM EDTA, 1% Triton X-100, 0.5% SDS, 1% sodium deoxycholate, 1X protease inhibitor Cocktail and 1X PhosSTOP (Sigma-Aldrich, St Louis, MO, USA). Immunoblots on Immobilon-P membranes (Millipore, Burlington, MA, USA) were blocked in 5% nonfat dried milk in TBS-Tween-20 0.5% or 1% BSA, incubated primary and secondary antibodies, and visualized using enhanced chemiluminescence reagents (ECL, Amersham Pharmacia, Buckinghamshire, UK).
For co-immunoprecipitation cells were lysed in the presence or absence of 1 mM of sodium orthovanadate for 30 min in PBSCM buffer (100 mM Na2PO4, 150 mM NaCl, pH 7.2, 1 mM CaCl2, 1 mM MgCl2 and 5 µM ATP), homogenized and centrifuged at 13,500 rpm for 10 min at 4 °C. The supernatants were recovered, clarified and incubated with primary antibodies or mouse or rabbit IgG isotype control antibodies for 4 h at 4 °C, and incubated with Protein G Sepharose beads (GE Healthcare. Braunschweig, Germany). The immune complexes were washed three times with PBSCM buffer and the bound material was eluted using sample buffer for 5 min at 90 °C. The eluate was resolved on 10% SDS-PAGE and analyzed by immunoblot. All the antibodies were used at concentrations as recommended by the supplier.
Proximity ligation assay
According to the manufacturer’s instructions, PLA experiments were performed using Duolink® kit (DUO92101, Sigma-Aldrich, St Louis, MO, USA). A total of 4000 cells of each cell line were plated in 16 well chambers (178599, Nunc Lab-Teck, Thermo Scientific, Waltham, MA, USA) in DMEM medium with 10% fetal bovine serum and incubated at 37 °C under a 95% air and 5% CO2 atmosphere for 24 h. Cells were fixed with PBS/PFA 4% for 15 min and permeabilized with 0.5% Triton X-100 for 30 min. Then, cells were blocked with 40 μL of blocking solution in a humidity chamber at 37 °C for 1 h, and incubated with the primary antibodies: polyclonal rabbit antibody against PTP1B (2 µg/mL; #5311; Cell Signaling Technology, Boston, MA, USA) and monoclonal mouse antibody against Cdk3 (2 µg/mL; sc-81836; Santa Cruz Biotechnology, Dallas, TX, USA) at 4 °C overnight. To detect the primary antibodies, secondary proximity probes binding rabbit and mouse immunoglobulin (PLA probe rabbit PLUS and PLA probe mouse MINUS, Olink Bioscience, Sigma-Aldrich, St Louis, MO, USA) were diluted 1:15 and 1:5 in blocking solution, respectively. Cells were then incubated with the proximity probe solution at 37 °C for 1 h, washed three times in 50 mM Tris pH 7.6, 150 mM NaCl, 0.05% Tween-20 (TBS-T), and incubated with the hybridization solution containing connector oligonucleotides (Olink Bioscience, Sigma-Aldrich, St Louis, MO, USA) at 37 °C for 45 min. Samples were washed with TBS-T and subsequently incubated in the ligation solution at 37 °C for 45 min. The ligation solution contained T4 DNA ligase (Fermentas, Sigma-Aldrich, St Louis, MO, USA), allowing the ligation of secondary proximity probes and connector oligonucleotides to form a circular DNA strand. Subsequently, the samples were washed in TBS-T and incubated with the amplification solution containing phi29 DNA polymerase (Fermentas, Sigma-Aldrich, St Louis, MO, USA) for rolling circle amplification at 37 °C for 90 min, and washed three times with TBS-T. Finally, the samples were incubated with the detection mix solution containing Texas Red-labeled detection probes that recognize the amplified product (Olink Bioscience, Sigma-Aldrich, St Louis, MO, USA) at 37 °C for 1 h, washed twice in SSC-T buffer (150 mM NaCl, 15 mM sodium citrate, 0.05% Tween-20, pH 7), and were coverslipped with a fluorescence mounting medium (Biocare Medical, Pacheco, CA, USA). Fluorescent signals were detected by laser scanning microscopy (Leica TCS SP8, Wetzlar, Germany), and PLA-positive signals were quantified using MetaMorph software.
Cell cycle analyses
LN229, U87-MG and U251 cells (2 × 10⁵) were seeded in six-well cell culture plates, synchronized by serum deprivation for 48 h, incubated with vehicle, 2 µM of claramine or trodusquemine as previously reported,Citation67,Citation68 or transfected with siRNAs targeting PTP1B, Cdk3, or with the pCMV Cdk3 AF-HA plasmid. The cells were collected at the indicated time points after release of cell cycle arrest. Cells were washed with PBS and fixed in 70% ethanol overnight. Cells were then washed twice with PBS and stained using a Propidium Iodide/RNase Staining kit (BD PharMingen. Franklin Lakes, NJ, USA) in the dark at room temperature for 30 min. Cell cycle analysis was carried out using an Attune NxT flow cytometer (Thermo Fisher Scientific, Waltham, MA, USA) and FlowJo software version 10.6. A total of 10,000 cells were collected for each sample for analysis.
RT-qPCR
Total RNA was extracted from cells treated with vehicle, 2 µM of claramine, trodusquemine, or transfected with the pCMV Cdk3 AF-HA plasmid, using RNeasy Mini kits, quantified by Nanodrop ND-1000, and reverse transcribed using the High Capacity cDNA Reverse Transcription Kit (Applied Biosystems). 1 ng cDNA was amplified by real-time PCR using Universal ProbeLibrary (UPL) probes (Roche). The primer sequences for real-time qPCR were: Cdk1 Fwd: 5′ ggaaaccaggaagcctagcatc 3′, Rev: 5′ ggatgattcagtgccattttgcc 3′; Cyclin A Fwd; 5′ tgtgcacggaaggactttgt 3′, Rev: 5′ tcctcttggagaagatcagccg 3′; Cyclin E1 Fwd: 5′ tgtgtcctggatgttgactgcc 3′, Rev: 5′ ctctatgtcgcaccactgatacc 3′; and GAPDH Fwd: 5′ ccccggtttctataaattgagc 3′, Rev: 5′ caccttccccatggtgtct 3′. UPL probes used were #80 for Cdk1, #69 for cyclin A, #19 for cyclin E1 and #63 for GAPDH. Each sample was run in 20 µL reaction using 2× FastStart Universal Probe Master with ROX (Roche). Reactions were performed in an ABI real-time PCR 7500 (Applied Biosystems, Foster City, CA). Ratios of mRNA levels to control values were calculated using the ΔCt method (2-ΔΔCt) at a threshold of 0.02.Citation69 All data were normalized to control GAPDH. PCR conditions used: hold at 95 °C for 10 min, followed by 40 cycles of 15 s at 95 °C and 60 s at 60 °C.
Statistics
Statistical analysis was conducted using a two-way ANOVA or the unpaired Student’s t test using the Prism software package (GraphPad Software, San Diego, CA, USA). For the SILAC experiments, significance testing was carried out using Student’s t test on log 2 transformed ratios and controlled with a Benjamini-Hochberg FDR threshold. Values of P < 0.05 were considered significant.
Supplemental Material
Download Zip (626.1 KB)ACKNOWLEDGMENTS
We thank Biol. Luis Enrique Florencio-Martinez for technical assistance, Dr Norma Laura Delgado-Buenrostro for assistance in PLA confocal microscopy analysis, and Alison Kurimchak, Lynn Spruce and Steven Seeholzer for their valuable help in mass spectrometry data analysis. Olga Villamar-Cruz is a graduate student of Programa de Doctorado en Ciencias Bioquímicas, UNAM.
DATA AVAILABILITY STATEMENT
The original contributions presented in the study are included in the article. The mass spectrometry proteomics data have been deposited to the ProteomeXchange Consortium via the PRIDECitation59 partner repository with the dataset identifier PXD046000; further inquiries can be directed to the corresponding authors. Data availability statement given based on an openly available basis under open license in a public repository that does not issue DOIs.
DISCLOSURE STATEMENT
No potential conflict of interest was reported by the author(s).
Additional information
Funding
REFERENCES
- Miller KD, Ostrom QT, Kruchko C, Patil N, Tihan T, Cioffi G, Fuchs HE, Waite KA, Jemal A, Siegel RL, et al. Brain and other central nervous system tumor statistics, 2021. CA Cancer J Clin. 2021;71:381–406. doi:10.3322/caac.21693.
- Wen PY, Kesari S. Malignant gliomas in adults. N Engl J Med. 2008;359:492–507. doi:10.1056/NEJMra0708126.
- Holland EC, Celestino J, Dai C, Schaefer L, Sawaya RE, Fuller GN. Combined activation of Ras and Akt in neural progenitors induces glioblastoma formation in mice. Nat Genet. 2000;25:55–57. doi:10.1038/75596.
- Chen J, Zeng Y, Wu R, Xuan Y, Jiang M, Teng H. Decreased DUSP26 expression promotes malignant behavior in glioblastoma cells via deregulation of MAPK and Akt signaling pathway. Front Oncol. 2021;11:676647. doi:10.3389/fonc.2021.676647.
- Ou A, Ott M, Fang D, Heimberger AB. The role and therapeutic targeting of JAK/STAT signaling in glioblastoma. Cancers. 2021;13:437. doi:10.3390/cancers13030437.
- Nešović M, Divac Rankov A, Podolski-Renić A, Nikolić I, Tasić G, Mancini A, Schenone S, Pešić M, Dinić J. Src inhibitors pyrazolo[3,4-d]pyrimidines, Si306 and Pro-Si306, inhibit focal adhesion kinase and suppress human glioblastoma invasion in vitro and in vivo. Cancers. 2020;12:1570. doi:10.3390/cancers12061570.
- Ito Y, Fukui M, Kanda M, Morishita K, Shoji Y, Kitao T, Hinoi E, Shirahase H. Therapeutic effects of the allosteric protein tyrosine phosphatase 1B inhibitor KY-226 on experimental diabetes and obesity via enhancements in insulin and leptin signaling in mice. J Pharmacol Sci. 2018;137:38–46. doi:10.1016/j.jphs.2018.03.001.
- Sharma B, Xie L, Yang F, Wang W, Zhou Q, Xiang M, Zhou S, Lv W, Jia Y, Pokhrel L, et al. Recent advance on PTP1B inhibitors and their biomedical applications. Eur J Med Chem. 2020;199:112376. doi:10.1016/j.ejmech.2020.112376.
- Prabhakar PK, Sivakumar PM. Protein tyrosine phosphatase 1B inhibitors: a novel therapeutic strategy for the management of type 2 diabetes mellitus. Curr Pharm Des. 2019;25:2526–2539. doi:10.2174/1381612825666190716102901.
- Lessard L, Stuible M, Tremblay ML. The two faces of PTP1B in cancer. Biochim Biophys Acta. 2010;1804:613–619. doi:10.1016/j.bbapap.2009.09.018.
- Bjorge JD, Pang A, Fujita DJ. Identification of protein-tyrosine phosphatase 1B as the major tyrosine phosphatase activity capable of dephosphorylating and activating c-Src in several human breast cancer cell lines. J Biol Chem. 2000;275:41439–41446. doi:10.1074/jbc.M004852200.
- Dadke S, Chernoff J. Protein-tyrosine phosphatase 1B mediates the effects of insulin on the actin cytoskeleton in immortalized fibroblasts. J Biol Chem. 2003;278:40607–40611. doi:10.1074/jbc.M306772200.
- Arias-Romero LE, Saha S, Villamar-Cruz O, Yip S-C, Ethier SP, Zhang Z-Y, Chernoff J. Activation of Src by protein tyrosine phosphatase 1B is required for ErbB2 transformation of human breast epithelial cells. Cancer Res. 2009;69:4582–4588. doi:10.1158/0008-5472.CAN-08-4001.
- Yamanashi Y, Baltimore D. Identification of the Abl- and rasGAP-associated 62 kDa protein as a docking protein, Dok. Cell. 1997;88:205–211. doi:10.1016/s0092-8674(00)81841-3.
- Kashige N, Carpino N, Kobayashi R. Tyrosine phosphorylation of p62dok by p210bcr-abl inhibits RasGAP activity. Proc Natl Acad Sci USA. 2000;97:2093–2098. doi:10.1073/pnas.040547997.
- Julien SG, Dubé N, Read M, Penney J, Paquet M, Han Y, Kennedy BP, Muller WJ, Tremblay ML. Protein tyrosine phosphatase 1B deficiency or inhibition delays ErbB2-induced mammary tumorigenesis and protects from lung metastasis. Nat Genet. 2007;39:338–346. doi:10.1038/ng1963.
- Bentires-Alj M, Neel BG. Protein-tyrosine phosphatase 1B is required for HER2/Neu-induced breast cancer. Cancer Res. 2007;67:2420–2424. doi:10.1158/0008-5472.CAN-06-4610.
- Ren S, Rollins BJ. Cyclin C/cdk3 promotes Rb-dependent G0 exit. Cell. 2004;117:239–251. doi:10.1016/s0092-8674(04)00300-9.
- Lu J, Zhang ZL, Huang D, Tang N, Li Y, Peng Z, Lu C, Dong Z, Tang F. Cdk3-promoted epithelial-mesenchymal transition through activating AP-1 is involved in colorectal cancer metastasis. Oncotarget. 2016;7:7012–7028. doi:10.18632/oncotarget.6875.
- Karlsson-Rosenthal C, Millar JBA. Cdc25: mechanisms of checkpoint inhibition and recovery. Trends Cell Biol. 2006;16:285–292. doi:10.1016/j.tcb.2006.04.002.
- Boutros R, Dozier C, Ducommun B. The when and wheres of CDC25 phosphatases. Curr Opin Cell Biol. 2006;18:185–191. doi:10.1016/j.ceb.2006.02.003.
- Qin Z, Pandey NR, Zhou X, Stewart CA, Hari A, Huang H, Stewart AFR, Brunel JM, Chen H-H. Functional properties of Claramine: a novel PTP1B inhibitor and insulin-mimetic compound. Biochem Biophys Res Commun. 2015;458:21–27. doi:10.1016/j.bbrc.2015.01.040.
- Ferrari E, Tinti M, Costa S, Corallino S, Nardozza AP, Chatraryamontri A, Ceol A, Cesareni G, Castagnoli L. Identification of new substrates of the protein-tyrosine phosphatase PTP1B by Bayesian integration of proteome evidence. J Biol Chem. 2011;286:4173–4185. doi:10.1074/jbc.M110.157420.
- Ren L, Chen X, Luechapanichkul R, Selner NG, Meyer TM, Wavreille A-S, Chan R, Iorio C, Zhou X, Neel BG, et al. Substrate specificity of protein tyrosine phosphatases 1B, RPTPα, SHP-1, and SHP-2. Biochemistry. 2011;50:2339–2356. doi:10.1021/bi1014453.
- Schwarz JJ, Grundmann L, Kokot T, Kläsener K, Fotteler S, Medgyesi D, Köhn M, Reth M, Warscheid B. Quantitative proteomics identifies PTP1B as modulator of B cell antigen receptor signaling [Internet]. Biochemistry. 2021 10.1101/2021.03.30.437652.
- Haj FG, Markova B, Klaman LD, Bohmer FD, Neel BG. Regulation of receptor tyrosine kinase signaling by protein tyrosine phosphatase-1B. J Biol Chem. 2003;278:739–744. doi:10.1074/jbc.M210194200.
- Zhang X, Zhang B, Zhang P, Lian L, Li L, Qiu Z, Qian K, Chen A, Liu Q, Jiang Y, et al. Norcantharidin regulates ERα signaling and tamoxifen resistance via targeting miR-873/CDK3 in breast cancer cells. PLoS One. 2019;14:e0217181. doi:10.1371/journal.pone.0217181.
- Liu Z, Yang S, Li W, Dong S, Zhou S, Xu S. circRNA_141539 can serve as an oncogenic factor in esophageal squamous cell carcinoma by sponging miR-4469 and activating CDK3 gene. Aging. 2021;13:12179–12193. doi:10.18632/aging.103071.
- Singh S, Singh H, Tuknait A, Chaudhary K, Singh B, Kumaran S, Raghava GPS. PEPstrMOD: structure prediction of peptides containing natural, non-natural and modified residues. Biol Direct. 2015;10:73. doi:10.1186/s13062-015-0103-4.
- Alekseenko A, Ignatov M, Jones G, Sabitova M, Kozakov D. Protein-protein and protein-peptide docking with ClusPro server. Methods Mol Biol. 2020;2165:157–174.
- Kozakov D, Hall DR, Xia B, Porter KA, Padhorny D, Yueh C, Beglov D, Vajda S. The ClusPro web server for protein-protein docking. Nat Protoc. 2017;12:255–278. doi:10.1038/nprot.2016.169.
- Wiesmann C, Barr KJ, Kung J, Zhu J, Erlanson DA, Shen W, Fahr BJ, Zhong M, Taylor L, Randal M, et al. Allosteric inhibition of protein tyrosine phosphatase 1B. Nat Struct Mol Biol. 2004;11:730–737. doi:10.1038/nsmb803.
- Brown NR, Noble MEM, Lawrie AM, Morris MC, Tunnah P, Divita G, Johnson LN, Endicott JA. Effects of phosphorylation of threonine 160 on cyclin-dependent kinase 2 structure and activity. J Biol Chem. 1999;274:8746–8756. doi:10.1074/jbc.274.13.8746.
- Ye X, Zhu C, Harper JW. A premature-termination mutation in the Mus musculus cyclin-dependent kinase 3 gene. Proc Natl Acad Sci USA. 2001;98:1682–1686. doi:10.1073/pnas.98.4.1682.
- Hagting A, Karlsson C, Clute P, Jackman M, Pines J. MPF localization is controlled by nuclear export. EMBO J. 1998;17:4127–4138. doi:10.1093/emboj/17.14.4127.
- Yip S-C, Saha S, Chernoff J. PTP1B: a double agent in metabolism and oncogenesis. Trends Biochem Sci. 2010;35:442–449. doi:10.1016/j.tibs.2010.03.004.
- Villamar-Cruz O, Loza-Mejía MA, Arias-Romero LE, Camacho-Arroyo I. Recent advances in PTP1B signaling in metabolism and cancer. Biosci Rep. 2021;41:BSR20211994. doi:10.1042/BSR20211994.
- Wiener JR, Kerns BJ, Harvey EL, Conaway MR, Iglehart JD, Berchuck A, Bast RC. Overexpression of the protein tyrosine phosphatase PTP1B in human breast cancer: association with p185c-erbB-2 protein expression. J Natl Cancer Inst. 1994;86:372–378. doi:10.1093/jnci/86.5.372.
- Zhu S, Bjorge JD, Fujita DJ. PTP1B contributes to the oncogenic properties of colon cancer cells through Src activation. Cancer Res. 2007;67:10129–10137. doi:10.1158/0008-5472.CAN-06-4338.
- Lessard L, Labbé DP, Deblois G, Bégin LR, Hardy S, Mes-Masson A-M, Saad F, Trotman LC, Giguère V, Tremblay ML. PTP1B is an androgen receptor-regulated phosphatase that promotes the progression of prostate cancer. Cancer Res. 2012;72:1529–1537. doi:10.1158/0008-5472.CAN-11-2602.
- Wang J, Liu B, Chen X, Su L, Wu P, Wu J, Zhu Z. PTP1B expression contributes to gastric cancer progression. Med Oncol. 2012;29:948–956. doi:10.1007/s12032-011-9911-2.
- Jin T, Li D, Yang T, Liu F, Kong J, Zhou Y. PTPN1 promotes the progression of glioma by activating the MAPK/ERK and PI3K/AKT pathways and is associated with poor patient survival. Oncol Rep. 2019;42:717–725. doi:10.3892/or.2019.7180.
- Liu H, Wu Y, Zhu S, Liang W, Wang Z, Wang Y, Lv T, Yao Y, Yuan D, Song Y. PTP1B promotes cell proliferation and metastasis through activating src and ERK1/2 in non-small cell lung cancer. Cancer Lett. 2015;359:218–225. doi:10.1016/j.canlet.2015.01.020.
- Wang N, She J, Liu W, Shi J, Yang Q, Shi B, Hou P. Frequent amplification of PTP1B is associated with poor survival of gastric cancer patients. Cell Cycle. 2015;14:732–743. doi:10.1080/15384101.2014.998047.
- Flint AJ, Gebbink MF, Franza BR, Hill DE, Tonks NK. Multi-site phosphorylation of the protein tyrosine phosphatase, PTP1B: identification of cell cycle regulated and phorbol ester stimulated sites of phosphorylation. EMBO J. 1993;12:1937–1946. doi:10.1002/j.1460-2075.1993.tb05843.x.
- Xu Q, Wu N, Li X, Guo C, Li C, Jiang B, Wang H, Shi D. Inhibition of PTP1B blocks pancreatic cancer progression by targeting the PKM2/AMPK/mTOC1 pathway. Cell Death Dis. 2019;10:874. doi:10.1038/s41419-019-2073-4.
- Carmona S, Brunel J-M, Bonier R, Sbarra V, Robert S, Borentain P, Lombardo D, Mas E, Gerolami R. A squalamine derivative, NV669, as a novel PTP1B inhibitor: in vitro and in vivo effects on pancreatic and hepatic tumor growth. Oncotarget. 2019;10:6651–6667. doi:10.18632/oncotarget.27286.
- Xie J, Qian Y-Y, Yang Y, Peng L-J, Mao J-Y, Yang M-R, Tian Y, Sheng J. Isothiocyanate from Moringa oleifera seeds inhibits the growth and migration of renal cancer cells by regulating the PTP1B-dependent Src/Ras/Raf/ERK signaling pathway. Front Cell Dev Biol. 2021;9:790618. doi:10.3389/fcell.2021.790618.
- Braun K, Hölzl G, Soucek T, Geisen C, Möröy T, Hengstschläger M. Investigation of the cell cycle regulation of cdk3-associated kinase activity and the role of cdk3 in proliferation and transformation. Oncogene. 1998;17:2259–2269. doi:10.1038/sj.onc.1202145.
- Cho Y-Y, Tang F, Yao K, Lu C, Zhu F, Zheng D, Pugliese A, Bode AM, Dong Z. Cyclin-dependent kinase-3-mediated c-Jun phosphorylation at Ser63 and Ser73 enhances cell transformation. Cancer Res. 2009;69:272–281. doi:10.1158/0008-5472.CAN-08-3125.
- Zheng D, Cho Y-Y, Lau ATY, Zhang J, Ma W-Y, Bode AM, Dong Z. Cyclin-dependent kinase 3-mediated activating transcription factor 1 phosphorylation enhances cell transformation. Cancer Res. 2008;68:7650–7660. doi:10.1158/0008-5472.CAN-08-1137.
- Xiao T, Zhu JJ, Huang S, Peng C, He S, Du J, Hong R, Chen X, Bode AM, Jiang W, et al. Phosphorylation of NFAT3 by CDK3 induces cell transformation and promotes tumor growth in skin cancer. Oncogene. 2017;36:2835–2845. doi:10.1038/onc.2016.434.
- O’Donovan DS, MacFhearraigh S, Whitfield J, Swigart LB, Evan GI, Mc Gee MM. Sequential Cdk1 and Plk1 phosphorylation of protein tyrosine phosphatase 1B promotes mitotic cell death. Cell Death Dis. 2013;4:e468. doi:10.1038/cddis.2012.208.
- Dubé N, Cheng A, Tremblay ML. The role of protein tyrosine phosphatase 1B in Ras signaling. Proc Natl Acad Sci USA. 2004;101:1834–1839. doi:10.1073/pnas.0304242101.
- van den Heuvel S, Harlow E. Distinct roles for cyclin-dependent kinases in cell cycle control. Science. 1993;262:2050–2054. doi:10.1126/science.8266103.
- Olsen JV, Blagoev B, Gnad F, Macek B, Kumar C, Mortensen P, Mann M. Global, in vivo, and site-specific phosphorylation dynamics in signaling networks. Cell. 2006;127:635–648. doi:10.1016/j.cell.2006.09.026.
- Larsen MR, Thingholm TE, Jensen ON, Roepstorff P, Jørgensen TJD. Highly selective enrichment of phosphorylated peptides from peptide mixtures using titanium dioxide microcolumns. Mol Cell Proteomics. 2005;4:873–886. doi:10.1074/mcp.T500007-MCP200.
- Rappsilber J, Ishihama Y, Mann M. Stop and go extraction tips for matrix-assisted laser desorption/ionization, nanoelectrospray, and LC/MS sample pretreatment in proteomics. Anal Chem. 2003;75:663–670. doi:10.1021/ac026117i.
- Perez-Riverol Y, Bai J, Bandla C, García-Seisdedos D, Hewapathirana S, Kamatchinathan S, Kundu DJ, Prakash A, Frericks-Zipper A, Eisenacher M, et al. The PRIDE database resources in 2022: a hub for mass spectrometry-based proteomics evidences. Nucleic Acids Res. 2022;50:D543–D552. doi:10.1093/nar/gkab1038.
- Desta IT, Porter KA, Xia B, Kozakov D, Vajda S. Performance and its limits in rigid body protein-protein docking. Structure. 2020;28:1071–1081.e3. doi:10.1016/j.str.2020.06.006.
- Kozakov D, Beglov D, Bohnuud T, Mottarella SE, Xia B, Hall DR, Vajda S. How good is automated protein docking? Proteins Struct Funct Bioinforma. 2013;81:2159–2166. doi:10.1002/prot.24403.
- Vajda S, Yueh C, Beglov D, Bohnuud T, Mottarella SE, Xia B, Hall DR, Kozakov D. New additions to the ClusPro server motivated by CAPRI. Proteins Struct Funct Bioinforma. 2017;85:435–444. doi:10.1002/prot.25219.
- Krieger E, Vriend G. YASARA View—molecular graphics for all devices—from smartphones to workstations. Bioinformatics. 2014;30:2981–2982. doi:10.1093/bioinformatics/btu426.
- Krieger E, Vriend G. New ways to boost molecular dynamics simulations. J Comput Chem. 2015;36:996–1007. doi:10.1002/jcc.23899.
- Vivar-Sierra A, Araiza-Macías MJ, Hernández-Contreras JP, Vergara-Castañeda A, Ramírez-Vélez G, Pinto-Almazán R, Salazar JR, Loza-Mejía MA. In silico study of polyunsaturated fatty acids as potential SARS-CoV-2 spike protein closed conformation stabilizers: epidemiological and computational approaches. Molecules. 2021;26:711. doi:10.3390/molecules26030711.
- Jumper J, Evans R, Pritzel A, Green T, Figurnov M, Ronneberger O, Tunyasuvunakool K, Bates R, Žídek A, Potapenko A, et al. Highly accurate protein structure prediction with AlphaFold. Nature. 2021;596:583–589. doi:10.1038/s41586-021-03819-2.
- Bartolomé RA, Martín-Regalado Á, Jaén M, Zannikou M, Zhang P, de los Ríos V, Balyasnikova IV, Casal JI. Protein tyrosine phosphatase-1B inhibition disrupts IL13Rα2-promoted invasion and metastasis in cancer cells. Cancers. 2020;12:500. doi:10.3390/cancers12020500.
- Lantz KA, Hart SGE, Planey SL, Roitman MF, Ruiz-White IA, Wolfe HR, McLane MP. 2010 Inhibition of PTP1B by trodusquemine (MSI-1436) causes fat-specific weight loss in diet-induced obese mice. Obesity. 18(8):1516–1523.
- Livak KJ, Schmittgen TD. Analysis of relative gene expression data using real-time quantitative PCR and the 2(-Delta Delta C(T)) Method. Methods. 2001;25:402–408. doi:10.1006/meth.2001.1262.