
Abstract
Here, we report a novel role for the yeast lysine acetyltransferase NuA4 in regulating phospholipid availability for organelle morphology. Disruption of the NuA4 complex results in 70% of cells displaying nuclear deformations and nearly 50% of cells exhibiting vacuolar fragmentation. Cells deficient in NuA4 also show severe defects in the formation of nuclear-vacuole junctions (NJV), as well as a decrease in piecemeal microautophagy of the nucleus (PMN). To determine the cause of these defects we focused on Pah1, an enzyme that converts phosphatidic acid into diacylglycerol, favoring accumulation of lipid droplets over phospholipids that are used for membrane expansion. NuA4 subunit Eaf1 was required for Pah1 localization to the inner nuclear membrane and artificially tethering of Pah1 to the nuclear membrane rescued nuclear deformation and vacuole fragmentation defects, but not defects related to the formation of NVJs. Mutation of a NuA4-dependent acetylation site on Pah1 also resulted in aberrant Pah1 localization and defects in nuclear morphology and NVJ. Our work suggests a critical role for NuA4 in organelle morphology that is partially mediated through the regulation of Pah1 subcellular localization.
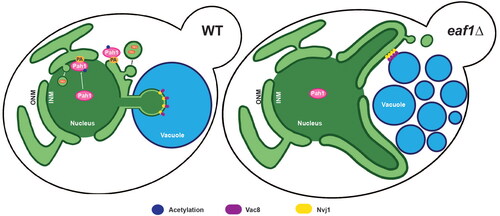
Graphical Abstract
Introduction
One of the most common types of post translational modification (PTM) is acetylation, the reversible addition of acetyl groups onto lysine residues. Our work focuses on the Saccharomyces cerevisiae lysine acetyltransferase complex NuA4—the yeast homolog of the mammalian Tip60 complex. NuA4 is comprised of 13 subunits, including the catalytic component, Esa1, and the scaffolding unit, Eaf1.Citation1–5 Esa1 is homologous to human Tip60 and 12 of the additional subunits in the yeast NuA4 complex have mammalian homologs found in the Tip60 complex, demonstrating conservation between species.Citation6 Since ESA1 is an essential gene, the temperature sensitive mutant esa1ts, which inactivates the encoded subunit at high temperatures, is commonly used to investigate the role of NuA4.Citation1,Citation7,Citation8 Alternatively, deletion of the nonessential EAF1 results in dissociation of the NuA4 complex and reduction of Esa1 targeting. Therefore, eaf1Δ strains are useful models for investigating the consequences of NuA4 dysfunction.Citation2,Citation3,Citation9–12
NuA4 action has been linked to several pathways related to lipid regulation,Citation9,Citation11–13 growth control,Citation14 and the stress responseCitation15 in yeast. Previous work in mice has identified an essential role for Tip60 in regulating triacylglycerol (TAG) accumulation and lipid droplet size.Citation16 This role is believed to be mediated by Tip60 acetylation of phospholipid phosphohydrolase, lipin 1, which results in translocation of lipin 1 to the endoplasmic reticulum (ER). In yeast, mutants of NuA4 also display decreased TAG accumulation and lipid droplets.Citation9,Citation16 The yeast homolog of lipin 1, Pah1, is also an important enzyme in the lipid synthesis pathway, as it converts the key metabolite phosphatidic acid (PA) into diacylglycerol (DAG), which is subsequently modified by the DAG acetyltransferase to form TAG. TAG is then packaged and stored in lipid droplets. Alternatively, PA can be processed into CDP-DAG, which is a precursor to many membrane phospholipids (Summarized in ).Citation17–20 Two NuA4-dependent acetylation sites have been identified on Pah1, and lysine to arginine mutations at these two sites, in tandem, resulted in a reduction in lipid droplet formation.Citation16 However, the individual contributions of each site, the functional consequence of this regulatory circuit for Pah1 localization, and the downstream consequences for organelle homeostasis is not clear.
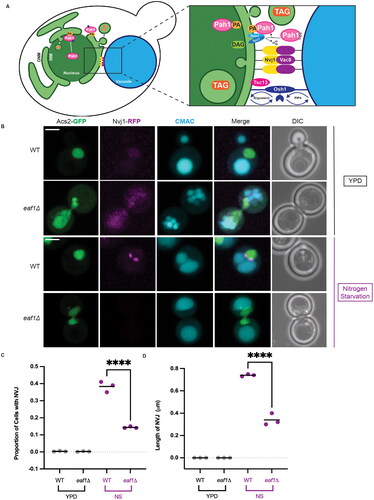
Figure 1. Deletion of EAF1 results in nuclear deformation and vacuole fragmentation. (A) Simplified diagram of yeast lipid synthesis showing the diversion of phosphatidic acid (PA) into two main pathways; one producing lipid droplets, and the other producing membrane phospholipids (PS, phosphatidylserine. PE, phosphatidylethanolamine. PC, phosphatidylcholine. PI, phosphatidylinositol). DAG, diacylglycerol. TAG, triacylglycerol. CDP-DAG, cytidine diphosphate diacylglycerol. G-6-P, glucose-6-phosphate. (B) Representative images showing nuclear deformation and vacuole fragmentation in WT and eaf1Δ cells expressing ACS2-GFP, NUP49-RFP (YKB 4972 and YKB 4863) and stained with CMAC. 3D reconstruction of cells was done using Imaris software. Scale bar = 5 μm. Images presented are representative of three biological replicates. (C) Proportion of total cells with deformed nuclei was quantified through visual analysis of cells. This was repeated for three biological replicates, counting at least 100 cells for each. (D) Proportion of total cells with fragmented vacuoles (i.e. having five or more vacuolar lobes), was quantified by visually counting the number of vacuoles per cell. Gray dots represent three biological replicates of at least 100 cells for each. Horizontal bars represent the mean. For C and D, an ANOVA analysis was performed using Tukey’s multiple comparison test. *P ≤ 0.05, ***P ≤ 0.001, ****P < 0.0001. Relevant statistical significance bars are shown, additional comparisons can be found in Supplemental Table 1.
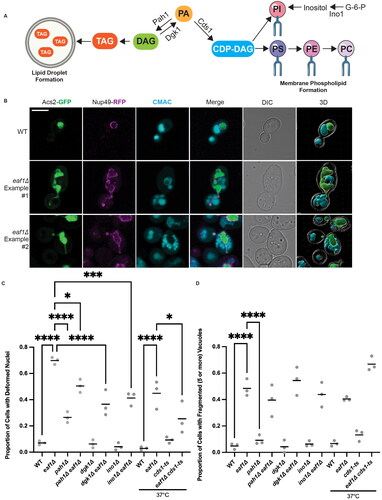
Regulation of PA, and in particular the function of Pah1, is important to establish a balance between the production of lipid droplets and membrane phospholipids. For example, in pah1Δ cells there is an increase in total phospholipids resulting in extensions of the nuclear membrane (known as nuclear flares),Citation21,Citation22 and a corresponding decrease in TAG accumulation.Citation23,Citation24 This gross dysregulation of underlying lipids causes additional defects in vacuole fusion,Citation25 autophagy,Citation26 and cell wall integrity.Citation27 Importantly, these phenotypes are rescued upon deletion of DGK1, which encodes an enzyme functioning in opposition to Pah1, converting DAG into PA.Citation23,Citation28 Collectively, the available data highlights the importance of PA and DAG levels in modulating the balance between phospholipid production and the formation of lipid droplets.
In this study, we report that NuA4 mutants display abnormal organelle phenotypes, such as nuclear deformation and vacuolar fragmentation. In addition, we identified defects in nuclear-vacuole junction (NVJ) formation and piecemeal microautophagy of the nucleus (PMN), which provides a secondary mechanism for nuclear deformation in NuA4 mutants. By targeting Pah1 to the nuclear membrane, we were able to rescue nuclear deformation and vacuole fragmentation defects in eaf1Δ cells, but not NVJ and PMN defects. Finally, we provide evidence that these phenotypes are caused in part by misregulation of Pah1 subcellular localization mediated by acetylation at K496.
Results
NuA4 mutants exhibit nuclear deformation and vacuole fragmentation
We were motivated to determine if NuA4 mutants display nuclear deformations, as a previous high-content microscopy screen determined that eaf1Δ cells expressing a GFP-tagged nucleoplasmic protein, Acs2-GFP, had abnormal nuclear morphology.Citation12 Nuclear deformations, or an expansion of the nuclear membrane,Citation29 can be observed using a nucleoplasmic fluorescence marker, such as Acs2-GFP, that is not bound to chromatin. We continued to use Acs2-GFP, in combination with nuclear membrane marker Nup49-RFP, to assess nuclear morphology in wild-type (WT), pah1Δ, and NuA4 mutant cells. We also monitored vacuole morphology using CellTracker Blue CMAC (7-amino-4-chloromethylcoumarin), which stains the vacuole lumen. As expected, nuclear deformations were detected in 7.1% of WT cells (, Supplemental Video 1) and 26.5% of pah1Δ cells ().Citation22,Citation23 In NuA4 mutants, nuclear deformations were detected in 69.8% of eaf1Δ cells (, Supplemental Video 2 and 3) and in 32.4% of esa1-L254P mutants, which are temperature sensitive (Supplemental Figure 1A and B).Citation7 These nuclear deformations were seen in all stages of the cell cycle, and exhibited a vastly different profile than those seen in mitotic arrest induced by nocodozole treatment (Supplemental Figure 2). We were surprised that eaf1Δ cells had rates of nuclear deformations substantially higher than pah1Δ cells, which suggests that NuA4 may impact nuclear morphology through both Pah1-dependent and Pah1-independent pathways. Even more surprising was the observation that deletion of PAH1 partially rescued nuclear deformation phenotypes of eaf1Δ cells (). This observation suggests that in NuA4 mutants, Pah1 in part promotes nuclear deformations, even though it normally functions to prevent them.
Given their important role in the production of phospholipids (outlined in ), we asked if deleting DGK1 and INO1, or introduction of a temperature sensitive mutation of the essential gene CDS1, cds1-tsCitation30, could rescue nuclear deformation of eaf1Δ cells in a manner similar to how these mutations rescue phenotypes associated with deletion of PAH1.Citation23,Citation24,Citation31 While the single mutants maintained WT levels of nuclear deformations, double deletions with eaf1Δ partially rescued the increase in nuclear deformations seen in eaf1Δ single mutant cells (). This result suggests that increased nuclear deformations in eaf1Δ cells are caused in part by a flux into membrane phospholipid synthesis.
Next, we examined the consequences of lipid dysregulation at the level of vacuolar morphology. Cells were considered to have fragmented vacuoles if they contained five or more vacuolar lobes, with CMAC being used to stain the vacuolar lumen. With this classification, 48.5% of eaf1Δ cells () and 32.4% of esa1-L254Pts cells shifted to a nonpermissive temperature (Supplemental Figure 1A and C) had fragmented vacuoles, compared to only 4.8% of WT cells (). This defect was significantly greater than the 9.1% observed in a pah1Δ strain. Unlike nuclear deformations, the phospholipid membrane enzyme mutants tested (pah1Δ, dgk1Δ, ino1Δ and cds1-ts) were unable to rescue vacuole fragmentation in eaf1Δ cells (). Interestingly, a previous study showed that the deletion of DGK1 was also unable to rescue the vacuolar defects seen in pah1Δ.Citation28 Together our work indicates that eaf1Δ and esa1-L254Pts cells have nuclear deformations stemming from dysregulation of phospholipid synthesis, while vacuole fragmentation defects are most likely caused by a disruption of an alternative pathway.
Loss of Pah1 at the inner nuclear membrane in eaf1Δ cells
We next sought to understand how NuA4, which is largely nuclear,Citation32 could be impacting Pah1 activity and nuclear morphology. Active Pah1 is localized to both the inner and outer nuclear membrane (INM and ONM) where it converts PA into DAG.Citation33 DAG is subsequently further metabolized into TAG and packaged into lipid droplets.Citation17,Citation34 To investigate Pah1 localization inside the nucleus, we sought to determine if disruption of NuA4 impacted the subcellular localization of Pah1 to the INM using a BiFluorescent Complementation (BiFC) assay. This same assay had previously been used to detect Pah1 localization to the INM.Citation33 Pah1 was expressed from a plasmid as a fusion with half of the Venus fluorescent protein (indicated as VC), while the INM protein Nup60 or nucleoplasmic protein Pus1 was expressed from a second plasmid as a fusion with the other half of Venus (indicated as VN) (). If the two proteins interact, the full Venus protein is brought together and can be visualized via fluorescence microscopy. In both WT and eaf1Δ cells expressing Pah1-VC and Pus1-VN constructs, a Venus signal was detected, indicating a pool of Pah1-VC within the nucleoplasm (). In WT cells expressing Pah1-VC and Nup60-VN, a signal was detected on the INM. In eaf1Δ cells, however, the interaction between Pah1-VC and Nup60-VN at the INM is lost, despite appropriate expression of Pah1-VC (Supplemental Figure 3). Further, deletion of EAF1 did not abolish Nup2-VC or Mlp1-VC interaction with Nup60-VN at the INM, suggesting that disruption of NuA4 is not causing gross mislocalization of INM proteins (Supplemental Figure 4). Together, our BiFC work indicates that Eaf1 is required for INM localization of Pah1-VC.
Figure 2. Loss of Pah1 at the INM upon deletion of EAF1, with no change in nuclear phosphatidic acid (PA) and INM diacylglycerol (DAG). (A) Schematic diagram for a bifluorescent complementation assay (BiFC) shows the interaction between two protein fragments, each encoding half of the Venus fluorescent protein. Upon interaction, they form the whole Venus that can be visualized using a fluorescence microscope. (B) Pah1 INM localization is dependent on EAF1. BiFC experiment with WT or eaf1Δ cells expressing Pah1-VC and Nup60-VN (YKB 4977 and YKB 4978) or Pus1-VN (YKB 4975 and YKB 4976) was assessed. Scale bar = 5 μm. (C) Live imaging of WT and eaf1Δ cells expressing genomically integrated ASC2-GFP and the plasmid-based NLS-Q2-mCherry biosensor (YKB 5182 and YKB 5183) (top panel) or NLS-DAG-mCherry biosensor (YKB 5184 and YKB 5185) (bottom panel) and stained with CMAC to mark the vacuoles. Scale bar = 5 μm. Images presented are representative of three biological replicates. Line graphs for (B) and (C) were generated by measuring the fluorescence intensity value of pixels across the nucleus of the cell, using Plot Profile in ImageJ software. Red/black lines indicate the average for the indicated number of cells, and the grey lines show each cell profile. n = the number of randomly selected cells. FU = fluorescence units. *Indicates that that y-axis has been cropped to facilitate comparison of strains.
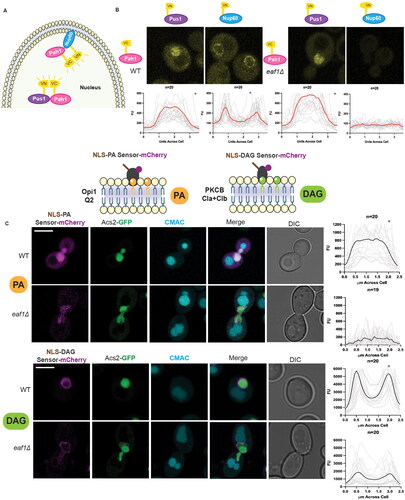
If Pah1 localization to the INM is decreased in eaf1Δ cells, we predicted we may also see changes in PA and DAG at this location. To test this hypothesis, we next assessed the levels of INM PA and DAG using the previously validated plasmid-encoded biosensors NLS-Opi1-Q2-mCherry (NLS-PA), and 2XNLS-Cla + Clb mCherry (NLS-DAG).Citation35 Despite the fact that the expression of both biosensors was reduced in eaf1Δ cells (Supplemental Figure 5), we were able to make important conclusions about INM PA and DAG pools.Citation35 In both WT and eaf1Δ cells, the NLS-PA biosensor displayed diffuse nucleoplasmic signal (). This is consistent with previous results from Romanauska et al.Citation33 showing that under WT conditions PA is present at lower levels at the INM in comparison to the PA-rich plasma membrane. Only with specific dysregulation of the lipid metabolism pathways, such as that seen in a cds1-ts mutant or oleic acid treatment, were they able to detect NLS-PA biosensor enrichment at the INM.Citation33 PA that accumulates may be quickly shuttled into phospholipid synthesis. In contrast, the NLS-DAG biosensor detected DAG at the INM in both WT and eaf1Δ cells (). Further, we did not observe nucleoplasmic accumulation of the DAG biosensor, which would be expected in cases of decreased DAG at the INM.Citation33 This suggests that some Pah1 remains active despite its reduction at the INM of eaf1Δ cells as measured by BiFC. Alternatively, eaf1Δ cells could be compensating for decreased Pah1 activity by altering other lipid metabolism pathways.
Artificially targeting Pah1 to the nuclear membrane rescues eaf1Δ nuclear deformations and vacuole fragmentation
If nuclear deformations or vacuole fragmentation defects displayed in eaf1Δ cells are due to decreased localization of Pah1 to the nuclear membrane, we predicted that artificially targeting Pah1 to the nuclear membranes may rescue these defects. To explore this possibility, we took advantage of the fact that Pah1 localization is primarily modulated through phosphorylation via protein kinases such as Pho85-Pho80, Cdc28-cyclin B and PKA.Citation22,Citation36,Citation37 However, Pah1 is only dephosphorylated by one phosphatase complex known as Nem1-Spo7. As illustrated in , top panel, Nem1-Spo7 dephosphorylation of Pah1 is required for Pah1 association with PA on the nuclear membrane where it converts it to DAG.Citation18,Citation38–40 Under normal conditions, Pah1 remains inactive in the cytoplasm and is only active when dephosphorylated and bound to the nuclear membrane.Citation41
Figure 3. Targeting Pah1 to the nuclear membrane with Pah1-7A-GFP rescues nuclear deformation and vacuole fusion defects. (A) Graphic depicting the interaction of Pah1-7A and Pah1-7A-AH3A with the nucleus/nuclear ER (NER). (B) Merged Z-stack images showing WT and eaf1Δ Pah1-7A-GFP (YKB 5198 and YKB 5199) as well as WT and eaf1Δ Pah1-7A-AH3A-GFP (YKB 5200 and YKB 5201), with Nab2-NLS mCherry to visualize the nucleus, and the vacuole stained with CMAC. Scale bar = 5 μm. Images presented are representative of three biological replicates. (C) Proportion of cells with deformed nuclei. Cells were quantified by observing a nuclear extension versus a round nuclei. (D) Proportion of cells with fragmented (five or more) vacuoles. Cells were quantified by visually counting the number of vacuoles per cell. For C and D, an ANOVA analysis was performed using Tukey’s multiple comparison test. Cells were counted by investigating the full Z-stack of cells. Grey dots represent three biological replicates of at least 100 cells for each. Horizontal bars represent the mean. *P ≤ 0.05, **P ≤ 0.01, ***P ≤ 0.001, ****P < 0.0001, ns = not significant, P > 0.05.
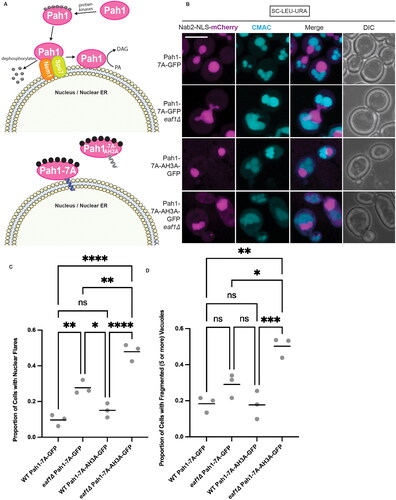
We used a previously established approach that exploits this regulatory system to modulate the subcellular localization of Pah1.Citation39 Pah1-7A-GFP, wherein 7 phosphorylated serine residues are replaced with alanine, artificially binds to the nuclear membrane.Citation39 Conversely, Pah1-7A-AH3A-GFP contains an additional mutation in the alpha helix of Pah1, rendering it unable to bind at this location ( bottom panel).Citation39 Therefore, these constructs allow for examination of two distinct scenarios where Pah1 is either active and bound to the nuclear membrane (Pah1-7A-GFP), or a control scenario where this tethering does not occur (Pah1-7A-AH3A-GFP). WT and eaf1Δ cells expressing the Nab2-NLS-mCherry construct (nucleoplasm marker) were transformed with plasmids expressing either Pah1-7A-GFP or Pah1-7A-AH3A-GFP and stained with CMAC to mark the vacuoles. Consistent with previous literature, both Pah1-7A-GFP and Pah1-7A-AH3A-GFP showed a low level of disperse cytosolic signal in both WT and eaf1Δ cells (Supplemental Figure 6A).Citation17,Citation39 Wild-type PAH1 is still present in these cells and all Pah1-GFP fusions were expressed in WT and eaf1Δ cells (Supplemental Figure 6B). WT cells expressing Pah1-7A-GFP or Pah1-7A-AH3A-GFP had low levels of nuclear deformations () and fragmented vacuoles (). In eaf1Δ cells, tethering of Pah1 to the nuclear membrane with Pah1-7A-GFP resulted in a greatly reduced nuclear deformations and fragmented vacuoles compared to eaf1Δ cells expressing the Pah1-7A-AH3A-GFP control (). These results suggest that the changes in subcellular localization of Pah1 observed in eaf1Δ mutants have important consequences for membrane homeostasis.
Defect in the formation of the nuclear-vacuole junction (NVJ) and piecemeal microautophagy of the nucleus (PMN) in an eaf1Δ
If unregulated nuclear membrane growth was the only reason for nuclear deformations in eaf1Δ cells, we would anticipate pah1Δ and eaf1Δ cells to have similar levels of these structures. In contrast, eaf1Δ cells had higher levels of deformations than pah1Δ cells. Moreover, deletion of PAH1 in eaf1Δ cells partially suppressed the phenotype (). As defects in piecemeal microautophagy of the nucleus (PMN) also contribute to nuclear deformation,Citation29 we next sought to determine if NuA4 also impacts this pathway.
PMN, sometimes referred to as nucleophagy, selectively degrades and recycles portions of the nucleus into the vacuole under carbon or nitrogen limiting conditions.Citation42,Citation43 The first step of PMN is the formation of the nuclear vacuole junction (NVJ), which occurs via an interaction between the vacuolar protein Vac8 and the nuclear protein Nvj1 ().Citation44–47 Pah1 localizes to the NVJ and participates in lipid remodeling required for PMN.Citation17
Figure 4. Deletion of EAF1 results in a decrease in nuclear vacuole junction (NVJ) formation. (A) Graphic depicting the proteins and complex lipid metabolism that occurs at the NVJ. (B) Nitrogen starvation-induced NVJs are reduced in eaf1Δ cells. WT and eaf1Δ cells expressing genomically integrated NVJ1-RFP (YKB 5123 and YKB 5134) were grown to log phase in YPD at 30 °C prior to shifting into nitrogen starvation (NS) media for 4 h and staining with CMAC to visualize vacuoles. Images presented are representative of three biological replicates of at least 200 cells counted for each. Scale bar = 5 μm. (C) Proportion of cells with an NVJ, counted visually by assessing the presence or absence of Nvj1-RFP punctae within the cell. (D) The length of the NVJ was measured using a line tool on ImageJ. 20 cells were measured for each strain and performed in triplicate. For both C and D, ANOVA analysis was performed using Tukey’s multiple comparison test. Gray and purple dots represent three biological replicates. Horizontal bars represent the mean. ****P < 0.0001, ns = not significant, P > 0.05. Relevant statistical significance bars are shown, additional comparisons can be found in Supplemental Table 1.
First, we used Nvj1-RFP to visualize the formation of NVJ punctate localized between the nucleus (Acs2-GFP) and vacuole (CMAC) following nitrogen starvation. We found that eaf1Δ cells had a significant defect in the formation of the NVJ and a decrease in the size of those NVJs that did form (). Next, we measured PMN using Nab2-NLS-mCherry to mark the nucleus of the cell, and carefully dissected the Z-stack to measure the number of NLS-Nab2-mCherry PMN blebs within CMAC-labeled vacuoles.Citation48 We identified 37.5% of WT cells with a PMN bleb fully engulfed in the vacuole after 4 h of nitrogen starvation (, Supplemental Video 4). In contrast, only 7.6% of eaf1Δ cells had PMN blebs within the vacuole (). Interestingly, in eaf1Δ mutants, there were several instances where Nab2-NLS-mCherry extended in nuclear extensions around the vacuole (, middle panel), or was squeezed between vacuolar lobes (, bottom panel). However, 3D reconstruction of these cells confirmed that these extensions of the nucleus did not enter the vacuole itself (Supplemental Videos 5 and 6).
Figure 5. Deletion of EAF1 results in decreased piecemeal microautophagy of the nucleus (PMN). (A) WT and eaf1Δ cells (YKB 5186 and YKB 5187) with Nab2-NLS-mCherry to visualize the nucleus and CMAC staining the vacuole. Cells were grown to log phase in nutrient-rich media and then transferred into nitrogen starvation media. Merged Z-stack images show the formation of PMN structures, indicated by a white arrow, following 4 h of nitrogen starvation. 3D projection of Z-stacks using Imaris software shows PMN blebs entering the vacuole in WT cells. In eaf1Δ cells with nuclear extensions wrapping around or between vacuolar lobes were detected. Scale bar = 5 μm. Arrows indicate presence of a PMN bleb entering the vacuole. (B) Cells were grown in either YPD or switched to nitrogen starvation (NS) media for 4 h. The proportion of cells with PMN were carefully counted by investigating the full Z-stack of cells. If there was a clear bleb of Nab2-NLS mCherry that entered the vacuole, a cell was counted as having PMN. Under nitrogen starvation, eaf1Δ cells have a significant reduction in PMN compared to WT. ANOVA analysis was performed using Tukey’s multiple comparison test. Gray and purple dots represent three biological replicates, counting at least 200 cells for each. Horizontal bars represent the mean. Relevant statistical significance bars are shown, additional comparisons can be found in Supplemental Table 1. ****P < 0.0001, ns = not significant, P > 0.05. (C) WT and eaf1Δ cells expressing a GFP-Rosella construct fused to the nuclear localization signal from Nab35 (YKB 5188 and YKB 5189), were grown to mid-log phase and switched to nitrogen starvation media for 24 h prior to imaging. Arrows highlight Rosella signal in the vacuole, indicating active PMN. Scale bar = 5 μm.
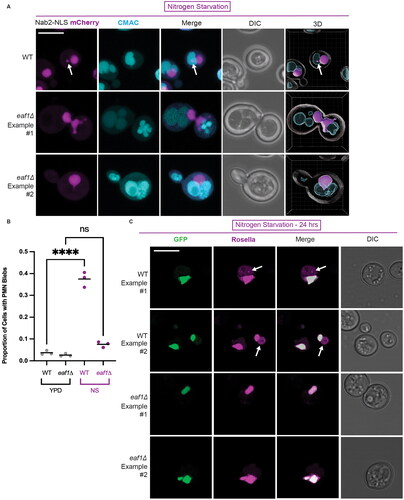
In a complementary approach, we used a GFP-Rosella construct fused to the nuclear localization signal of Nab35.Citation49 Under nutrient replete conditions, the GFP-Rosella-Nab35 fusion protein localizes to the nucleus where both GFP and Rosella can be visualized. After 24 h of nitrogen starvation, the GFP-Rosella-Nab35 proteins are engulfed in PMN blebs. Once in the vacuole, the GFP is digested leaving only the Rosella signal visible within the vacuolar lumen.Citation49 Following nitrogen starvation, the WT strain expressing GFP-Rosella-NAB35 showed GFP and Rosella signal in the nucleus, and Rosella signal in the vacuole (), indicating successful induction of PMN. However, in eaf1Δ cells GFP and Rosella signal only colocalized in the nucleus, with no detection of Rosella in the vacuoles (). Therefore, disruption of the NuA4 complex results in defects in PMN. Interestingly, unlike the nuclear deformations and vacuole fragmentation phenotypes (), PMN defects observed in eaf1Δ were not rescued by artificial tethering of Pah1 to the nuclear membrane (Supplemental Figure 7). Moreover, EAF1 was not required for interaction of Pah1 with Nvj1 and Vac8, as measured using a BiFC assay (Supplemental Figure 8). Therefore, despite having NVJ and PMN defects, NuA4 disruption does not impact the localization of Pah1 to the NVJ. Thus, the impact of NuA4 on these processes appears to be independent of Pah1.
Pah1-K496 impacts Pah1 localization to the INM
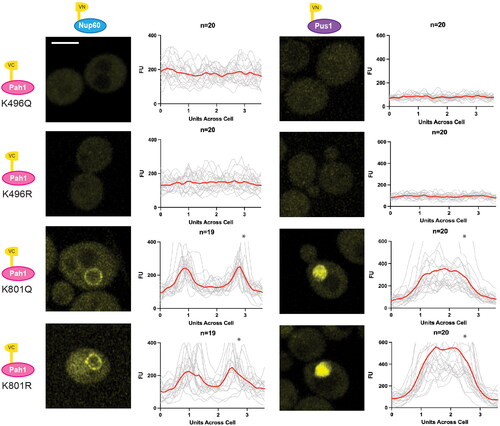
Pah1 is primarily localized to the cytosol, where it remains inactive, with a small proportion that is localized to the nuclear membrane and NVJ where it performs its catalytic function.Citation17,Citation19,Citation38,Citation39 The balance of Pah1 localization is directly linked to its functional activity. As our work suggests NuA4 regulates the localization of Pah1 to the nuclear membrane, we next explored whether this effect is mediated by Pah1 acetylation. Previous work has detected NuA4-dependant acetylation of Pah1 at K496 and K801. K496 was shown to be conserved among mammals and yeast, while tandem mutation of K496 and K801 to arginine resulted in decreased lipid droplet formation.Citation16 To investigate the functions of these two sites individually, we employed a modified BiFC assay. Lysine sites mutated to glutamine (Q) were used as an acetylation mimic. Lysine to arginine (R) mutations where used to prevent acetylation.Citation50 We constructed a series of four point mutants in the Pah1-VC bait protein (Pah1-K496Q-VC, Pah1-K496R-VC, Pah1-K801Q-VC and Pah1-K801R-VC), and confirmed their expression via Western blot (Supplemental Figure 3). We then assessed whether those mutations impacted Pah1-VC’s interaction with Pus1-VN (nucleoplasm marker) or Nup60-VN (INM marker). While Pah1-K801Q-VC and Pah1-K801R-VC interacted with both markers, we were unable to detect interactions between Pah1-K496Q-VC or Pah1-K496R-VC with either Pus1-VN or Nup60-VN (). This suggests that Pah1-K496 may impact its subcellular localization to the nucleus and the INM.
Figure 6. Mutations at Pah1-K496 result in a loss of Pah1-VC interaction with Pus1-VN and Nup60-VN. BiFC interaction between Pah1-K496Q-VC, Pah1-K496R-VC, Pah1-K801Q-VC, and Pah1-K801R-VC with both Nup60-VN (on left) and Pus1-VN (on right) (YKB 5206–YKB 5213) were visualized using fluorescence microscopy. Scale bar = 5 μm. Line graphs were generated by measuring the fluorescence intensity value of pixels across the nucleus of the cell using Plot Profile in ImageJ software. The gray lines show individual cell profiles and the red line indicate the average across all measured cells. n = the number of randomly selected cells. FU = fluorescence units. *Indicates that that y-axis has been cropped for easy comparison of strains.
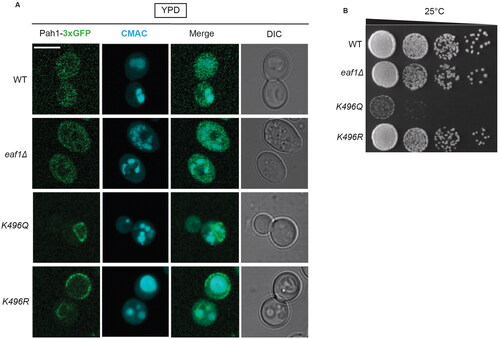
To further investigate Pah1-K496 as a potential site involved in the subcellular nuclear localization of Pah1, we introduced mutations in genomically integrated PAH1-3xGFP using CRISPR-Cas9.Citation51 As expected, in WT cells Pah1-3xGFP showed cytosolic localization ().Citation38 In eaf1Δ cells, Pah1-3xGFP localized to small punctate dots in a small percentage of cells but otherwise showed cytosolic localization. However, Pah1-K496R-3xGFP and Pah1-K496Q-3xGFP in both WT and eaf1Δ were mislocalized, possibly to the plasma membrane/ER (). We also performed a Western blot to confirm the protein levels of Pah1-3xGFP and were surprised to see a high level of degradation of Pah1-3xGFP in eaf1Δ as well as isoforms with higher apparent molecular weight (Supplemental Figure 9). Given the high levels of phosphorylation of Pah1 by multiple protein kinases (outlined in , top panel), it is possible that the loss of NuA4 is causing Pah1 to be hyperphosphorylated and sent to proteasomal degradation. In addition, in growth assays, pah1-K496Q cells had a significant growth defect compared to the moderate growth defects observed for eaf1Δ and pah1-K496R cells ().
Figure 7. Pah1-K496 confers changes in Pah1 localization. (A) Single sliced Z-stack images showing Pah1-3xGFP localization, and vacuoles labeled with CMAC in the WT PAH1-3xGFP (YKB 4993), eaf1Δ PAH1-3xGFP (YKB 4994), PAH1-K496Q-3XGFP (YKB 5130) and PAH1-K496R-3XGFP (YKB 5131) strains. Scale bar = 5 μm. (B) Dot assays showing growth of WT PAH1-3xGFP (YKB 4993), eaf1Δ PAH1-3xGFP (YKB 4994), PAH1-K496Q-3XGFP (YKB 5130) and PAH1-K496R-3XGFP (YKB 5131) after a period of 48 h at 25 °C.
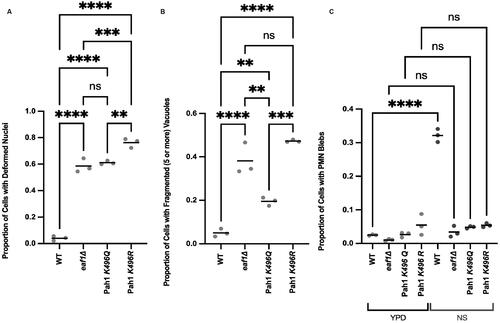
We hypothesized that if NuA4 was mediating its effects through acetylation of Pah1-K496, nuclear deformations, vacuole fragmentation and PMN defects detected in eaf1Δ cells would be recapitulated in pah1-K496R cells. Interestingly, both pah1-K496Q and pah1-K496R cells had high levels of nuclear deformations and defects in PMN, similar to eaf1Δ cells (). For vacuole fragmentation, pah1-K496R cells had fragmentation levels similar to that of eaf1Δ cells, while pah1-K496Q cells had levels closer to that of WT cells (). Our results suggest that mutations at K496 lead to phenotypes generally similar to that of eaf1Δ.
Figure 8. Pah1-K496 mutation results in increased nuclear deformation, vacuole fragmentation and defects in piecemeal microautophagy of the nucleus. (A) Proportion of WT (YKB 5190), eaf1Δ (YKB 5191), PAH1-K496Q (YKB 5192), and PAH1-K496R (YKB 5193) cells expressing Pah1-3xGFP and Nab2-NLS-mCherry were accessed for nuclear deformation. (B) Proportion of cells with fragmented (five or more) vacuoles quantified by visually counting the number of vacuoles per cell. (C) Proportion of cells with PMN blebs. Cells were grown in either YPD or switched to nitrogen starvation (NS) media for 4 h. If there was a clear bleb of Nab2-NLS mCherry that entered the vacuole, a cell was counted as having PMN. For A, B and C, an ANOVA analysis was performed using Tukey’s multiple comparison test. Cells were counted by investigating the full Z-stack of cells. Dots represent three biological replicates of at least 100 cells for each. Horizontal bars represent the mean. **P ≤ 0.01, ***P ≤ 0.001, ****P < 0.0001, ns = not significant, P > 0.05. Relevant statistical significance bars are shown, additional comparisons can be found in Supplemental Table 1.
Discussion
The functional consequences of Pah1 acetylation and the role of NuA4 in regulating phospholipid availability for membranes has remained unclear. In this study we identify changes in organelle morphology upon deletion of EAF1, the scaffolding subunit of the NuA4 complex, including nuclear deformation and vacuole fragmentation (). We further identified significant defects in NVJ formation and function of PMN in eaf1Δ cells ( and ). Importantly, all nuclear deformation and vacuole fragmentation phenotypes are recapitulated by Pah1 mutation at lysine residue K496 (), a known site of NuA4-acetylation. Together, our data suggest that Pah1 K496 directs multiple aspects of Pah1 function to coordinate organelle membrane homeostasis.
Pah1 is typically inactive in the cytoplasm but is activated by dephosphorylation by Nem1-Spo7, allowing it to localize to the nuclear membrane to perform its function (summarized in ).Citation18,Citation40,Citation52 Using a BiFC assay, we were able to visualize a subpopulation of Pah1 in the nucleoplasm, but not the INM, upon deletion of EAF1 (). Recent work from our lab showed that there are no changes in global levels of PA in NuA4 mutants.Citation11 In agreement with this, we did not detect PA accumulation at the INM of eaf1Δ cells (, top panel). Thus, we suggest that transient PA that accumulates due to mislocalization of Pah1 is quickly converted to phospholipids that can drive membrane expansions associated with nuclear deformations. Since DAG is the substrate for Pah1, we were surprised to detect this lipid species at the INM (, bottom panel). It is possible that DAG synthesis is maintained in part via a subpool of Pah1 that localizes to the INM but is not detectable by our BiFC assay. Alternatively, DAG accumulation could be explained by activation of compensatory mechanisms in eaf1Δ cells.
While we have shown that nuclear deformations in eaf1Δ are partially caused by an influx of PA driving the production of membrane phospholipids, there remains a portion of nuclear deformations that were not rescued by decreasing membrane phospholipid synthesis via mutation of DGK1, INO1 or CDS1 (). Therefore, we explored alternative pathways that regulate nuclear shape. We focused on the NVJ,Citation47,Citation53 an important membrane contact site between the nucleus and the vacuole that promotes a selective autophagy process, PMN, and digests excess nuclear membrane that could be contributing to deformations.Citation43,Citation53,Citation54 Interestingly, we found that upon deletion of EAF1 there are severe defects in the formation of the NVJ () and subsequent PMN (). It is tempting to think that the level of vacuole fragmentation seen in our NuA4 mutants (, Supplemental Figure 1) could be the cause of NVJ dysfunction. However, previous work from Krick et al.Citation55 showed that PMN can still occur in vacuoles lacking fusion machinery. Further, eaf1Δ cells have large fused vacuoles upon nitrogen starvation (), indicating that they retain the machinery for vacuole fusion. NVJ and PMN defects are also not due to defects in localization of Pah1 adjacent to the NVJ,Citation17 as our BiFC studies indicate that Pah1 interaction with Nvj1 and Vac8 are not disrupted in eaf1Δ cells (Supplemental Figure 8). One possibility is that NuA4 may be involved in regulating the core autophagy machinery involved in PMN. For example, NuA4 is a known regulator of Atg3 through direct acetylation at three different sites.Citation56,Citation57 Conversely, NuA4 could impact the stability and/or formation of the NVJ itself, as NuA4 has been shown to interact with Vac8 through Eaf1.Citation58
Finally, cells lacking EAF1 also have vacuolar fragmentation defects () that are rescued by artificial recruitment of Pah1 to the nuclear membrane (). This rescue was surprising given that pah1Δ cells do not have increased vacuolar fragmentation. It is possible that forced localization of Pah1 to the nuclear membrane initiates a nuclear-vacuole feedback response that is not active under physiological conditions. This result highlights unknown complexities in nuclear-vacuole communication.
Since previous studies identified two potential NuA4 acetylation sites on Pah1, K496 and K801, we sought to determine if these sites influence Pah1 subcellular location. Mutation of K496, but not K801, to either Q or R prevented Pah1-VC localization to the nucleus and INM (), redistributed Pah1-3xGFP to organelle membranes (), and decreased PMN (). While both Pah1-K496R and Pah1-K496Q displayed increased nuclear deformation and vacuole fragmentation, the defects displayed by the K496Q mutant were significantly lower than the K496R mutant (). Since both mutants showed similar phenotypes, we cannot discount that these mutations are affecting Pah1 functions beyond acetylation. Alternatively, we suggest that cycles of acetylation and deacetylation may be critical to maintain Pah1 localization and other functions related to lipid metabolism and organelle membrane homeostasis. As such, dynamic regulation of Pah1 by lysine deacetylases should be an active area of future investigation.
Materials and Methods
Cell culture
A list of all strains used in this work can be found in Supplemental Table 2. This study uses the BY4741 (S288C) yeast strain background. Strains were made through PCR-mediated insertion/deletionCitation59 and confirmed through PCR. All strains were grown in either YPD media (1% yeast extract, 2% peptone, 2% dextrose), SC media (6.7 g/L of YNB with ammonium sulfate, lacking indicated amino acids) or NS media (1.7 g/L of YNB without ammonium sulfate). Yeast were cultured in the indicated media at 30 °C unless otherwise stated. Yeast were grown overnight before being diluted to an OD600 of 0.1 in the morning and allowed to grow to mid-log phase (OD600 of 0.5–0.8) for experiments. For induction of PMN, cells were grown to mid-log phase, washed with water, and resuspended in NS media to grow for 4 h.
Serial dilution dot assays
Cultures were grown to mid-log phase in YPD media and diluted to an OD600 of 1.0. They were then further diluted into OD600’s of 0.1, 0.001, and 0.0001. Five microliters of each serial dilution was placed onto YPD plates in descending order across each row. This was repeated three times for all query strains. Representative images are shown.
Microscopy
Yeast cells were prepared by growing them to mid-log phase (OD600 0.5–0.8) in necessary media to maintain plasmids. If CellTracker Blue CMAC (7-amino-4-chloromethylcoumarin) (Invitrogen C2110) was used, it was added to cells in liquid media at a concentration of 10 mM for 15 mins. Cells were spun down and the pellet was resuspended in SC media for imaging.
All representative images were captured with Zeiss Axio-ObserverZ1-LSM 880-AiryScan confocal microscope driven by the Zen Black 2.3 software. The laser scanning microscope is a Zeiss LSM880 confocal microscope, outfitted with a 63×/1.4 NA objective (in combination with Immersion oil 518F 37C). Images were captured using the Airyscan detector (sequential, unidirectional scanning, Z-stack of 0.2 μm slice thickness).
See below the relevant settings used to image each type of fluorophore:
For Venus: Argon laser at 514 nm (2%), with filter: BP 495–550 + LP 570, pixel dwell: 8.04 × 10⁻⁷
For GFP: Argon laser at 488 nm (2%), with filter: BP 495–550 + LP 570, pixel dwell: 8.04 × 10⁻⁷
For CellTracker Blue CMAC: Diode laser at 405–30 nm (2.9%), with filter: BP 420–480 + LP605 + LP 570, pixel dwell: 8.04 × 10⁻⁷
For RFP and mCherry: Diode laser 561 nm (2%), with filter: BP 495–550 + LP 570, pixel dwell: 8.04 × 10⁻⁷
Raw images went through subsequent Airyscan processing before being used for the surface rendering.
Fluorescence intensities of Venus fluorescence and PA/DAG mCherry biosensors were measured using the “plot profile” plugin of Fiji to generate a profile of fluorescence intensity across the cell (centered on the nucleus or punctate when relevant). This was repeated for the indicated “n” replicates. All replicates were plotted on the graph with the mean of all lines plotted in black.
When indicated, images for quantification were done on Leica fluorescent microscope (DMI6000; Leica Microsystems) equipped with a Hamamatsu camera, DG4 light source (Sutter Instruments) and Volocity 4.3.2 software (Perkin Elmer), or on the Axio-Obsersever7 (Zeiss) driven by Zen 3.2.
Illumination: HXP 120
Camera: sCMOS ORCA-Flash LT
Objective: 63×/NA 1.4
Filters:
GFP channel: Ex: BP 450/50, FT: 480, EM: BP 510/50, exposure time: 5 s, Light intensity
CellTracker Blue CMAC: Ex: G365, FT: 395 nm, EM: BP 445/50, exposure time: 3 s, Light intensity
Mcherry or RFP: Ex: BP 550/25, FT: 570, EM: BP 605/70, exposure time: 10 s, Light intensity
3D images
Surface rendering was performed using Imaris 9.8 (Bitplane, Oxford Instruments), with the following settings:
Background subtraction - LS (Largest surface) set at: 0.2 μm, without smoothing
Objects bigger or smaller than 0.2 μm were filtered out.
Western blots
Yeast strains were grown overnight at 30 °C in 25 mL of YPD media and diluted the next morning into 50 mL cultures at an OD600 of 0.2. Cells were harvested at mid-log phase and whole cell extracts were collected. Cells were centrifuged at 4 °C, washed with water, and centrifuged again to remove any trace of culture media. Finally, pellets were flash frozen in liquid nitrogen and stored at −80 °C. Pellets were thawed on ice and 1× the pellet volume of lysis buffer (20 mM HEPES pH 7.4, 0.1% Tween 20, 2 mM MgCl2, 300 mM NaCl, protease inhibitor [P-8215; Sigma]) was added. Equal volume of glass beads (Fisher 35–5350) were added to the mixture, which was then lysed by bead beating method five times for 1 min with a 1 min rest on ice in between. Whole cell extracts were collected and quantified using Bradford assay.
A standard curve for each protein was performed to determine the optimal amount of protein to be loaded on TGX quantitative gels for Western blot. This was loaded onto a 10% Mini-PROTEAN TGX Precast Protein gels (Bio-Rad 4561033) and run in 1× SDS-PAGE running buffer at 120 V for approximately an hour and a half. Once completed, the gel was activated and visualized under UV. The gel was then transferred onto nitrocellulose membrane (Bio-Rad 1620112) using a semi-dry transfer method. Total protein was imaged under UV. Blocking was performed in 5% milk in TBS-T (tris-buffered saline + 1% Tween 20) for 1 h before incubation overnight with 1:1000 dilution of anti-GFP primary antibody (Sigma-Aldrich 11874460000) or anti-mCherry (Abcam ab125096) in 5% milk TBS-T. Blots were then washed three times in TBS-T for 10 min each, incubated for 1 h with 1:5000 dilution of anti-mouse secondary antibody in 5% milk TBS-T, and washed again three times. Blots were visualized with Clarity Western ECL (Bio-Rad 170-5061) and imaged with Bio-Rad’s ChemiDoc system.
CRISPR-Cas9 acetylation mimics
Pah1 point mutations at Lysine 496 (K496) were created by CRISPR-Cas9. This protocol is adapted from Dicarlo et al.Citation51 The Cas9 plasmid, p415-TEF1p-Cas9-CYC1t,Citation51 was transformed into Pah1-3xGFP strains and maintained on SC-LEU media.
A PAM sequence, selected from a list from Dicarlo et al.Citation51 to target the surrounding area of Pah1-K496, was cloned into the guide RNA plasmid, p426-SNR52p-NotI(gRNA)-SUP4t by PCR. The resulting plasmid was treated with DPN1, transformed into DH5α E.coli to amplify, and then confirmed through sequencing at the TCAG facility at SickKids, Toronto. Double-stranded DNA (dsDNA) that matched the cleaved area and contained the mutations at K496, as well as the NGG PAM site, were created by annealing two single-stranded oligos at 100 °C and then slowly decreasing the temperature.
The guide RNA plasmid and the dsDNA were transformed into the strains and selected for on SC-LEU-URA. Positive colonies were collected for genomic DNA extraction. A PCR product was generated from the mutation area and sent for sequencing at the TCAG Facility at SickKids, Toronto to confirm the mutation site.
Mutagenesis of BiFC Pah1-VC plasmid
Pah1-K496Q-VC, Pah1-K496R-VC, Pah1-K801Q-VC and Pah1-K801R-VC plasmids were generated via Mutagenesis service from Genscript USA Inc.
Gibson assembly
Mlp1-VC and Nup2-VC plasmids were assembled via Gibson assembly service provided by the University of Ottawa’s Genome Editing and Molecular biology (GEM) Facility following standardized protocols.
Statistical analysis
GraphPad Prism was used to perform all statistical analyses. A two-way ANOVA was used to compare all data with more than two groups. The means of individual pairs were compared by Tukey’s multiple comparison test. P values are indicated in figure legends.
Author Contributions
S.J.L., L.F.D, and A.D. performed investigation and data curation. S.J.L. performed formal analysis, validation, visualization and writing – original draft. S.J.L., M.D. and K.B performed conceptualization, methodology, and writing – review and editing, with input from other authors. K.B. and M.D. provided supervision, resources, project administration and funding acquisition.
Supplemental Material
Download Zip (14.5 MB)Acknowledgments
We thank the Carman Lab at the University of Cambridge and the Köhler lab at the Medical University of Vienna for providing plasmids used in this work. We acknowledge that all fluorescent microscopy images were generated in the Cell Biology and Image Acquisition (CBIA) Core Facility at the University of Ottawa. In addition, Gibson assembly was performed by the University of Ottawa’s Genomic Editing and Molecular biology (GEM) core.
Data availability statement
Supplemental Videos and raw figure data are available on Figshare: https://figshare.com/s/0448d63faeb05ded3d0b (DOI: 10.6084/m9.figshare.25576950). Additional data is available upon request to corresponding authors.
Disclosure statement
The authors declare no competing financial interests.
Additional information
Funding
References
- Allard S, Utley RT, Savard J, Clarke A, Grant P, Brandl CJ, Pillus L, Workman JL, Côté J. NuA4, an essential transcription adaptor/histone H4 acetyltransferase complex containing Esa1p and the ATM-related cofactor Tra1p. EMBO J. 1999;18:5108–5119. doi:10.1093/emboj/18.18.5108.
- Auger A, Galarneau L, Altaf M, Nourani A, Doyon Y, Utley RT, Cronier D, Allard S, Côté J. Eaf1 is the platform for NuA4 molecular assembly that evolutionarily links chromatin acetylation to ATP-dependent exchange of histone H2A variants. Mol Cell Biol. 2008;28:2257–2270. doi:10.1128/mcb.01755-07.
- Cheng X, Auger A, Altaf M, Drouin S, Paquet E, Utley RT, Robert F, Côté J. Eaf1 links the NuA4 histone acetyltransferase complex to Htz1 incorporation and regulation of purine biosynthesis. Eukaryot Cell. 2015;14:535–544. doi:10.1128/ec.00004-15.
- Chittuluru JR, Chaban Y, Monnet-Saksouk J, Carrozza MJ, Sapountzi V, Selleck W, Huang J, Utley RT, Cramet M, Allard S, et al. Structure and nucleosome interaction of the yeast NuA4 and Piccolo–NuA4 histone acetyltransferase complexes. Nat Struct Mol Biol. 2011;18:1196–1203. doi:10.1038/nsmb.2128.
- Ji L, Zhao L, Xu K, Gao H, Zhou Y, Kornberg RD, Zhang H. Structure of the NuA4 histone acetyltransferase complex. Proc Natl Acad Sci USA. 2022;119:e2214313119. doi:10.1073/pnas.2214313119.
- Doyon Y, Selleck W, Lane WS, Tan S, Côté J. Structural and functional conservation of the NuA4 histone acetyltransferase complex from yeast to humans. Mol Cell Biol. 2004;24:1884–1896. doi:10.1128/mcb.24.5.1884-1896.2004.
- Clarke AS, Lowell JE, Jacobson SJ, Pillus L. Esa1p is an essential histone acetyltransferase required for cell cycle progression. Mol Cell Biol. 1999;19:2515–2526. doi:10.1128/mcb.19.4.2515.
- Mitchell L, Huard S, Cotrut M, Pourhanifeh-Lemeri R, Steunou AL, Hamza A, Lambert JP, Zhou H, Ning Z, Basu A, et al. mChIP-KAT-MS, a method to map protein interactions and acetylation sites for lysine acetyltransferases. Proc Natl Acad Sci USA. 2013;110:E1641–E1650. doi:10.1073/pnas.1218515110.
- Dacquay L, Flint A, Butcher J, Salem D, Kennedy M, Kaern M, Stintzi A, Baetz K. NuA4 lysine acetyltransferase complex contributes to phospholipid homeostasis in Saccharomyces cerevisiae. G3 (Bethesda). 2017;7:1799–1809. doi:10.1534/g3.117.041053.
- Mitchell L, Lambert J-P, Gerdes M, Al-Madhoun AS, Skerjanc IS, Figeys D, Baetz K. Functional dissection of the NuA4 histone acetyltransferase reveals its role as a genetic hub and that Eaf1 is essential for complex integrity. Mol Cell Biol. 2008;28:2244–2256. doi:10.1128/mcb.01653-07.
- Pham T, Walden E, Huard S, Pezacki J, Fullerton MD, Baetz K. Fine-tuning acetyl-CoA carboxylase 1 activity through localization: functional genomics reveals a role for the lysine acetyltransferase NuA4 and sphingolipid metabolism in regulating Acc1 activity and localization. Genetics. 2022;221(4):iyac086. doi:10.1093/genetics/iyac086.
- Walden EA, Fong RY, Pham TT, Knill H, Laframboise SJ, Huard S, Harper ME, Baetz K. Phenomic screen identifies a role for the yeast lysine acetyltransferase NuA4 in the control of Bcy1 subcellular localization, glycogen biosynthesis, and mitochondrial morphology. PLoS Genet. 2020;16:(e1009220. doi:10.1371/journal.pgen.1009220.
- Lin YY, Lu JY, Zhang J, Walter W, Dang W, Wan J, Tao SC, Qian J, Zhao Y, Boeke JD, et al. Protein acetylation microarray reveals that NuA4 controls key metabolic target regulating gluconeogenesis. Cell. 2009;136:1073–1084. doi:10.1016/j.cell.2009.01.033.
- Huang J, Mousley CJ, Dacquay L, Maitra N, Drin G, He C, Ridgway ND, Tripathi A, Kennedy M, Kennedy BK, et al. A lipid transfer protein signaling axis exerts dual control of cell-cycle and membrane trafficking systems. Dev Cell. 2018;44:378–391.e5. doi:10.1016/j.devcel.2017.12.026.
- Rollins M, Huard S, Morettin A, Takuski J, Pham TT, Fullerton MD, Côté J, Baetz K. Lysine acetyltransferase NuA4 and acetyl-CoA regulate glucose-deprived stress granule formation in Saccharomyces cerevisiae. PLoS Genet. 2017;13:(e1006626. doi:10.1371/journal.pgen.1006626.
- Li TY, Song L, Sun Y, Li J, Yi C, Lam SM, Xu D, Zhou L, Li X, Yang Y, et al. Tip60-mediated lipin 1 acetylation and ER translocation determine triacylglycerol synthesis rate. Nat Commun. 2018;9:1916. doi:10.1038/s41467-018-04363-w.
- Barbosa AD, Sembongi H, Su W-M, Abreu S, Reggiori F, Carman GM, Siniossoglou S. Lipid partitioning at the nuclear envelope controls membrane biogenesis. Mol Biol Cell. 2015;26:3641–3657. doi:10.1091/mbc.e15-03-0173.
- Carman GM, Han G-S. Fat-regulating phosphatidic acid phosphatase: a review of its roles and regulation in lipid homeostasis. J Lipid Res. 2019;60:2–6. doi:10.1194/jlr.s087452.
- Han G-S, Wu W-I, Carman GM. The Saccharomyces cerevisiae lipin homolog is a Mg2+-dependent phosphatidate phosphatase enzyme*. J Biol Chem. 2006;281:9210–9218. doi:10.1074/jbc.M600425200.
- Pillai AN, Shukla S, Rahaman A. An evolutionarily conserved phosphatidate phosphatase maintains lipid droplet number and ER morphology but not nuclear morphology. Biol Open. 2017;6:1629–1643. doi:10.1242/bio.028233.
- Campbell JL, Lorenz A, Witkin KL, Hays T, Loidl J, Cohen-Fix O. Yeast nuclear envelope subdomains with distinct abilities to resist membrane expansion. Mol Biol Cell. 2006;17:1768–1778. doi:10.1091/mbc.e05-09-0839.
- Santos-Rosa H, Leung J, Grimsey N, Peak-Chew S, Siniossoglou S. The yeast lipin Smp2 couples phospholipid biosynthesis to nuclear membrane growth. EMBO J. 2005;24:(1931–1941. doi:10.1038/sj.emboj.7600672.
- Han G-S, O’Hara L, Carman GM, Siniossoglou S. An unconventional diacylglycerol kinase that regulates phospholipid synthesis and nuclear membrane growth. J Biol Chem. 2008;283:20433–20442. doi:10.1074/jbc.m802903200.
- Pascual F, Soto-Cardalda A, Carman GM. PAH1-encoded phosphatidate phosphatase plays a role in the growth phase- and inositol-mediated regulation of lipid synthesis in Saccharomyces cerevisiae. J Biol Chem. 2013;288:35781–35792. doi:10.1074/jbc.m113.525766.
- Sasser T, Qiu Q-S, Karunakaran S, Padolina M, Reyes A, Flood B, Smith S, Gonzales C, Fratti RA. Yeast lipin 1 orthologue Pah1p regulates vacuole homeostasis and membrane fusion. J Biol Chem. 2012;287:2221–2236. doi:10.1074/jbc.m111.317420.
- Rahman MA, Mostofa MG, Ushimaru T. The Nem1/Spo7–Pah1/lipin axis is required for autophagy induction after TORC 1 inactivation. FEBS J. 2018;285:1840–1860. doi:10.1111/febs.14448.
- Lussier M, White A-M, Sheraton J, Di Paolo T, Treadwell J, Southard SB, Horenstein CI, Chen-Weiner J, Ram AFJ, Kapteyn JC, et al. Large scale identification of genes involved in cell surface biosynthesis and architecture in Saccharomyces cerevisiae. Genetics. 1997;147:435–450. doi:10.1093/genetics/147.2.435.
- Miner GE, Starr ML, Hurst LR, Fratti RA. Deleting the DAG kinase Dgk1 augments yeast vacuole fusion through increased Ypt7 activity and altered membrane fluidity. Traffic. 2017;18:(315–329. doi:10.1111/tra.12479.
- Meseroll RA, Cohen-Fix O. The malleable nature of the budding yeast nuclear envelope: flares, fusion, and fenestrations. J Cell Physiol. 2016;231:2353–2360. doi:10.1002/jcp.25355.
- Li Z, Vizeacoumar FJ, Bahr S, Li J, Warringer J, Vizeacoumar FS, Min R, Vandersluis B, Bellay J, Devit M, et al. Systematic exploration of essential yeast gene function with temperature-sensitive mutants. Nat Biotechnol. 2011;29:361–367. doi:10.1038/nbt.1832.
- Fakas S, Qiu Y, Dixon JL, Han G-S, Ruggles KV, Garbarino J, Sturley SL, Carman GM. Phosphatidate phosphatase activity plays key role in protection against fatty acid-induced toxicity in yeast. J Biol Chem. 2011;286:29074–29085. doi:10.1074/jbc.m111.258798.
- Galarneau L, Nourani A, Boudreault AA, Zhang Y, Héliot L, Allard S, Savard J, Lane WS, Stillman DJ, Côté J. Multiple links between the NuA4 histone acetyltransferase complex and epigenetic control of transcription. Mol Cell. 2000;5:927–937. doi:10.1016/s1097-2765(00)80258-0.
- Romanauska A, Köhler A. The inner nuclear membrane is a metabolically active territory that generates nuclear lipid droplets. Cell. 2018;174:700–715.e18. doi:10.1016/j.cell.2018.05.047.
- Hashemi HF, Goodman JM. The life cycle of lipid droplets. Curr Opin Cell Biol. 2015;33:119–124. doi:10.1016/j.ceb.2015.02.002.
- Miller KE, Kim Y, Huh W-K, Park H-O. Bimolecular Fluorescence Complementation (BiFC) analysis: advances and recent applications for genome-wide interaction studies. J Mol Biol. 2015;427:2039–2055. doi:10.1016/j.jmb.2015.03.005.
- Choi H-S, Su W-M, Han G-S, Plote D, Xu Z, Carman GM. Pho85p-Pho80p phosphorylation of yeast Pah1p phosphatidate phosphatase regulates its activity, location, abundance, and function in lipid metabolism. J Biol Chem. 2012;287:11290–11301. doi:10.1074/jbc.m112.346023.
- Su W-M, Han G-S, Casciano J, Carman GM. Protein kinase A-mediated phosphorylation of Pah1p phosphatidate phosphatase functions in conjunction with the Pho85p-Pho80p and Cdc28p-cyclin B kinases to regulate lipid synthesis in yeast. J Biol Chem. 2012;287:33364–33376. doi:10.1074/jbc.m112.402339.
- Karanasios E, Barbosa AD, Sembongi H, Mari M, Han G-S, Reggiori F, Carman GM, Siniossoglou S. Regulation of lipid droplet and membrane biogenesis by the acidic tail of the phosphatidate phosphatase Pah1p. Mol Biol Cell. 2013;24:2124–2133. doi:10.1091/mbc.e13-01-0021.
- Karanasios E, Han G-S, Xu Z, Carman GM, Siniossoglou S. A phosphorylation-regulated amphipathic helix controls the membrane translocation and function of the yeast phosphatidate phosphatase. Proc Natl Acad Sci USA. 2010;107:17539–17544. doi:10.1073/pnas.1007974107.
- Kwiatek JM, Carman GM. Yeast phosphatidic acid phosphatase Pah1 hops and scoots along the membrane phospholipid bilayer. J Lipid Res. 2020;61:1232–1243. doi:10.1194/jlr.RA120000937.
- Han GS, Carman GM. Yeast PAH1-encoded phosphatidate phosphatase controls the expression of CHO1-encoded phosphatidylserine synthase for membrane phospholipid synthesis. J Biol Chem. 2017;292:13230–13242. doi:10.1074/jbc.M117.801720.
- Mijaljica D, Prescott M, Devenish RJ. The intricacy of nuclear membrane dynamics during nucleophagy. Nucleus. 2010;1:213–223. doi:10.4161/nucl.1.3.11738.
- Roberts P, Moshitch-Moshkovitz S, Kvam E, O’Toole E, Winey M, Goldfarb DS. Piecemeal microautophagy of nucleus in Saccharomyces cerevisiae. Mol Biol Cell. 2003;14:129–141. doi:10.1091/mbc.e02-08-0483.
- Manik MK, Yang H, Tong J, Im YJ. Structure of yeast OSBP-related protein Osh1 reveals key determinants for lipid transport and protein targeting at the nucleus-vacuole junction. Structure. 2017;25:617–629. doi:10.1016/j.str.2017.02.010.
- Tamura Y, Kawano S, Endo T. Organelle contact zones as sites for lipid transfer. J Biochem. 2019;165:115–123. doi:10.1093/jb/mvy088.
- Toulmay A, Prinz WA. A conserved membrane-binding domain targets proteins to organelle contact sites. J Cell Sci. 2012;125:(49–58. doi:10.1242/jcs.085118.
- Pan X, Roberts P, Chen Y, Kvam E, Shulga N, Huang K, Lemmon S, Goldfarb DS. Nucleus–vacuole junctions in Saccharomyces cerevisiae are formed through the direct interaction of Vac8p with Nvj1p. Mol Biol Cell. 2000;11:2445–2457. doi:10.1091/mbc.11.7.2445.
- Millen JI, Krick R, Prick T, Thumm M, Goldfarb DS. Measuring piecemeal microautophagy of the nucleus in Saccharomyces cerevisiae. Autophagy. 2009;5:75–81. doi:10.4161/auto.5.1.7181.
- Rosado C, Mijaljica D, Hatzinisiriou I, Prescott M, Devenish RJ. Rosella: a fluorescent pH-biosensor for reporting vacuolar turnover of cytosol and organelles in yeast. Autophagy. 2008;4:205–213. doi:10.4161/auto.5331.
- Wang X, Hayes JJ. Acetylation mimics within individual core histone tail domains indicate distinct roles in regulating the stability of higher-order chromatin structure. Mol Cell Biol. 2008;28:227–236. doi:10.1128/mcb.01245-07.
- Dicarlo JE, Norville JE, Mali P, Rios X, Aach J, Church GM. Genome engineering in Saccharomyces cerevisiae using CRISPR-Cas systems. Nucleic Acids Res. 2013;41:4336–4343. doi:10.1093/nar/gkt135.
- O’Hara L, Han G-S, Peak-Chew S, Grimsey N, Carman GM, Siniossoglou S. Control of phospholipid synthesis by phosphorylation of the yeast lipin Pah1p/Smp2p Mg2+-dependent phosphatidate phosphatase. J Biol Chem. 2006;281:34537–34548. doi:10.1074/jbc.m606654200.
- Kvam E, Goldfarb DS. Nucleus–vacuole junctions in yeast: anatomy of a membrane contact site. Biochem Soc Trans. 2006;34:340–342. doi:10.1042/BST0340340.
- Krick R, Mühe Y, Prick T, Bredschneider M, Bremer S, Wenzel D, Eskelinen E-L, Thumm M. Piecemeal microautophagy of the nucleus: genetic and morphological traits. Autophagy. 2009;5:270–272. doi:10.4161/auto.5.2.7639.
- Krick R, Muehe Y, Prick T, Bremer S, Schlotterhose P, Eskelinen EL, Millen J, Goldfarb DS, Thumm M. Piecemeal microautophagy of the nucleus requires the core macroautophagy genes. Mol Biol Cell. 2008;19:4492–4505. doi:10.1091/mbc.e08-04-0363.
- Yi C, Ma M, Ran L, Zheng J, Tong J, Zhu J, Ma C, Sun Y, Zhang S, Feng W, et al. Function and molecular mechanism of acetylation in autophagy regulation. Science. 2012;336:474–477. doi:10.1126/science.1216990.
- Hamaï A, Codogno P. New targets for acetylation in autophagy. Sci Signal. 2012;5:pe29. doi:10.1126/scisignal.2003187.
- Tang F, Peng Y, Nau JJ, Kauffman EJ, Weisman LS. Vac8p, an Armadillo repeat protein, coordinates vacuole inheritance with multiple vacuolar processes. traffic. 2006;7:1368–1377. doi:10.1111/j.1600-0854.2006.00458.x.
- Longtine MS, McKenzie A, Demarini DJ, Shah NG, Wach A, Brachat A, Philippsen P, Pringle JR. Additional modules for versatile and economical PCR-based gene deletion and modification in Saccharomyces cerevisiae. Yeast. 1998;14:953–961. doi:10.1002/(SICI)1097-0061(199807)14:10.