
Keywords::
Introduction
In the observational sciences, technical advances are often followed by dramatic increases in scientific discoveries and improved theory. Leuwenhoek’s microscope and Galileo’s telescope gave us a “better look” at the microworld and the cosmos, which led to revolutions of past paradigms. In geomorphology and landscape analysis, similar advances have accompanied new maps and new mapping techniques. The first accurate globes, where the puzzle-piece fit of the southern continents was quickly noticed, were soon followed by the first mention of what would be continental drift. The first topographic maps were accompanied by similar shifts in thinking. For example, accurate topographic maps of the western US brought about the realization that even in arid regions, fluvial erosion can be the dominant landscaping force. Aerial photography provided a similar advance in observation, mapping and understanding. Satellite imagery of the Earth and other planets has dramatically revealed the geomorphic processes operating in inaccessible places, for example meteor impacts, volcanism and the importance of eolian and fluvial processes. Recent observations of Pluto and Mars attest to this fact. Satellite imagery also led to a revolution in glacial geomorphology by providing continent-wide images of features heretofore unnoticed, for example the palimpsest flow indicators of the Laurentide Ice Sheet (Boulton & Clark Citation1990). In the 90s, the production of digital elevation models (DEMs) and the development of geographic information system (GIS) tools allowed for new highly quantitative analysis of landscapes.
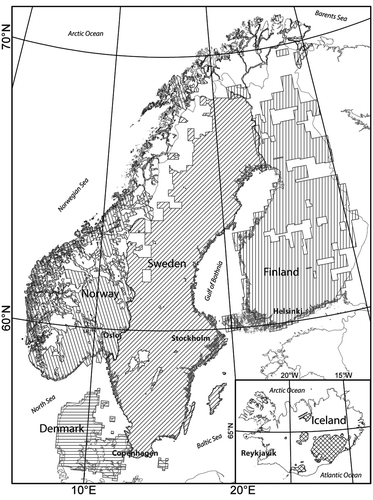
The advent of LiDAR (Light Detection and Ranging) technology is poised to provide a similar rapid advance in observations and the potential for significant advances in geomorphic theory. We see that the ever increasing use of LiDAR technology is creating a similar leap forward in geomorphology, and this issue is dedicated to illustrating this fact for Scandinavia (Fig. ).
Fig. 1. Nationally collected LiDAR data available in the Scandinavian countries as of autumn 2015.
The illumination of “mesoscale” landforms
Previously recognized larger-scale landforms, (end moraines, drumlins, etc.) show up readily on the LiDAR DEMs in greater detail, but it is what might be called the “mesoscale” landforms that are especially stunning. These are the landforms that are smaller than can be resolved on most topographic maps, are often too subtle to be discerned in the field, and have a small enough relief not to be noticed on aerial photographs. These include, but are not limited to
| • | Glacial lineations (crag-and-tails, low-relief mega flutes, small drumlins) | ||||
| • | De Geer moraines and other small end moraines | ||||
| • | Glacial hummocks, small eskers | ||||
| • | Beach ridges, cliffs and shore terraces | ||||
| • | Fluvial terraces and flood-plain features | ||||
| • | Lateral meltwater channels | ||||
| • | Ravines | ||||
| • | Fault and fault-line scarps | ||||
| • | Bedrock structure | ||||
Here, we show several examples. Throughout Scandinavia, the new LiDAR DEMs have revealed glacial lineations that show clearly the ice-flow direction over till plains and knobby bedrock surfaces (Fig. A). These directional data compliment the information from bedrock striations and clearly show the flow directions that occurred on the till surface during the last glaciation. These lineations are abundant and, when completely mapped, promise to give a highly detailed picture of regional flow variations (for example, Greenwood et al. Citation2015). These lineations also can occur on other landforms (hummocks, end moraines, eskers, etc.) and reveal that these have been overridden by later readvances of the ice (Fig. ).
Fig. 2. Examples of LiDAR revealed landforms in Scandinavia. Illumination from NW, except for D. A. NE of Umeå, northern Sweden, a series of N–S oriented bedrock-headed lineations (crag and tails). B. Hillshaded DEM (LiDAR DEMs) examples of ancient shorelines (beach ridges) from Hanko, southwestern Finland. Since the isolation, most of the ancient beach ridges lying between 10 and 20 m a.s.l. have been deformed to dunes. C. Hillshaded DEM examples of De Geer moraine field from Ruokojärvi, Kouvola, southern Finland. D. Hillshaded DEM example of the Röjnoret PGF, west of Skellefteå, Sweden. This image is illuminated from NE. E. The region around Mora, Sweden, showing dunes, Rogen moraine, eskers, glacial lineations and meander scars. F. Well developed ravines in glacial clay SE of Filipstad, Sweden.
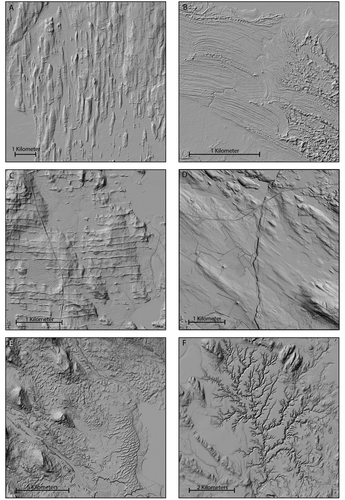
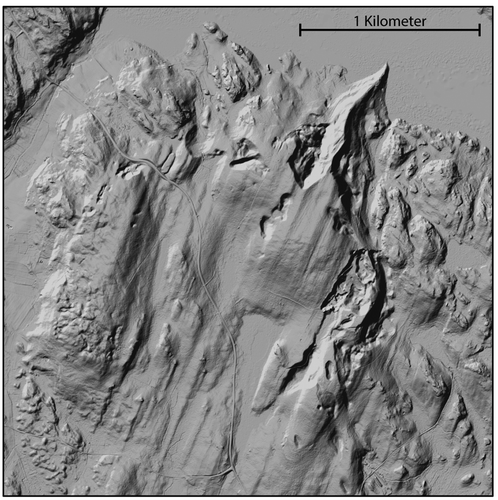
Fig. 3. Esker at Asikkala N of Lahti, southern Finland, overriden by a later glacial advance from NNE. Illumination from NW.
De Geer moraines (DGM) have been reported from Sweden, Finland and Norway and are observable on some topographic maps, in the field and in aerial photos. But the LiDAR DEMs surpass all of these other sources in revealing Scandinavia’s DGMs (Fig. C). National databases have begun to be established for DGMs in Finland and Sweden. In this issue, a new map showing a nation-wide distribution of DGMs in Sweden is presented by Bouvier et al. (Citation2015). These authors stress that though DGMs can be formed in a number of ways (they are equifinal), but they are most commonly represented by evenly spaced, lateral extensive, 2–5-m high ridges that most likely are formed annually, reaffirming De Geer’s (Citation1940) suggesting of their annual formation. In Finland, Ojala et al. (Citation2015) and Ojala (Citationsubmitted) show the DGM distribution in Finland where they reveal, as in Sweden, that the moraines occur in swarms below the highest shoreline. They also show quite clearly, that regularly spaced DGMs formed in deeper water have greater spacings than those in shallow water, implying that ice-retreat rates were faster in deeper water.
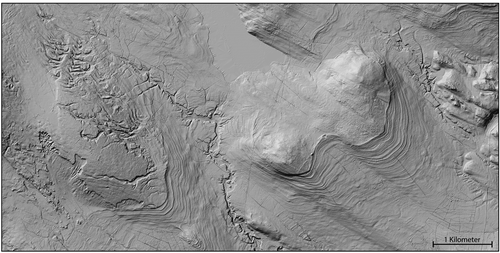
The location of the highest shoreline following deglaciation has been a subject of great importance historically; however, it has often been difficult to convincingly find the erosional evidence (wave-cut scarps, wave-washed landforms) or depositional evidence (minor deltas, beach ridges (Fig. B), to precisely determine its elevation. Now, the highest shoreline can be clearly seen in many of the LiDAR DEMs (Fig. ). Many more highest shoreline and other ancient shoreline locations of the Baltic Sea basin can now be found and mapped, and it is possible to create a shoreline-observation database with much greater detail, as shown by Ojala et al. (Citation2013) in Finland. And this allows for reconstructing a more detailed history of the shoreline displacement, isostacy and eustacy following the last glaciation.
Fig. 4. LiDAR image covering an area N of Boliden northern Sweden with the highest coastline clearly visible with beach ridges in lower terrain and glacially lineated till at higher terrain. In the western part a landslide in till and lateral meltwater channels have been eroded by wave action. In the valley bottoms ravines are visible. Illumination from NW.
Fluvial features show up clearly on the new LiDAR DEMs (Fig. (E)). Eilertsen et al. (Citation2015) show how LiDAR helps illuminate the differences between fluviodeltaic terraces, formed in stream valleys during isostatically driven regression of the sea, and those fluvial terraces that have formed afterward by gradual incision. They show these features not only differ in elevation, but in their detailed surface morphology.
Post-glacial fault scarps (PGFs) (landforms with relief created by late- and/or post-glacial fault movement) show up sharply on the new LiDAR DEMs and many new scarps have been discovered, as documented in three articles in this issue (for example, Fig. D). Mikko et al. (Citation2015) show an up-to-date inventory of all known fault scarps in Sweden; many of these have been known previously from aerial photographs, but completely new scarps have been discovered. One of these, near Bollnäs, Sweden, is described in detail by Berglund and Dahlström (Citation2015). Mikko et al. (Citation2015) describe a Swedish database for these features. An exciting affirmation of these finds is that it is clear that many of these fault scarps are PGFs and formed during a time of more rapid isostatic uplift following deglaciation. Finland has also created a growing database with previously known and newly found observations of PGFs, which are described by Palmu et al. (Citation2015). They show clearly, through cross-cutting relationships, that these scarps are PGFs, but equally important that many scarps are associated with landslide features, which occurred contemporaneous with, and were generated by the same seismic activities that caused faulting.
Alpine environments with glacial and periglacial processes are vulnerable to changes brought on by current climate changes. To document these changes, baseline elevation data are important. Carrivick et al. (Citation2015), present a LiDAR analysis of the famous Tarfala valley in northern Sweden. They identify landforms but more importantly have set up a baseline that can be used in the future to quantify on-going changes.
Bedrock structure revealed
In addition to the greater visibility of fault scarps, structural features such as fractures, fissures and other lineaments show up dramatically in the new LiDAR images. Fracture patterns illuminate the structural history of Scandinavia’s predominantly crystalline bedrock. Scheiber et al. (Citation2015) show that LiDAR images can be analyzed in GIS to pick up and quantify lineament orientations. As of yet, bedrock geologists have not used LiDAR data to a great extent, but the geomorphic expression of structure as revealed by LiDAR will yield large amounts of new data, and will allow contacts between bedrock complexes to be drawn in better detail. Additionally, the combination of airborne geophysical data and LiDAR DEMs yields great possibilities in differentiating geophysical anomalies.
LiDAR images and regional geologic and geomorphic understanding
In addition to the “mesoscale” landforms mentioned above, the LiDAR DEMs also show in greater detail previously known landforms, such as end moraines, drumlins, eskers and other glacial and post-glacial landforms. Collectively, these new data allow geomorphologists to re-evaluate and improve our observations on regions of Scandinavia with the full expectation that the new information will reveal deeper insights into landscape development, which will lead not only to resolution of long-standing problems, but also new interpretations.
This issue includes three papers that fall into this category. Möller and Dowling (Citation2015) review the glacial development of a large portion of southern Sweden (Småland) that is characterized by large areas of streamlined terrain as well as patches of hummocky landforms. Through cross-cutting relationships, the LiDAR hillshaded figures have revealed the geomorphic relationship among the various landforms. Because some of these forms require warm-based conditions and others cold-based, they are able to show an evolution of thermal bed regime during deglaciation.
Greenwood et al. (Citation2015) show how the new LiDAR data combined with similar topographic information from the Baltic Sea floor (derived from side-scan sonar) can give a complete picture of the subglacial topography of the Scandinavian Ice Sheet. Specifically, they are able to identify distinct ice streams operating within the ice sheet during deglaciation. Their paper and the paper by Möller and Dowling show how these new data can provide a deeper insight into the dynamics of the ice sheet during deglaciation.
Sarala et al. (Citation2015) show that mapping with LiDAR DEMs in northern Finland allows not only distinguishing of different geomorphic surfaces with greater accuracy, but also the recognition of till-covered deposits from early Weichselian glaciations.
LiDAR at the geological surveys in Scandinavia
The availability of new LiDAR DEM data has changed the procedure of geomorphological and geological mapping in Scandinavia. In general, LiDAR DEMs provide not only a tool for mapping that is exceptional in quality, it also make mapping quicker and less expensive. Nowadays, few mapping projects are started without adequate LiDAR coverage, and this includes bedrock mapping as well as surficial deposits. It is in part an economic question in that the surveys simply cannot warrant the extra time expenditure and lower quality of work that is the result of lacking LiDAR data. High quality aerial photography still has an important role, particularly in mapping of slope and organic deposits.
Several years of experience from the geological surveys shows several benefits of using LiDAR data that both increase map quality and reduce mapping time. One important reason why LiDAR data have become an indispensible tool is that these data conveniently can be used in a digital mapping environment. At all surveys the last decade has meant that geologists have gone from mapping largely using analog tools, printed aerial photographs and paper manuscript maps, to a workflow where the primary observations are made digitally in the field and in office. The use of digital aerial photographs in 3D requires expensive and complicated hardware and software, and LiDAR thus significantly aids in digital data capture.
Delimiting different deposits can be done with better precision and in shorter time using LiDAR data. Before the LiDAR revolution, this was done through field check, and then largely tying the units together using aerial photographs. This inherently meant lower precision and educated guesses in densely forested areas. With LiDAR data, boundaries between units, for example between a glaciofluvial deposit and till, can be digitized with a very high degree of precision. Because LiDAR essentially can strip away forest and vegetation, this also means that mapping now becomes more consistent. The previous workflow, using aerial photographs, meant that densely vegetated areas in reality were mapped with lower precision compared to sparsely vegetated areas.
Fieldwork time is expensive for the surveys. LiDAR data save time by allowing a thorough check of the geology before fieldwork, where key sites can be identified for further field investigations, leaving less important areas to be covered in shorter time. In all, mapping quality at the surveys has gone up while at the same time the mapping projects are completed faster and cheaper. For example, NGU estimates that their basic Quaternary maps (covering ~700 km2) at the scale of 1:50 000 now essentially are of a quality corresponding to 1:35 000, while at the same time being completed 20–40% faster than before.
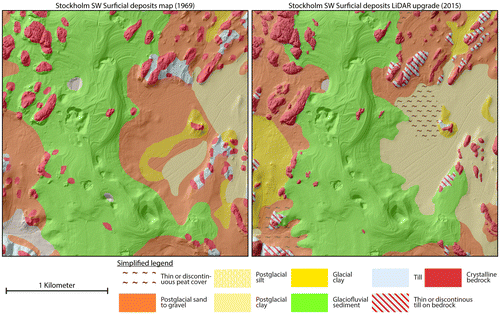
LiDAR is also used at the surveys to update older Quaternary maps (Fig. ), especially around the major population centers. Wrongly identified unit boundaries, and areas with insufficient resolution of surficial deposits on older maps can be enhanced and corrected by the better view provided by the LiDAR DEMs. This shows that LiDAR DEM studies can provide significant gains for society and using limited resources. The quality of maps is clearly enhanced without spending much time and fieldwork effort.
Fig. 5. Geologic maps from SW of Stockholm, Sweden, that have been remapped using LiDAR data.
However, there are still situations which require caution. For example, some slope deposits are difficult to distinguish from till in the LiDAR model. In this case, infrared aerial photographs are still invaluable. Additionally, some organic soils, e.g., blanket peat, appear like bare bedrock or discontinuous till in the LiDAR. Regardless of the project, field checking is still essential!
Bedrock geologists have not adopted LiDAR to a large extent yet. Some structural geologists are interested in mapping bedrock lineaments (see publication by Scheiber et al. Citation2015). Geophysicists are increasingly using LiDAR DEMs to do topographic corrections of aerial gravimetric and magnetic data.
Norway
LiDAR coverage is still patchy in Norway (see Fig. ). The scans are ordered and organized by “Statens kartverk” (www.statkart.no) but the actual missions are flown by private companies. So far, densely populated areas where there is human activity, mainly below the tree limit, have been flown. The Geological Survey of Norway (NGU) has had only limited influence in determining where to fly LiDAR missions. However, many interesting areas in low-lying terrain, including most areas below the marine limit are covered. Also, scientifically interesting areas along the coasts, covering the deglaciation and the Younger Dryas ice-margin limit are mostly covered. In October 2015, the Norwegian government decided that most of Norway should by covered by LiDAR data within 4–5 years. Higher terrain (i.e., above tree limit and above economical interest) will not be covered by true LiDAR data, but high quality aerial photograph triangulation will substitute in these areas.
NGU is also completing an update of the Quaternary map of Trondheim using LiDAR data. These new maps are able to much better constrain areas with marine (and potentially unstable) clay, which is of major concern in Trondheim. It is fast and easy to see the boundary between marine clay and till/bedrock outcrops, and the precision is much higher compared to the older map compiled using aerial photography and field surveys
Finland
LiDAR DEM information has been applied in surveying and mapping of Quaternary geology in Finland since 2007. LiDAR point cloud data are provided by the National Land Survey of Finland and are processed at the Geological Survey of Finland (GTK) with ArcGis (© ESRI) software. Online maps of superficial deposits and bedrock with LiDAR-based hillshaded elevation data are available at http://gtkdata.gtk.fi/Maankamara/index.html. The Finnish geoscientific spatial data products can also be searched for and downloaded from the Hakku service (http://hakku.gtk.fi), allowing their use in geographical information systems. The LiDAR DEMs are typically enhanced with the multidirectional hillshading for better visualization of geological features. This increased and improved DEM information is then used in mapping of Quaternary geology of new areas as well as areas already mapped for superficial deposits in order to enhance their mapping resolution and accuracy. The more detailed mapping concerns urban areas, in particular, where increasing resolution of geological information is needed for land-use planning and construction (e.g., Kielosto et al. Citation2012; Nuotimäki & Jarva Citation2015). Such mapping process emphasizes more on remote sensing and interpretation and less on arduous and expensive fieldwork, thus making it more efficient. An extensive use of other available geological and geophysical information with LiDAR DEMs in Quaternary mapping allows focusing of field investigations to the most rational and appropriate locations. In addition to production of Quaternary geological maps (e.g., Kielosto et al. Citation2012; Räisänen Citation2014; Ala-Ilomäki et al. Citation2015), there are numerous other applications where high-resolution LiDAR DEMs have been exploited to map and investigate specific geological and geomorphological features in Finland. Among these are (i) mapping of ancient shorelines of the BSB (Ojala et al. Citation2013), (ii) identification of post-glacial faults (e.g., Sutinen, Hyvönen, Middleton, et al. Citation2014; Palmu et al. Citation2015), (iii) detection of palaeolandslides and subglacial morphological features related to seismic activity, such as glaciofluvial rearrangements and Pulju moraines (e.g., Sutinen et al. Citation2009; Sutinen, Hyvönen, & ja Kukkonen Citation2014) (iv) mapping of De Geer and other types end moraines (Ojala et al. Citation2015; Ojala Citationin press), (v) classifying characteristics of fine-grained deposits and sedimentary basins in southern Finland (e.g., Ojala Citation2011), (vi) mapping and surveying of peat resources (e.g., Laatikainen et al. Citation2011), (vii) mapping of eskers for glacier dynamics, use of aggregate resources and structural surveys of groundwater areas (e.g., Ahonen & Valjus Citation2014), (viii) characterization of Quaternary geology for geochemical exploration (e.g., Sarala & Sarapää Citation2013) and (ix) hydrostratigraphical modeling in supporting safety of a mining environment (Howett et al. Citationin press).
Sweden
LiDAR data in Sweden began to be collected in 2009 by the Swedish mapping, cadastral and land registration authority and nearly the entire country is now measured (Fig. ) (Lysell Citation2013). At the Swedish Geological Survey (SGU), LiDAR data is used as the primary base map for mapping of surficial deposits, and it has have proved to be extremely useful in correcting older maps by being able to more finally adjust surface contacts. Around Stockholm, the older surface deposits maps have been corrected and upgraded (Fig. ), an area covering 2500 km2 and are accessible through SGU:s databases. The upgrading of older maps/databases greatly increases the usability of the data. For example, GIS analyses performed in society are since the advent of LiDAR based on detailed DEM:s and as a consequence the geological data have to be of similar quality to yield best possible results.
However, the LiDAR data is not only used in mapping of surface deposits but have been used in several special applications. SGU, together with Uppsala University and the Swedish geotechnical institute, has developed an algorithm to find areas with possible landslide hazards that greatly benefit from detailed DEMs. This model not only finds where unstable sediments and steep slopes occur, it also calculates how far the landslide would progress (Tryggvason, Melchiorre, & Johansson Citation2014) and is available as a landslide susceptibility database from SGU. Moreover, hydrogeologists use detailed DEMs in their primary work making it easier to delineate esker crests, aquifers and watersheds.
The marine geologists at SGU have been using Green-laser LiDAR to compliment investigations to get bathymetry data in near-shore regions and to connect the terrestrial and marine geological databases (Malmberg Persson et al. Citation2014). Finally, SGU is using the LiDAR derived DEMs in many more projects including work with 3D geological modeling (Peterson et al. Citation2014), Quaternary geomorphologic databases (Peterson & Smith Citation2013), the mapping of landslides and gullies, as support when mapping bedrock lineaments and as a primary information in many referrals about geological questions from county and municipality boards, private companies and other government agencies.
Acknowledgements
Thanks to Henrik Mikko, Geological Survey of Sweden, for providing examples of how LiDAR has helped to improve surficial-deposit maps.
References
- Ahonen, J. & Valjus, T., 2014: Pohjavesialueen geologisen rakenteen selvitys Hämeenkangas-Niinisalon pohjavesialueella Kankaanpäässä [Structural geology of the Hämeenkangas-Niinisalo aquifer in Kankaanpää]. Geological Survey of Finland, Report 107/2012, 19 pp. (in Finnish).
- Ala-Ilomäki, J., Cohen, J., Heilimo, J., Hyvönen, E., Hänninen, P., Ikonen, J., Middleton, M., Nevalainen, P., Pahikkala, T., Pohjankukka, J., Pulliainen, J., Riihimäki, H., Sutinen, R., Tuominen, S. & Varjo, J., 2015: New computational methods for efficient utilisation of public data. Geological Survey of Finland, Report of Investigation 217, 55 pp.
- Berglund, M. & Dahlström, N., 2015: Post-glacial fault scarps in Jämtland, Central Sweden. GFF 137, 339–343.
- Boulton, G.S. & Clark, C.D. 1990: A highly mobile Laurentide ice sheet revealed by satellite images of glacial lineations. Nature 346, 813–817.10.1038/346813a0
- Bouvier, V., Johnson, M.D. & Påsse, T., 2015: Distribution, genesis and annual-origin of de Geer Moraines in Sweden: Insights revealed by LiDAR. GFF 137, 119–333.
- Carrivick, J.L., Smith, M.W., Carrivick, D.M., 2015: Terrestrial laser scanning to deliver high-resolution topography of the upper Tarfala valley, arctic Sweden. GFF 137, 383–396.
- De Geer, G., 1940: Geochronologia Suecica principles, Kungl. Svenska Vetenskapsacademiens handlingar, 3rd Series, Band 18, No. 6, 367 pp.
- Eilertsen, R., Corner, G., and Hansen, L., 2015: Using LiDAR data to characterize and distinguish between different types of raised terraces in a fjord-valley setting. GFF 137, 353–361.
- Greenwood, S.L., Clason, C.C., Mikko, H., Nyberg, J., Peterspon, G. & Smith, C.A., 2015: Integrated use of LiDAR and multibeam bathymetry reveals onset of ice streaming in the northern Bothnian Sea. GFF 137, 284–292.
- Howett, P.J., Salonen, V-P., Hyttinen, O., Korkka-Niemi, K. & Moreau, J., in press: A hydrostratigraphical approach to support environmentally safe siting of a mining waste facility at Rautuvaara, Finland. Bulleting of the Geological Society of Finland.
- Kielosto, S., Saresma, M. & Ikävalko, O., 2012: Maaperätiedon keruun kokeilu yhdyskuntarakentamista varten Helsingin Östersundomin alueella [Developing urban mapping of Quaternary deposits for land use planning and construction in Östersundom, Helsinki]. Geological Survey of Finland, Report 70/2012, 22 pp. (in Finnish).
- Laatikainen, M., Leino, J., Lerssi, J., Torppa, J. & Turunen, J., 2011: A new approach for peat inventory methods.Geological Survey of Finland. Report of Peat Investigation 414, 128 pp.
- Lysell, G., 2013: 2013: Ny Nationell Höjdmodell, NNH. Lantmäteriets nyhetsbrev 1, 1–2.
- Malmberg Persson, K., Nyberg, J., Ising, J. & Persson, M., 2014: Skånes känsliga stränder – ett geologiskt underlag för kustzonsplanering och erosionsbedömning [ Skåne’s sensitive coast—a geological description for coastal management and erosion control]. Geological Survey of Sweden, Report 2014:20, 30pp.
- Mikko, H., Smith, C.A., Lund, B., Ask, M.V.S. & Munier, R., 2015: Li-DAR-derived inventory of post-glacial fault scarps in Sweden. GFF 137, 334–338.
- Möller, P & Dowling, T.P.F., 2015: The importance of thermal boundary transitions on glacial geomorphology; mapping of ribbed/hummocky moraine and streamlined terrain from LiDAR, over Småland, South Sweden. GFF 137, 252–283.
- Nuotimäki, K. & Jarva, J., 2015: A qualitative approach for identifying areas prone to urban floods with the support of LiDAR. GFF 137, 373–382.
- Ojala, A.E.K., 2011: Construction suitability and 3D architecture of the fine-grained deposits in southern Finland – examples from Espoo. Geological Survey of Finland, Special Paper 49, 126–136.
- Ojala, A.E.K., in press: Appearance of De Geer moraines in southern and western Finland – implications for reconstructing glacier retreat dynamics. Geomorphology. http://dx.doi.org/10.1016/j.geomorph.2015.12.005
- Ojala, A.E.K., Palmu, J.-P., Åberg, A., Åberg, S. & Virkki, H., 2013: Development of an ancient shoreline database to reconstruct the Litorina Sea maximum extension and the highest shoreline of the Baltic Sea basin in Finland. Bulletin of the Geological Society of Finland 85, 127–144.
- Ojala, A.E.K., Putkinen, N., Palmu, J.-P. & Nenonen, K., 2015: Characterization of De Geer moraines in Finland based on LiDAR DEM Mapping. GFF 137, 304–318.
- Palmu, J.-P., Ojala, A.E.K., Ruskeeniemi, T., Sutinen, R. & Mattila, J., 2015: LiDAR DEM detection and classification of postglacial faults and seismically-induced landforms in Finland: A paleoseismic database. GFF 137, 344–352.
- Peterson, G., Jirner, E., Karlsson, C. & Engdahl, M., 2014: Tredimensionella jordartsmodeller - programvara och metoder [ Three-dimensional surface-deposit models—software and methods]. Geological Survey of Sweden, Report 2014:33, 18 pp.
- Peterson, G. & Smith, C.A., 2013: Description of units in the geomorphic database of Sweden. Geological Survey of Sweden, Report 2013:04, 18 pp.
- Räisänen, J., 2014: Sodankylän alueen maaperäkartoitus 2013–2014 (Väliraportti) [Quaternary mapping of the Sodankylä region in 2013–2014 (preliminary report)]. Geological Survey of Finland, Report 52/2014, 22 pp. (in Finnish).
- Sarala, P., Räisänen, J., Johansson, P., and Eskola, K.O., 2015: Aerial LiDAR analysis in geomorphological mapping and geochronological determination of surficial deposits in the Sodankylä region, northern Finland. GFF 137, 293–302.
- Sarala, P. & Sarapää, O., 2013: Rare earth element and gold exploration in glaciated terrain – example from the Mäkärä area, Northern Finland. Geochemistry Exploration Environment Analysis 13, 131–143.
- Scheiber, T., Fredin, O., Viola, G., Jarna, A., Gasser, D. & Łapinska-Viola, R., 2015: Manual extraction of bedrock lineaments from high resolution LiDAR Data: Methodological bias and human perception. GFF 137, 362–372.
- Sutinen, R., Hyvönen, E., Middleton, M. & Ruskeeniemi, T., 2014: Airborne LiDAR detection of postglacial faults and Pulju moraine in Palojärvi, Finnish Lapland. Global and Planetary Change 115, 24–32.10.1016/j.gloplacha.2014.01.007
- Sutinen, R., Hyvönen, E. & ja Kukkonen, I., 2014: LiDAR detection of paleolandslides in the vicinity of the Suasselkä postglacial fault, Finnish Lapland. International Journal of Applied Earth Observation and Geoinformation 27, 91–99.10.1016/j.jag.2013.05.004
- Sutinen, R., Piekkari, M. & Middleton, M., 2009: Glacial geomorphology in Utsjoki, Finnish Lapland proposes Younger Dryas fault-instability. Global and Planetary Change 69, 16–28.10.1016/j.gloplacha.2009.07.002
- Trygvason, A., Melchiorre, C. & Johnsson, K. 2014: A fast and efficient algorithm to map prerequisites of landslides in sensitive clays based on detailed soil and topographical information. Computers & Geosciences 75, 88–95.