
ABSTRACT
Background: Critical illness is associated with modification in metabolic status. Insulin resistance and elevated blood glucose levels occur during stressful conditions. We aimed to evaluate the incidence and outcome of glucose intolerance in intensive care patients.
Material and methods: This prospective clinical study included 290 patients, admitted to the intensive care unit (ICU). They were divided into three groups according to the maximum blood glucose level on admission and after 48 hours of admission: Normoglycemic, hyperglycemic, and hypoglycemic. Each group was subdivided into diabetic and non-diabetic. Patients’ age, sex, APACHE II, and causes of admission were recorded. Use of vasopressor and corticosteroid therapy, type of feeding, days on mechanical ventilation, total days of stay in ICU, and fate of patients were recorded.
Results: Hyperglycemia was common in critically ill patients with 68.6% and 86.2% incidence on ICU admission and after 48 hours of admission, respectively. Sixty percent of the patients were diabetic. Hyperglycemia was associated with increased morbidity in the form of difficult weaning from mechanical ventilation and long ICU stay. Of hyperglycemic patients, 66.4% were orally fed. The mortality incidence among normoglycemic patients was 37.5%; which was lower than the mortality among hyperglycemic patients (39.2%), but without a statistically significant difference. Glucose intolerance was not related to the severity of the disease or cause of admission. Vasopressors and steroids were not risking factors during the initial 48 hours of admission.
Conclusion: Glucose intolerance is high in intensive care patients and is associated with high morbidity and mortality.
1. Introduction
Glucose homeostasis is important for cellular function. Several hormones are involved in glucose metabolism and maintenance of normoglycemia, which reflects the balance between the ability to stimulate glucose disposal and simultaneously suppress endogenous glucose production. This is determined by three factors: insulin sensitivity, glucose effectiveness, and insulin secretion [Citation1]. Various organs contribute to glucose metabolism, and body metabolism is adapted during fasting to decrease global glucose disposal [Citation2].
Critical illness activates the hypothalamic-pituitary-adrenal axis, resulting in the release of cortisol, which stimulates gluconeogenesis and decreases glucose utilization. Other hormones (glucagon, catecholamines, and growth hormone) are also released and stimulate insulin resistance through lipolysis of adipose tissue, skeletal muscle proteolysis, and hepatic gluconeogenesis. These processes impair glucose utilization in peripheral tissues, increase circulating free fatty acids, and stimulate gluconeogenesis and glycogenolysis. Exogenous factors (parenteral and enteral nutrition, vasopressors, glucose infusions, and corticosteroids) exacerbate hyperglycemia [Citation3].
Glucose intolerance frequently occurs in the critically ill, in both diabetics, and those who were previously glucose-tolerant. The term “stress hyperglycemia” reflects the pathogenesis of the latter group [Citation4]. Stress hyperglycemia is defined as an increase in blood glucose above 200 mg/dl in presence of acute illness, without previously diagnosed diabetes [Citation3].
The target blood glucose level in the Intensive Care Unit (ICU) is recommended to be from 140 to 180 mg/dl, not tight control (80–110 mg/dl) or liberal range (180–200 mg/dl) [Citation5]. Blood glucose value for hyperglycemia differs in studies [Citation6]. A plasma glucose concentration <70 mg/dl is the most common threshold used to define hypoglycemia. In critically ill patients, the diagnosis of hypoglycemia seems to be a challenge as glucose analyzers are habitually not consistent at the low ranges of blood glucose, and hypoglycemia-related neurological signs may be masked. More important, hypoglycemia in critical illness, especially severe hypoglycemia, is associated with a poor prognosis without clear identification of the reason for this higher mortality [Citation7].
This research aimed to evaluate the incidence and outcome of glucose intolerance in intensive care patients.
2. Material and methods
After approval of the faculty ethical committee, we conducted this prospective observational study on 290 critically ill patients, admitted to ICU to evaluate random blood glucose concentration on ICU admission, in addition to peak glucose concentration (defined acute hyperglycemia) on initial 48 hours of ICU admission. The study was conducted in both EL-Zaitoun and Sidnawy health insurance hospitals, Cairo, Egypt. The study included patients admitted to ICU, from December 2018 to January 2020. Written informed consent was taken from patients or their legal guardians.
We included patients with symptoms of acute illness and decided to be admitted to ICU as assessed by the Modified Early Warning Score (MEWS) algorithm. Patients were more than 18 years old and the period of stay in ICU for more than 24 hours. Patients less than 18 years old, stay period less than 24 hours, and patients with relative’s refusal were excluded.
Patients involved in the study were divided into three groups according to the highest blood glucose level on admission and during the initial 48 hours of admission into normoglycemic, hyperglycemic, and hypoglycemic. Each group was subdivided into diabetic and non-diabetic. The following data were obtained: age, gender, APACHE II score, admission diagnosis, blood glucose level every 6 h. The highest blood glucose level during the first 48 hours of admission more than 140 mg/dl was used to define acute hyperglycemia; with mild hyperglycemia 140–180 mg/dL, moderate hyperglycemia 180–200 mg/dL, and severe hyperglycemia >200 mg/dL. Vasopressor and corticosteroid therapy, type of feeding, days on mechanical ventilation, total days of ICU stay, and outcome of patients were also recorded. Insulin infusion was ordered for patients of diabetic ketoacidosis (DKA) otherwise subcutaneously according to a sliding scale every 6 h. All these data were collected and compared between the three groups of patients.
2.1. Sample size justification
Sample size justification was calculated using MedCalc® version 12.3.0.0 program “Ostend, Belgium” statistical calculator based on 95% confidence interval and power of the study 80% with α error 5%. According to a previous study (Godinjak et al., 2015) [Citation8], the overall prevalence of patients with hyperglycemia was 54% (35% with diabetes mellitus and 19% with stress hyperglycemia), while the mean of glycemic variability (mmol/l) in diabetes mellitus 7.5 versus stress-hyperglycemia 9.3, with significant p-value (<0.05). Also, outcome mortality in diabetes mellitus was 17 (48.6%) versus 10 (52.6%) in stress-hyperglycemia, with stress-hyperglycemia p-value (<0.05) significant. Again, recovery in diabetes mellitus was 18 (51.4%) versus 9 (47.4%) in stress-hyperglycemia, with significant p-value (<0.05). So, it can be relied upon in this study. The sample size calculated according to these values produced a minimal sample size of 276 cases to find this difference. Assuming a drop-out ratio of 5%, the sample size was 290 cases.
2.2. Statistical analysis
IBM SPSS statistics (V. 26.0, IBM Corp., USA, 2019) was used for data analysis. Data were expressed as median and percentiles for quantitative nonparametric measures and both number and percentage for categorized data. The following tests were done:
Comparison between two independent groups for non-parametric data using the Wilcoxon Rank Sum test.
Comparison between more than 2 patient groups for non-parametric data using the Kruskal Wallis test.
Chi-square test to study the association between every two variables or comparison between two independent groups as regards the categorized data. The probability of error at 0.05 was considered significant, while at 0.01 and 0.001 are highly sig.
3. Results
This prospective observational clinical study included 290 critically ill patients. On admission, our study revealed that 83 patients (28.6%) were normoglycemic while the remaining 207 patients (71.4%) showed glucose intolerance on ICU admission most of them were hyperglycemic (199 patients representing 68.6%) while the remaining were hypoglycemic (8 patients representing 2.8%). The hyperglycemic group on admission was subdivided into mild, moderate, and severe groups representing 55 patients, 12 patients, and 132 patients, respectively ().
Figure 1. A flowchart of the study population
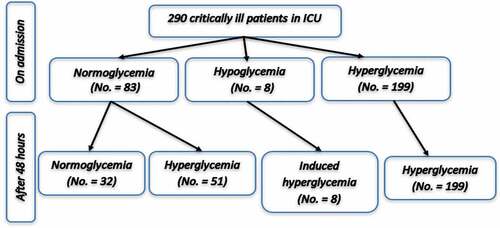
After 48 hours of admission and according to the peak of glucose level, the eight hypoglycemic patients on admission became hyperglycemic (Induced hyperglycemia). Also, some cases from the normoglycemic patients and mild hyperglycemic patients on admission developed either moderate or severe hyperglycemia. So, after 48 hours of admission, normoglycemic patients became 32 patients (11%) while the hyperglycemic patients became 250 patients (). Forty-seven patients were non-diabetic and showed severe hyperglycemia representing stress hyperglycemia ().
Table 1. Distribution of known diabetic and non-diabetic patients involved in the study according to the glucose level on admission and the peak glucose level at 48 h of admission
Overall, 199 were males while 91 were females showing no statistically significant difference between the different study groups either on admission or after 48 hours of admission with P-value = 0.764 and 0.690, respectively. The diabetic patients represented 60% of the patients, while the rest 40% of the involved patients were non-diabetic. About the factors that may be associated with glucose intolerance on ICU admission or after 48 hours, our results revealed that diabetes showed a statistically significant correlation with glucose intolerance (). Forty-five patients needed insulin infusion as they suffered from Diabetic Keto Acidosis (DKA), 213 patients needed insulin subcutaneous according to the sliding scale and only 32 patients did not use insulin ever.
No significant statistical relation was found between glucose intolerance on admission or peak glucose level during 48 hours and age or APACHE II score (). Also, no statistically significant difference was found between different groups as regards the smoking history and the cause of admission.
Table 2. Kruskal–Wallis test and Wilcoxon rank-sum test for comparison between different groups of glucose intolerance on admission with age, APACHE II score and days of mechanical ventilation and ICU stay
Table 3. Kruskal–Wallis test and Wilcoxon rank-sum test for comparison between different groups of glucose intolerance on peak glucose level during 48 h of admission with age, APACHE II score, days of mechanical ventilation, days of ICU stay, days on steroid, and days on circulatory support
There was no significant correlation between glucose intolerance and the days of mechanical ventilation or days of stay in the ICU (). But, moderate hyperglycemia on admission (180–200 mg/dl) was associated with a significantly prolonged stay on mechanical ventilation in comparison to normoglycemic, mild hyperglycemic (140–180 mg/dl), and sever hyperglycemic (>200 mg/dl) patients on admission (). According to the peak of glucose level on 48 h of admission, moderate and severe hyperglycemia was related to significantly prolonged stay in ICU in comparison to the normoglycemic group ().
A statistically significant difference was found between the type of feeding among our study groups with oral fed patients were the commonest. 166 patients of the total of 250 hyperglycemic patients (i.e., 66.4%) were orally fed ().
Table 4. Distribution of patients involved in the study according to the peak of glucose level at 48 h of admission concerning the type of feeding
Regarding mortality, no statistically significant difference was found between the mortality and the glucose level on admission or at 48 hours. However, on admission or after 48 hours, the highest mortality incidence was found among moderate hyperglycemic patients (66.7% and 54.5%, respectively) ().
Table 5. The relation between the patients’ mortality and the glucose level on admission and the peak of glucose level at 48 h of admission
4. Discussion
Our study was carried out randomly on 290 patients admitted to ICU from December 2018 to January 2020. Patients were already diagnosed as having a critical illness of various causes. There is no standard blood glucose value for hyperglycemia [Citation6]. Hence, in our study, we considered hyperglycemia >140 mg/dl. It was classified by the American Diabetes Association 2009 as mild hyperglycemia 140–180 mg/dL, moderate hyperglycemia 180–200 mg/dL, and severe hyperglycemia >200 mg/dL [Citation5]. In our study, patients who developed hyperglycemia during the initial 48 hours of admission were 250 patients (86.2%); 33 of them were mild hyperglycemia, 22 were moderate hyperglycemia and 195 were severe hyperglycemia. This is consistent with the results of Casillas et al., 2019 study in which 50%-85% of patients admitted to ICU had severe hyperglycemia [Citation9].
Concerning the relation between hyperglycemia detected after 48 hours of admission and diabetes; 250 patients were hyperglycemic (86.2% of the study population), 65.2% of them were diabetic. Only 87 patients were hyperglycemic and non-diabetic (i.e., stress hyperglycemia). In Godinjak et al. study [Citation8], the incidence of hyperglycemia was 54%, of them, 35% were diabetic and 19% were stress hyperglycemia. This difference may be due to the small sample size in Godinjak et al. study (100 patients), in comparison to 290 patients in our study. The incidence of stress hyperglycemia was 64% among 50 ICU patients in Temel et al. [Citation6] study, whereas in Cely et al. [Citation10], the incidence of hyperglycemia was 23% in 100 medical ICU patients. However, their study determined hyperglycemia depending on blood glucose levels during the first 5 days of admission, but our study used peak blood glucose levels during the first 48 hours of admission.
Concerning association with steroid usage, our study did not detect a statistically significant association between glucose levels and steroid use. But, in Donihi et al.’s study [Citation11], hyperglycemia was a common complication of steroid therapy. This might be because, in Donihi et al. [Citation11], patients received high doses of steroids (40 mg/day of prednisone or equivalent) for at least 2 days. Also, in our study, the effect of steroids on glucose level might appear later after our study period (initial 48 h of admission). Regarding association with circulatory supports, there was no statistically significant correlation between glucose levels and usage of circulatory supports as norepinephrine. This might be because norepinephrine plays a little role in increasing plasma glucose levels [Citation12].
Concerning mortality as a primary outcome, 39.2% of patients who developed hyperglycemia, and 37.5% of patients with normoglycemia died. Our study did not detect a statistically significant association between hyperglycemia and mortality. Marik and Bellomo [Citation13] revealed that acute illness-induced hyperglycemia was an adaptive response that increased the host’s chances of survival. Many trials in critically ill patients [Citation14–16] failed to show significant improvement in mortality with intensive glycemic control. Moreover, mortality risk increased with tight glycemic control [Citation17,Citation18]. In a meta-analysis including 13,567 critically ill patients, Griesdale et al. [Citation19] found a favorable effect of intensive insulin therapy (IIT) on mortality only among surgical ICU patients, but there was a sixfold rise in the incidence of hypoglycemia with IIT in all ICU patients.
Also, inconsistency with our study, Green et al. [Citation20] found that stress hyperglycemia was not predictive of mortality in adults with sepsis after correction of blood lactate levels. Moreover, Tiruvoipati et al. [Citation21] revealed that patients admitted with septic shock and developed stress hyperglycemia had significantly lower mortality than patients with normal blood glucose levels, indicating that hyperglycemia is an adaptive response for survival. Cichosz and Schaarup [Citation22] found that hyperglycemia is predominant in ICU and non-diabetic patients, and it is strongly associated with mortality. Also, hyperglycemia in patients with acute myocardial infarction (AMI) was associated with increased mortality [Citation23–27]. But, our study did not detect a statistically significant difference in mortality between different groups of glucose levels and in patients with AMI. This might be attributed to population types or sample size.
In our study, the incidence of hypoglycemia on admission was 2.75% but no patient was hypoglycemic during the initial 48 hours of admission, suggesting that hypoglycemia can be an avoidable event in ICU by close monitoring of blood glucose level especially with patients on an insulin infusion. Moreover, patients who were hypoglycemic on admission became hyperglycemic; which might be secondary to a 25% glucose infusion to correct their hypoglycemia on admission.
Concerning secondary outcomes, hyperglycemic patients had a statistically significant longer period on mechanical ventilation and ICU stay than others. This is in agreement with Temel et al. [Citation6] and Callahan and Supinski [Citation28] who revealed that hyperglycemia was a risk factor for ICU-acquired weakness that prolonged the duration of mechanical ventilation. Also, Becker et al. [Citation29] found that suboptimal hyperglycemic control (>180 mg/dl) during ICU stay was significantly associated with increased ICU and hospital stay.
5. Conclusion
The incidence of hyperglycemia was high on ICU admission and after 48 hours, and it was more common in diabetics. Glucose intolerance in critically ill patients was not related to associated diseases or the cause of admission. Vasopressors and steroids were not risking factors for glucose intolerance during the initial 48 hours of admission. Hyperglycemia was associated with increased duration of mechanical ventilation and total days in the intensive care unit. There was no significant difference between normoglycemic and hyperglycemic patients regarding the incidence of mortality.
5.1. Limitations and recommendations of our study
The relatively small number of patients could limit the strength of results and conclusions obtained from this study. Also, the study involved only two centers. So, the effects of other population types were not evaluated. We recommend doing more studies in different centers and different populations so that we can extrapolate the results.
Disclosure statement
No potential conflict of interest was reported by the authors.
References
- Kowalski GM, Bruce CR. The regulation of glucose metabolism: implications and considerations for the assessment of glucose homeostasis in rodents. Am J Physio Endocrinol Metab. 2014;307(10):E859–E871.
- Pillot B, Soty M, Gautier-Stein A, et al. Protein feeding promotes redistribution of endogenous glucose production to the kidney and potentiates its suppression by insulin. Endocrinology. 2009;150(2):616–624..
- Dombrowski NC, Karounos DG. Pathophysiology and management strategies for hyperglycemia for patients with acute illness during and following a hospital stay. Metabolism. 2013;62(3):326–336.
- Deane AM, Horowitz M. Dysglycaemia in the critically ill: significance and management. Diabetes Obes Metab. 2013;15(9):792–801.
- Moghissi ES, Korytkowski MT, DiNardo M, et al. American Association of Clinical Endocrinologists and American Diabetes Association consensus statement on inpatient glycemic control. Diabetes Care. 2009;32(6):1119–1131.
- Ş T, Yüksel RC, Gündoğan K. et al. Stress hyperglycemia incidence in critically ill patients: cross-sectional observational study. Yoğun Bakım Derg. 2018;9(2):46–50.
- Lacherade JC, Jacqueminet S, Preiser JC. An overview of hypoglycemia in the critically ill. J Diabetes Sci Technol. 2009;3(6):1242–1249.
- Godinjak A, Iglica A, Burekovic A, et al. Hyperglycemia in critically ill patients: management and prognosis. Med Arch. 2015;69(3):157–160.
- Casillas S, Jauregui E, Surani S, et al. Blood glucose control in the intensive care unit: where is the data? World J Meta-Anal. 2019;7(8):399–405.
- Cely CM, Arora P, Quartin AA, et al. Relationship of baseline glucose homeostasis to hyperglycemia during medical critical illness. Chest. 2004;126(3):879–887.
- Donihi AC, Raval D, Saul M, et al. A. Prevalence and predictors of corticosteroid-related hyperglycemia in hospitalized patients. Endocr Pract. 2006;12(4):358–362.
- Phadke D, Beller JP, Tribble C. The disparate effects of epinephrine and norepinephrine on hyperglycemia in cardiovascular surgery. Heart Surg Forum. 2018;21(6):E522–E526.
- Marik PE, Bellomo R. Stress hyperglycemia: an essential survival response. Crit Care. 2013;17(2):305.
- De La Rosa Gdel C, Donado JH, Restrepo AH, et al. Strict glycaemic control in patients hospitalised in a mixed medical and surgical intensive care unit: a randomised clinical trial. Crit Care. 2008;12(5):R120.
- Wiener RS, Wiener DC, Larson RJ. Benefits and risks of tight glucose control in critically ill adults: a meta-analysis. JAMA. 2008 Aug 27;300(8):933–944.
- Brunkhorst FM, Engel C, Bloos F, et al. German competence network sepsis (SepNet) intensive insulin therapy and pentastarch resuscitation in severe sepsis. N Engl J Med. 2008;358(2):125–139.
- Preiser JC, Devos P, Ruiz-Santana S, et al. A prospective randomised multi-centre controlled trial on tight glucose control by intensive insulin therapy in adult intensive care units: the Glucontrol study. Intensive Care Med. 2009;35(10):1738–1748.
- The NICE-SUGAR Study Investigators. Intensive versus conventional glucose control in critically ill patients. N Engl J Med. 2009;360(13):1283–1297.
- Griesdale DE, De Souza RJ, Van Dam RM. Intensive insulin therapy and mortality among critically ill patients: a meta-analysis including NICE-SUGAR study data. CMAJ. 2009;180(8):821–827.
- Green JP, Berger T, Garg N, et al. Hyperlactatemia affects the association of hyperglycemia with mortality in non-diabetic adults with sepsis. Acad Emerg Med. 2012;19(11):1268–1275.
- Tiruvoipati R, Chiezey B, Lewis D, et al. Stress hyperglycemia may not be harmful in critically ill patients with sepsis. J Crit Care. 2012;27(2):153–158.
- Cichosz SL, Schaarup C. Hyperglycemia as a predictor for adverse outcome in ICU patients with and without diabetes. J Diabetes Sci Technol. 2017;11(6):1272–1273.
- Deedwania P, Kosiborod M, Barrett E, et al. Hyperglycemia and acute coronary syndrome: a scientific statement from the American Heart Association diabetes committee of the council on nutrition, physical activity, and metabolism. Circulation. 2008;117(12):1610–1619.
- Goyal A, Mahaffey KW, Garg J, et al. Prognostic significance of the change in glucose level in the first 24 h after acute myocardial infarction: results from the CARDINAL study. Eur Heart J. 2006;27(11):1289–1297.
- Kosiborod M, Inzucchi SE, Krumholz HM, et al. Glucometrics in patients hospitalized with acute myocardial infarction: defining the optimal outcomes-based measure of risk. Circulation. 2008 Feb 26;117(8):1018–1027.
- Kosiborod M, Rathore SS, Inzucchi SE, et al. Admission glucose and mortality in elderly patients hospitalized with acute myocardial infarction: implications for patients with and without recognized diabetes. Circulation. 2005 Jun 14;111(23):3078–3086.
- Capes SE, Hunt D, Malmberg K, et al. Stress hyperglycaemia and increased risk of death after myocardial infarction in patients with and without diabetes: a systematic overview. Lancet. 2000 Mar 4;355(9206):773–778.
- Callahan LA, Supinski GS. Hyperglycemia-induced diaphragm weakness is mediated by oxidative stress. Crit Care. 2014;18(3):R88.
- Becker CD, Sabang RL, Nogueira Cordeiro MF, et al. Hyperglycemia in medically critically ill patients: risk factors and clinical outcomes. Am J Med. 2020 Oct;133(10):e568–e574.