
ABSTRACT
Background: Identification of tissue hypoxia and hypoperfusion plays an important role in the management of critically ill patients. Although the venous-arterial PCO2 difference (ΔPCO2) cannot serve as a marker of tissue hypoxia, it is considered a marker of the adequacy of venous blood flow (Cardiac output). The present study aimed to evaluate the role of venous-arterial PCO2 gradient in prediction of outcome in septic patients admitted to ICU.
Patients and methods: 100 adult patients fulfilled the criteria of severe sepsis or septic shock admitted to Emergency Intensive Care Unit, were divided in two groups according to ΔPCO2. The high ΔpCO2 group (ΔpCO2 > 6 mmHg) included 58 patients and the normal ΔpCO2 (ΔpCO2 ≤ 6 mmHg) included 42 patients. Clinical scoring systems were recorded. Clinical outcome including organ dysfunction and mortality was recorded.
Results: The high ΔPCO2 group showed significant lower blood glucose level (p = 0.038) than the normal ΔPCO2 group. Serum lactate, heart rate, and APACHE score were significantly higher in high ΔPCO2 group than normal ΔPCO2 group (p, 0.012, 0.013, and 0.020, respectively). As regard to the clinical outcome, patient mortality was significantly higher (p = 0.042) in high ΔPCO2 group than normal ΔPCO2 group and the number of organ dysfunction was higher in high ΔPCO2 group than normal ΔPCO2 group but not reached a significant level (p = 0.625).
Conclusions: ΔPCO2 is a reliable index for early prediction of clinical outcome including organ dysfunction and mortality in patients with sepsis and septic shock.
1. Introduction
Identification of tissue hypoxia and hypoperfusion plays an important role in the management of critically ill patients during early resuscitation [Citation1].
Resuscitation may be guided by central venous oxygen saturation (ScvO2) as an indicator of tissue hypoxia. Significant fluctuations in ScvO2 may occur during sepsis. However, persistent tissue hypoperfusion caused by microcirculatory and mitochondrial failure may occur in the presence of normal or increased ScvO2 [Citation2].
ΔPCO2 is the difference between the partial pressure of CO2 in mixed venous blood (PvCO2) and arterial blood. It represents only a fraction of arterial and venous CO2 content (CaCO2 and CvCO2) respectively. However, as the relationship between partial pressure and content of CO2 is almost linear under normal physiological conditions, PCO2 can be taken as a measure of CCO2. At the cellular level, CO2 is a normal terminal product of oxidative metabolism. Thus, in the absence of a shunt, CCO2in the efferent venous blood must be higher than in the afferent arterial blood [Citation3].
According to the Fick equation, CO2 excretion (equivalent to CO2 production in a steady state) equals the product of cardiac output (CO) and the veno-aterial difference in CO2 content (CaCO2),[VCO2 = CO×(CvCO2–CaCO2)]. Accordingly, theΔPCO2 = VCO2 × k/CO, k is assumed to be constant, and ΔPCO2 is linearly related to CO2 production and inversely related to CO. Therefore, if cardiac output is low, ΔPCO2 is expected to be abnormally high (More than 6 mmHg) [Citation4].
Global indices of tissue perfusion include lactate and central venous oxygen saturation (SvcO2). Although ΔPCO2 cannot serve as a marker of tissue hypoxia, it can be considered as a marker of the adequacy of venous blood flow (Cardiac output) to remove the total CO2 produced by the peripheral tissues [Citation5]. ΔPCO2 has also been described in patients with sepsis, cardiogenic shock, acute myocardial infarction, and congestive heart failure, as well as cardiac arrest following CPR and heart surgery [Citation6].
Interestingly, ΔPCO2 has recently been proposed as a useful tool for goal-directed therapy (GDT) in ICU-septic patients to identify persistent hypoperfusion when a ScvO2 > 70% has been reached as oxygen consumption (VO2) is impaired as a consequence of mitochondrial dysfunction in sepsis [Citation7]. Experimental models have shown that in toxemia, venous hypercapnia is a more significant contributor to the increase in the veno-arterial CO2 gradient than arterial CO2 values [Citation8]. This study aimed to evaluate the role of ΔPCO2 gradient in prediction of outcome in septic patients admitted to ICU.
2. Patients and methods
2.1. Study design
A prospective observational study was performed at the Emergency Intensive Care Unit (ICU) of Benha University hospital from August 2018 to April 2020. The study included 100 adult critically ill patients admitted to the intensive care unit after approval by the local Ethical Committee and a written informed consent was obtained from patient’s relatives.
2.2. Inclusion and exclusion criteria
Adult patients were admitted to the ICU with a length of stay ≥ 24 hours and fulfilled the criteria of severe sepsis or septic shock. We have excluded patients below 18 years, patients admitted with a length of stay <24 h, patients with chronic obstructive pulmonary disease (COPD) were excluded.
2.3. Study groups and data
Radial arterial cannula was inserted for arterial blood gases sampling and internal jugular central venous pressure (CVP) catheter was inserted for central venous blood gases sampling. Patients were divided and compared on the basis of ΔPCO2 values measured on admission into two groups: High ΔPCO2 group (ΔPCO2 > 6 mmHg) and normal ΔPCO2 group (ΔPCO2 ≤ 6 mmHg).
On admission, patient’s demographic data were recorded in both groups, full detailed history taking, complete clinical examination and full laboratory investigations (urea, creatinine, Na, K, complete blood count (CBC), alanine transaminase (ALT), aspartate transaminase (AST), bilirubin, albumin, serum lactate, INR (International normalized ratio), and random blood sugar were done. Hemodynamic parameters including (mean arterial blood pressure, heart rate, respiratory rate), clinical scoring systems including Glasgow coma scale (GCS), Acute Physiology and Chronic Health Evaluation (APACHE II), Sequential Organ Failure Assessment (SOFA) were recorded. Laboratory investigations, hemodynamic parameters, SOFA and GCS scoring systems were daily repeated for patient follow up according to the length of ICU stay. The number of mechanically ventilated patients and duration of ventilation and ICU stay were also recorded. Clinical outcomes including organ dysfunction and 28-day mortality rate was recorded. Delta PCO2 was correlated to laboratory investigations, GCS, APACHE II, SOFA scores, duration of mechanical ventilation and number of organ dysfunction.
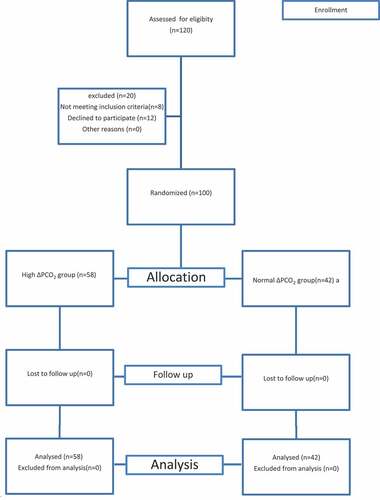
A Consort flow chart was showen in
Figure 1. Consort flow chart
3. Statistical analysis
The collected data was tabulated and analyzed using SPSS version 16 software (SPSS Inc, Chicago, ILL Company). Categorical data were presented as number and percentages, Chi square (χ2) test was used to analyze them. Quantitative data were tested for normality using Kolmogorov Smirnov test assuming normality at P > 0.05. Normally distributed variables were expressed as mean ±standard deviation and analyzed by Student “t for 2 independent groups. Correlations were assessed by Person’s correlation coefficient (r). P ≤ 0.05 was considered significant.
3.1. Sample size calculation
MedCalc software version 16.1(© 1993–2016 MedCalc Software, www.medcalc.org) was used to calculate the required sample size using the mean values of SOFA day1 among the studied normalΔPCO2 group (9.5 ± 2.8) and the high ΔPCO2 group (12 ± 3.9) groups according to Araujo et al. [Citation9] as follows:
Level of significance (type I error) = 0.05,
Type II error (1-level of power) = 0.2
Difference in means = 2.5
SD in group1 = 2.8
SD in-group 2 = 3.9
Therefore, the least sample size is 60 subjects, 30 in each group.
4. Results
The study initially included 120 patients assessed for eligibility, 20 patients were excluded (12 patients not meeting inclusion criteria,8 patients declined to participate). The study finally included 100 patients divided according to the ΔPCO2 value into two groups, the normal ΔPCO2 group included 42 patients and the high ΔPCO2 group included 58 patients. These data were illustrated in the consort flow chart.
As regard to patient demographic data, there was no significant difference between both groups regarding age (p = 0.268) or sex (p = 0.768). The data are shown in .
Table 1. The patients’ demographic data in both studied groups
According to the cause of admission, the high ΔPCO2 group included more patients with severe sepsis and septic shock than the normal ΔPCO2 group with a significant p value = 0.016. However, the number of mechanically ventilated patients were similar in both studied groups (p value = 0.551) as shown in .
Table 2. The causes of patients’ admission to ICU and number of patients on mechanical ventilation
Regarding comorbidities, there were 28 (56.0%) diabetic patients, 32(64%) hypertensive patients, 27 (54%) patients with cardiovascular insults, 18 (36%) patients with chronic kidney disease (CKD), 5(10%) patients with chronic lung disease (CLD), 10 (20%) patients with neurological insults, 31 (62%) patients with severe respiratory disease, 12 (24%) patients with malignancy and 3 (6%) patients with thyroid diseases. There was insignificant statistical difference (p = 0.28) in the distribution of co-morbidities between both groups of Δ PCO2 (data was not shown).
As regard to the duration of mechanical ventilation, the duration of ICU stays, the need for vasopressor drugs, laboratory investigations, ICU scoring and patients mortality.
Duration of mechanical ventilation and ICU stay was recorded in both groups; the duration was longer in the high group of ΔPCO2 than in the normal group with no significant statistical differences.
The heart rate was significantly higher (p = 0.013) in the high ΔPCO2 group than the normal group (110.5 ± 13.5 versus 95.3 ± 20.0) beat/min. The mean arterial blood pressure was lower in the high ΔPCO2 group than the normal group (71.2 ± 31.8 versus 84.6 ± 16.2) mmHg with insignificant statistical difference (p = 0.058). The need for vasopressor drugs was higher in the high ΔPCO2 group than the normal group (63.8% versus 57.1%) with insignificant statistical difference (p value = 0.152).
As regard laboratory investigations, there was insignificant statistical difference between both groups of ΔPCO2 in all parameters except for blood glucose and serum lactate level. Blood glucose was significantly lower (p = 0.038) in the high ΔPCO2 group than the normal group (201.9 ± 85.6 versus 270.7 ± 119.3) mg/dl. Serum lactate was significantly higher (p = 0.012) in the high ΔPCO2 group than the normal group (3.6 ± 1.5 versus 1.8 ± 0.7) mmol/L.
ICU scoring systems including GCS, APACHE, and SOFA score systems were recorded. There was insignificant statistical difference between both groups except for the APACHE score that was significantly higher (P value = 0.020) in the high ΔPCO2 group than the normal one (24.3 ± 7.5 versus 19.9 ± 5.4).
The 28- day mortality rate was significantly higher (p = 0.042) in high ΔPCO2 group than normal ΔPCO2 group. All these data are shown in .
Table 3. Comparison of the duration of mechanical ventilation, ICU stay, vital signs, some laboratory investigation and ICU scoring system on the time of ICU admission in both studied groups
As regard to the organ dysfunction in the ICU, it was higher in high ΔPCO2 group than normal ΔPCO2 group with insignificant statistical difference (p value = 0.625), as shown in .
Table 4. Differences between the ΔPCO2 groups regarding the number of organ dysfunction in ICU
The ΔPCO2 was correlated with laboratory investigations, GCS, APACHE II, SOFA scores, duration of mechanical ventilation, ICU stay, and organ dysfunction.
We have found that serum k level, serum Na level, blood glucose level, liver enzymes, albumin, and platelets, were inversely proportional to ΔPCO2 value.
On the other hand, urea, creatinine, bilirubin, hemoglobin, hematocrit, total leucocytic count, INR, arterial pH, were directly proportional to ΔPCO2 value. All these correlations were statistically insignificant except serum k level, as shown in .
Table 5. The correlation between ΔPCO2 values and some laboratory parameters
The duration of mechanical ventilation and the number of organ dysfunction, APACHE II and SOFA scores were directly proportional to ΔPCO2 value. However, GCS was inversely proportional to ΔPCO2. All these correlations were statistically insignificant except GCS and SOFA score as shown in .
Table 6. Correlation between ΔPCO2 values and duration of mechanical ventilation, number of organ dysfunction and different scoring systems
5. Discussion
Shock is defined as global tissue hypoxia secondary to an imbalance between systemic oxygen delivery and oxygen demand. Hence, normal ScvO2 values do not guarantee adequate tissue oxygenation and other circulatory parameters are needed to evaluate resuscitation efforts. The central venous-arterial carbon dioxide difference (pCO2gap) can be considered as a marker of the adequacy of venous blood flow to remove the total CO2 produced by the peripheral tissues [Citation10]. The aim of this study was to evaluate the role of venous-arterial PCO2 gradient in prediction of outcome in septic patients admitted to ICU.
Our findings were in line with physiological theory, which described an inverse curvilinear relation between cardiac output and PCO2 gap, according to a modified Fick equation for a range of CO2 production. Various studies have described such an inverse relationship between the delta PCO2 gap and cardiac index in septic circulatory failure [Citation11].
In the present study, 38% of admitted patients were males and 62% of patients were females, with no significant statistical difference between the two groups. The mean age for admitted patients was 60.9 ± 14.9 years for the normal group and 58.4 ± 19.3 years for the high ΔPCO2 group with no significant statistical difference between both groups.
According to the cause of admission, 66% of admitted patients had severe sepsis and 34.0% had septic shock. The number of septic shock patients was significantly higher (P-value <0.05) in the high ΔPCO2 group 28 (48.3%) than in the normal ΔPCO2 group 6 (14.3%). lamia et al. [Citation12] explained the relationship between ΔPCO2 and hypoperfusion by the fact that ΔPCO2 is linearly related to CO2 production that increases in shock due to the shift to anaerobic metabolism. and inversely related to cardiac output which significantly decreases in shock states.
Regarding the hemodynamics parameters in the studied groups, heart rate increased significantly (p-value of 0.013) in the high ΔPCO2 group (mean = 110.5 ± 13.5) than in the normal one (mean = 95.3 ± 20.0). This is explained by the compensatory sympathetic stimulation which increases heart rate in hypoxic hypoperfused patients to maintain cardiac output and organ perfusion. The mean arterial blood pressure was lower in high Δ PCO2 group (71.2 ± 31.8) than normal one (84.6 ± 16.2) but not reached a significant level (p = 0.058). On admission, 57.1% of the normal group versus 63.8% of the high group required inotropic support without significant difference between both groups. The mean respiratory rate was almost equal between both groups with no significant difference. In agreement with the above-mentioned results, Araujo et al. [Citation9] detected insignificant difference in the mean arterial blood pressure and the requirement of inotropic support between both ΔPCO2 groups.
Bitar et al. [Citation11] detected a significant lower mean arterial blood pressure (p-value, 0.01) in high ΔPCO2 group. The need for more vasopressors and IV fluid administration were significantly higher in high ΔPCO2 group than the normal the ΔPCO2 group (p value = 0.01 and 0.009, respectively).
At the time of admission, 36% of patients were mechanically ventilated and 64% of patients were not. We have found that the mean duration of mechanical ventilation increased in the high ΔPCO2 group (7.2 ± 5.1 days) than in the normal one (6.7 ± 4.3 days) without a significant statistical difference in both groups. In addition, length of ICU stay was longer in high ΔPCO2 than normal ΔPCO2. Robin et al. supported these results [Citation13].
The mean blood glucose level was significantly less (p = 0.038) in the high ΔPCO2 group (201.9 ± 85.6) than in the normal group (270.7 ± 119.3). This can be explained by Randal et al. [Citation14] who stated that under anaerobic conditions, accelerated anaerobic glycolysis leads to excessive lactic acid production (since pyruvate cannot be longer cleared by the Krebs cycle). This mechanism explains increased CO2 production in hypoxic conditions. Another explanation is the relative adrenal insufficiency that occurs in septic shock and low flow states.
Regarding the clinical scoring systems in the ICU, the APACHE II score was significantly higher (p = 0.020) in the high ΔPCO2 group (mean = 24.3 ± 7.5) than the normal ΔPCO2 group (mean = 19.9 ± 5.4). This result was supported by Wang et al. [Citation15] who reported significant positive correlation between ΔPCO2 and APACHE II score (r = 0.377, p < 0.001). The SOFA score which reflects organ dysfunction and failures in the ICU, was significantly higher (p = 0.031) in the high ΔPCO2 group than the normal group with a significant positive correlation with ΔPCO2 (r = 0.283, p = 0.046). This was supported by Ospina-Tascon et al. [Citation16] who found that the persistence of high ΔPCO2 was associated with a higher 3 days SOFA score (P < 0.001). In addition, Wang et al. [Citation15] reported a significant positive correlation between ΔPCO2 and the SOFA score (r = 0.318, p < 0.001). The GCS was lower in the high ΔPCO2 group than the normal group but not reached a significant level (p = 0.062). This alteration could be explained by cerebral hypoperfusion.
In the present study, serum lactate was significantly higher (p = 0.012) in high ΔPCO2 group (3.6 ± 1.5) than the normal group (1.8 ± 0.7). Furthermore, van Beest et al. [Citation10] reported that ΔPCO2 was inversely correlated with lactate clearance and reduction in SOFA score after 24 hours, which was explained by the observed significant lower cardiac index in the high gap group.
The serum potassium level showed a significant negative correlation (p value=0.01) with ΔPCO2 value. The low potassium level associated with high ΔPCO2 could be explained by the presence of stress associated with sepsis, shock, or infarction that enhances catecholamines release. The catecholamines in turn activates the Na-K-ATPase enzyme that droved potassium intracellular [Citation17,Citation18].
As regard organ dysfunction in ICU, high ΔPCO2 group showed higher number of organ dysfunction than normal ΔPCO2 group but not reached a significant level (p value = 0.625). Robin et al [Citation13] detected similar results. They reported high percentage of patients with high ΔPCO2 among patients with organ dysfunction.
In the high ΔPCO2 group, there was a significant increase (p = 0.042) in the ICU 28- day mortality rate (69% versus 28.6%) than the normal group. Similar results were reported by Mallat et al. [Citation19] with 75% mortality within 28-days for the high ΔPCO2 group versus 42% for the normal group (p = 0.003). Van beest et al. [Citation10] reported a higher mortality rate in the high ΔPCO2 group than the normal group (29% versus 21%) but without a significant statistical difference.
In addition, Mesquida et al. [Citation20] demonstrated an increased mortality rate among patients with high ΔPCO2/Ca-vO2 ratios. However, Ospina-Tascon et al. [Citation16] found that lactate and ΔPCO2/Ca-vO2 were independently associated with mortality at multivariate analysis, among a series of hemodynamic variables in septic shock. Similar results were reported by Gavelli et al. [Citation21]
Conclusions: ΔPCO2 can be used as a reliable index for early prediction of organ dysfunction and clinical outcome in patients with sepsis and septic shock in ICU.
Recommendations: we recommend further studied on larger patient sample. We also advise to select specific group of patients with uniform data to avoid bias in the outcome.
Disclosure statement
No conflict of interest was reported by the authors.
References
- Cuschieri J, Rivers EP, Donnino M, et al. Central venous-arterial carbon dioxide difference as an indicator of cardiac index. Intensive Care Med. 2005;31:818–822.
- He H, Liu D, Long Y, et al. High central venous-to-arterial CO2 difference/arterial-central venous O2 difference ratio is associated with poor lactate clearance in septic patients after resuscitation. J Crit Care. 2016;31:76–81.
- Monnet X, Julien F, Ait-Hamou N, et al. Lactate and veno-arterial carbon dioxide difference/arterial-venous oxygen difference ratio, but not central venous oxygen saturation. Predict increase in oxygen consumption in fluid responders. Crit CareMed. 2013;41:1412–1420.
- Puskarich MA, Trzeciak S, Shapiro NI, et al. Emergency Medicine Shock Research Network (EMSHOCKNET): outcomes of patients undergoing early sepsis resuscitation for septic shock compared with overt shock. Resuscitation. 2011;82:1289–1293.
- Vallet B, Teboul JL, Cain S, et al. Venoarterial CO2 difference during regional ischemic or hypoxic hypoxia. J Appl Physiol. 2000;89(4):1317–1321.
- Victor VM, Espulgues JV, Hernández-Mijares A, et al. Oxidative stress and mitochondrial dysfunction in sepsis: a potential therapy with mitochondria-targeted antioxidants. Infect Disorder Drug Tar. 2009;9:376–389.
- Du W, Liu DW, Wang XT, et al. Combining central venous-to-arterial partial pressure of carbon dioxide difference and central venous oxygen saturation to guide resuscitation in septic shock. J Crit Care. 2013;28:1110.e1–1110.e5.
- Antonelli M, Levy M, Andrews P, et al. Hemodynamic monitoring in shock and implications for management. International consensus conference, Paris, France, 27-28 April 2006. Intensive Care Med. 2007;33:575–590.
- Araujo DT, Felice VB, Meregalli AF, et al. Value of central venous to arterial CO2 difference after early goal-directed therapy in septic shock patients. Indian J Crit Care Med. 2019;23(10):449–453.
- Van Beest PA, Lont MC, Holman ND, et al. Central venous-arterial PCO2 difference as a tool in resuscitation of septic patients. Intensive Care Med. 2013;39:1034–1039.
- Bitar Z, Maadarani O, El-Shably A, et al. The forgotten hemodynamic (PCO2 Gap) in severe sepsis. Crit Care Res Pract. 2020:5. Article ID 9281623. DOI:10.1155/2020/9281623.
- Lamia B, Monnet X, Teboul JL. Meaning of arterio-venous PCO2 difference in circulatory shock. Minerva Anestesiol. 2006;72(6):597–604.
- Robin E, Futier E, Pires O, et al. Central venous- to-arterial carbon dioxide difference as a prognostic tool in high- risk surgical patients. Crit Care. 2015;19(1):227.
- Randall HM, Cohen JJ. Anaerobic CO2 production by dog kidney in vitro. A J Physiol. 1966;211(2):493–505.
- Wang Z, Wei X, Qin T, et al. Prognostic value of central venous-to-arterial carbon dioxide difference in patients with bloodstream infection. Int J Med Sci. 2021;18(4):929–935.
- Ospina-Tascon GA, Umaoa M, Bermodez W, et al. Combination of arterial lactate levels and venous-arterial CO2 to arterial-venous O2 content difference ratio as markers of resuscitation in patients with septic shock. Intensive Care Med. 2015;41:796–805.
- Gennari FJ. Current concepts: hypokalemia. N Engl J Med. 1998;339(7):451–458.
- Gennari FJ. Disorders of potassium homeostasis: hypokalemia and hyperkalemia. Crit Care Clin. 2002;18(2):273–288.
- Mallat J, Pepy F, Lemyze M, et al. Central venous-to-arterial carbon dioxide partial pressure difference in early resuscitation from septic shock. Eur J Anaesthesiol. 2014;31:371–380.
- Mesquida J, Saludes P, Gruartmoner G, et al. Central venous-to-arterial carbon dioxide difference combined with arterial-to-venous oxygen content difference is associated with lactate evolution in the hemodynamic resuscitation process in early septic shock. Crit Care. 2015;19:126.
- Gavelli F, Teboul JL, Monnet X. How can CO2-derived indices guide resuscitation in critically ill patients? J Thorac Dis. 2019;11(Suppl 11):S1528–S1537.