
Abstract
Measuring the biological diversity in a given area can provide valuable approaches not only to conserve ecological systems, but also to understand their functioning and organization. The current paper analyzes the species richness and diversity patterns of sarcosaprophagous Diptera across an elevational gradient of natural habitats in central Spain, and the relationship between the species diversity and the environmental variables defining each habitat. The calculation of randomized species richness curves and non-parametric estimators confirmed the representativeness of the inventories. Oromediterranean habitats, i.e. those located at highest elevation, showed significantly lower species richness than mesomediterranean and supramediterranean levels. Slope and solar radiation were significantly and negatively correlated with diversity, whereas the correlation between mean temperature and diversity was significantly positive. A significantly negative correlation was found between diversity and the percentage of forest surface, whereas the correlation between diversity and the percentage of urban surface was positive and close to significance. Possible explanations for these observed patterns are considered and discussed. This study also supports the use of different, complementary diversity measurements in order to obtain a proper assessment of the diversity of a given area.
Introduction
Measuring the biological diversity and studying its relationship with the environmental variables in a particular region can provide valuable approaches not only to conserve ecological systems, but also to understand their functioning and organization. Nevertheless, the oldest and most intuitive parameter to quantify such diversity, the species richness or total number of species (Peet Citation1974; Gotelli & Colwell Citation2001), is also an elusive quantity to measure properly since the number of inventoried species increases with sampling effort (Gotelli & Colwell Citation2001). Because of this, most faunistic inventories are inevitably incomplete (Jiménez-Valverde & Hortal Citation2003). Different techniques have been developed with the aim to solve this problem, estimating species richness in a given area independently of sample size and by optimizing time and money (Melo Citation2004). Moreover, it must be taken into account that a number of concepts are lumped under the title of diversity. Thus, other parameters like heterogeneity, dominance and equitability are necessary to obtain a more complete measurement of the diversity of taxa at a particular site (Peet Citation1974). On the other hand, if different areas show different species diversity, then the variables defining such areas, like the environmental and human-induced factors, may influence that diversity.
In nature, carrion sustains a highly diverse community of insects (Braack Citation1987), including a high number of sarcosaprophagous Diptera species (e.g. Hwang & Turner Citation2005; Martín-Vega & Baz Citation2013). However, despite the essential role of the carrion flies in ecosystems (Braack Citation1987; Barton et al. Citation2013) and their applied importance (e.g. Amendt et al. Citation2011), there is a lack of studies quantifying their diversity and analyzing its relationship with the environmental factors. This is particularly evident in a highly diverse region like the Mediterranean Basin, where interconnected variables like vegetation, elevation and temperature appear to be factors determining the species richness and diversity of other insect groups (e.g. González-Megías et al. Citation2008; Hackenberger et al. Citation2009). Human activities also influence the insect diversity, although that influence may be either negative (e.g. Stefanescu et al. Citation2004) or positive (e.g. Zamora et al. Citation2007), depending on the insect group.
A previous study showed differences in the species composition of sarcosaprophagous flies between different habitats across an elevational gradient in central Spain (Martín-Vega & Baz Citation2013). In the current paper, we analyze if there were also differences in the species diversity across that elevational gradient, as well as the relationship of the species diversity with the environmental variables defining each habitat. The species diversity for each habitat was measured as species richness, assessed in turn with the estimations from species accumulation curves and non-parametric methods, and complemented with the calculation of dominance, equitability and Shannon diversity indexes. Regarding the correlates between the species diversity and the environmental variables defining the habitats, we analyze those factors which have been shown to determine the species richness and diversity of insects in the Mediterranean region: elevation, temperature and land use parameters (e.g. Stefanescu et al. Citation2004; Zamora et al. Citation2007; González-Megías et al. Citation2008; Hackenberger et al. Citation2009), as well as other related abiotic factors (slope, rainfall and solar radiation) which may also influence the species diversity.
Materials and methods
Study area and design of the sampling
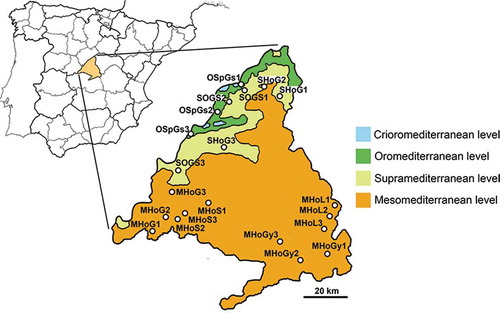
A sampling to study the assemblages of sarcosaprophagous insects was carried out within the limits of the Madrid Community, a topographically and environmentally very heterogeneous area located in the centre of the Iberian Peninsula. In the Madrid Community it is possible to recognize four bioclimatical levels in an increasing altitudinal gradient: mesomediterranean, supramediterranean, oromediterranean and crioromediterranean, although the latter occupies a very limited area and shows a relict character (Rivas-Martínez et al. Citation1987). Taking into account the first three bioclimatical levels as well as the forest type and soil type occurring in the study area (Rivas-Martínez et al. Citation1987), we designed a stratified sampling regime with a selection of seven main types of natural habitat, which are distributed throughout the whole Madrid province in central Spain: (1) mesomediterranean holm oakwood (Quercus ilex ssp. ballota Linnaeus, 1753) on limestone (MHoL); (2) idem on gypsum and marlstone (MHoGy); (3) idem on sand (MHoS); (4) idem on granite (MHoG); (5) supramediterranean holm oakwood on granite (SHoG); (6) supramediterranean oakwood (Quercus pyrenaica Willdenow, 1805) on granite and schist (SOGS); (7) oromediterranean Scot’s pine forests (Pinus sylvestris Linnaeus, 1753) on granite and schist (OSpGS). Three localities for each habitat were selected, which resulted in a total of 21 sites (). Detailed information on the location, bioclimatic and topographical features, and percentages of land use of the sampling sites can be found in supplemental Table S1. Climatic data have been obtained from Ninyerola et al. (Citation2005). Topographical and land use data were obtained from the ‘Infraestructura de Datos Espaciales de España’ (IDEE; Spanish Ministerio de Fomento) web application (http://www.idee.es), considering quadrants of 4.5 ha with the selected sampling site as the centre.
Figure 1. Map of the Madrid Community showing the sampling sites across the elevational gradient marked by the bioclimatical levels: mesomediterranean (orange), supramediterranean (light green), oromediterranean (green) and crioromediterranean (blue). Abbreviations for the sampling sites are given in Materials and methods. The numbers 1, 2 and 3 indicate the three localities selected for each habitat.
Trapping method, preservation and identification
Carrion-baited traps were made by modifying the design of Morón and Terrón (Citation1984), as described in Baz et al. (Citation2007). Traps were baited with squid, semi-buried in the ground and protected with a perimeter of stones to avoid destruction by wild animals attracted by the carrion. To control the effect of the vegetation cover, three traps were installed at each site (forest, scrub and grassland) and maintained from June 2006 to May 2007; hence, a total of 63 traps remained installed during 12 months and, in the end, 36 samples per locality (three installed traps × 12 months), and 756 samples in total (63 traps × 12 times) were obtained. Traps were baited once a month and operated during seven continuous days, after which both bait and sample were removed. The collected specimens were either preserved in 80% ethanol or oven dried and pinned, and deposited in the collection of the Department of Life Sciences of the University of Alcalá. Individuals of families Carnidae, Fanniidae, Phoridae and Sphaeroceridae could not be identified to species and they have been omitted in this study.
Data analysis
Species richness was estimated in every sampling site in order to determine if the observed species richness was representative enough of the total number of species. In this sense, Colwell and Coddington (Citation1994) distinguished three methods of species richness estimation: extrapolating species accumulation curves, fitting parametric models of relative abundance and non-parametric methods. The first method uses asymptotic models, like the Michaelis-Menten equation of enzyme kinetics (Michaelis & Menten Citation1913), for the cumulative number of species discovered within a defined area as a function of the effort expended to find them (Colwell & Coddington Citation1994). The second method assumes that sampling data follow a specific distribution like the lognormal, the Poisson-lognormal or the inverse Gaussian-Poisson (Colwell & Coddington Citation1994; Chao Citation2005). In contrast, non-parametric approaches avoid making assumptions about species discovery rates and data distribution (Chao Citation2005). In the present work, species richness was estimated from the samples by extrapolation of species accumulation curves using the Michaelis-Menten equation, and by non-parametric methods. Four non-parametric estimators were used: jackknife 1, jackknife 2, Chao 1, and Chao 2. Jackknife 1 estimator is based in the number of species that occur in only one sample (uniques), whereas jackknife 2 and Chao 2 estimators are based on the number of species that occur in only one sample (uniques), as well as the number that occur in exactly two samples (duplicates) (Colwell & Coddington Citation1994). On the other hand, Chao 1 estimator is based on the number of observed species that are represented by only one individual (singletons), as well as the number that occur with exactly two individuals (doubletons) (Colwell & Coddington Citation1994). Randomized accumulation curves of observed species richness using the Mao Tau estimator, and the different estimators, were calculated for each sampling site using EstimateS software (Colwell Citation2005). One hundred randomizations were always used. Inventory completeness, defined as observed species richness in relation to estimated richness (Cardoso et al. Citation2009), was calculated using both Michaelis-Menten and non-parametric estimates.
In addition to species richness, species diversity was also measured using the Shannon diversity index, which combines information on species richness and their relative abundance; it was also computed using EstimateS software (Colwell Citation2005). The Shannon index measurement of diversity was complemented with the calculation of both dominance and equitability indices for each sampling locality. Dominance was obtained from McNaughton and Wolf’s index (McNaughton & Wolf Citation1970), which divides the sum of individuals of the two most abundant species by the total number of individuals. Equitability was obtained from Lloyd and Ghelardi’s index, which divides the Shannon diversity index value by the maximum possible value of diversity (Lloyd & Ghelardi Citation1964). In accordance with a previous paper (Martín-Vega & Baz Citation2013) where significant differences in species composition between the three sampled bioclimatical levels (mesomediterranean, supramediterranean and oromediterranean) were found, the observed species richness and the diversity parameters (Shannon diversity index, dominance and equitability) were tested for differences between bioclimatical levels, using analysis of variance (ANOVA) with the software STATGRAPHICS PLUS 5.1 (Statistical Graphics Corp. 1994–2000). Differences were considered to be significant at the < 0.05 level.
Finally, Spearman rank correlation coefficients were computed to determine significant differences between climatic, topographical and land use data of the sampled localities, and the observed species richness, abundance and Shannon diversity index. The analyses were also performed using the software STATGRAPHICS PLUS 5.1 (Statistical Graphics Corp. 1994–2000). Differences were considered to be significant at the < 0.05 level.
Results
In total, 22,135 individuals belonging to 73 sarcosaprophagous Diptera species of 10 families were collected by carrion-baited traps in the 21 sampled localities from June 2006 to May 2007. A complete list of the inventoried species, their taxonomic authority and the number of collections in each sampled habitat can be found in Martín-Vega and Baz (Citation2013).
shows the number of observed species and the species richness estimated by Michaelis-Menten means and non-parametric estimators for each sampling locality. The species accumulation curves for each sampling locality () did not reach the asymptote by the end of the sampling process. The locality with the highest number of inventoried species was MHoL1 (43 species), whereas the locality OSpGS2 showed the lowest number of inventoried species (16 species); the main part of the sampled localities showed more than 30 inventoried species (). The extrapolation of species accumulation curves using Michaelis-Menten equation, and non-parametric estimator Chao 1, showed inventory completeness greater than 70% in every sampling locality, with the exception of locality OSpGS1 where the inventory completeness was close to that percentage (). In that locality, the proportion of singletons (43% of the inventoried species) and uniques (50% of the inventoried species) was especially great (data not shown). On the other hand, non-parametric estimators jackknife 1 and Chao 2 also showed inventory completeness greater than 70% in every sampling site with the exception of locality OSpGS1, and except locality OSpGS3 in jackknife 1 estimations, and localities MHoG2, SOGS2 and OSpGS3 in Chao 2 estimations (). Conversely, non-parametric estimator jackknife 2 showed inventory completeness lower than 70% for 11 of the 21 sampled localities (). When analyzing differences between bioclimatical levels, the observed species richness was significantly lower in oromediterranean habitats than in mesomediterranean and supramediterranean habitats (F = 6.6; P < 0.05).
Figure 2. Randomized accumulation curves for observed species richness in each sampling site. The numbers 1, 2 and 3 indicate the three localities selected for each habitat.
Table I. Number of observed species, number of species calculated from each estimator and diversity parameters for each sampling locality. Under each estimation has been included the respective percentage of inventory completeness. The numbers 1, 2 and 3 indicate the three localities selected for each habitat.
Shannon diversity index showed MHoG1 and MHoG3 as the most diverse sampled localities (). By contrast, the other sampled mesomediterranean holm oakwood on granite, the locality MHoG2, showed the lowest diversity values together with the locality SOGS1 (). Regarding the dominance and equitability values, both indices were negatively and significantly correlated (r = –0.85; p < 0.05). Consequently, the two sampled localities with the highest values of dominance, which were also the two lowest diverse localities (localities MHoG2 and SOGS1), showed the lowest equitability values (). Contrarily, the two sampled localities with the highest values of equitability, which were also the two most diverse localities (MHoG1 and MHoG3), showed two of the lowest dominance values (). In any case, no significant differences were found between the sampled bioclimatical levels testing the values of Shannon diversity index (F = 2.96; P > 0.05), dominance (F = 1.75; P > 0.2) and equitability (F = 1.95; P > 0.17).
Topographical parameters (elevation and slope) and solar radiation of the sampled localities were negatively correlated with species richness and Shannon diversity index, although significant differences were only found in the relation between Shannon diversity index, and slope and solar radiation (). Annual rainfall showed the same pattern, but in every case no significant differences were found (). Conversely, the correlation of these climatic and topographical parameters with dominance was positive, although differences were not significant (). It must be highlighted that elevation was related to climatic parameters; this relationship was significantly positive in the case of annual rainfall (r = 0.81; p < 0.01), positive but not significant in the case of solar radiation (r = 0.36; p = 0.1) and significantly negative in the case of mean temperature (r = –0.97; p < 0.01). Finally, the correlation between mean temperature of the sampled localities and Shannon diversity index was significantly positive (). The correlation between mean temperature and dominance was negative, but no significant differences were found (). Significant differences between the abundance and the considered parameters were not observed in any case ().
Table II. Spearman rank correlation coefficients between the number of observed species, abundance, Shannon diversity index and the climatic, topographical and land use variables of the sampling localities. ** significant differences (P < 0.05), * close to significance (P = 0.05).
Regarding land use data, a significantly negative correlation was observed between the percentage of forest surface and the Shannon diversity index (). No significant differences were found in the other types of land use, although values close to significance were observed in the positive correlation between the percentage of forest surface and dominance, and between the percentage of urban surface and the Shannon diversity index ().
Discussion
The number of inventoried species in every sampling locality was greater than 25, with the exception of locality OSpGS2, where the number of observed species was 16 (). This supports the idea that carrion is an ephemeral and patchy resource exploited by many species compared with other resources (Woodcock et al. Citation2002). As was expected, none of the randomized accumulation curves for each sampling locality reached an asymptote by the end of the sampling process (); hence, none of the species inventories was completed. However, inventory completeness of the present study, considering the estimates from the Michaelis-Menten equation and non-parametric methods, shows that the observed species richness is representative enough of the total number of species (). The percentages of inventory completeness are high, in some cases near 90% or even greater (). Generally, with proportions of inventory completeness greater than 70%, the estimations of species richness become stable (Jiménez-Valverde & Hortal Citation2003). The poorest inventory completeness was observed in samples from locality OSpGS1, where future and more intensive sampling efforts should be done. It is remarkable, nevertheless, that in some sampled localities, the estimated number of species notably varies between the different estimators (e.g. localities MHoG2, SOGS2 and OSpGS3) (). In this sense, there is some controversy about the accuracy of the performance by different estimators. Michaelis-Menten means the estimator has been shown to perform better than the other estimators when judged by indirect criteria of good estimator performance (Toti et al. Citation2000); however, it has been stated that in some cases, the Michaelis-Menten model could underestimate the species richness (Keating & Quinn Citation1998). On the other hand, despite the fact that non-parametric estimators of species richness are expected to be independent of sample size, they could produce overestimates as a consequence of a non-decreasing behaviour of the rare species curves as sampling effort increases (Melo Citation2004). High species richness estimates are obtained when non-parametric techniques are employed on samples with a high proportion of rare species (Melo Citation2004); this situation could easily have occurred in some inventoried localities of the present study where the proportion of singletons, doubletons, uniques and/or duplicates was great. In this sense, it is worth recalling that the use of carrion-baited traps involves several possible areas of bias which could affect not only the number of species but also the number of individuals collected (Hwang & Turner Citation2005).
In spite of the potential biases of the use of carrion-baited traps, this sampling method also has its advantages, being valuable for making comparisons between sites (Hwang & Turner Citation2005) because traps can be widely distributed throughout different localities. In fact, the methods employed are the most important factor to be taken into account when replicating sampling in different areas (Cardoso et al. Citation2009). In the present study, the replicates and the representative inventory completeness () allow comparisons not only between different habitats but also between localities placed in the same type of habitat. They allow detecting apparent anomalies and therefore avoiding possible misinterpretations, such as considering the mesomediterranean holm oakwood on granite (MHoG) as the most diverse of the sampled habitats, or as the least diverse, depending on which locality is taken into account (). On the other hand, the comparison between the species richness and the values of diversity indices within sampled localities () highlights the idea of diversity as a set of concepts (Peet Citation1974). Thus, a locality which shows a high species richness does not necessarily show high diversity indices values (e.g. locality SOGS1), and vice versa (e.g. locality SHoG3) (). In other words, a given locality can show a high number of present species, but nevertheless a few of them dominate in terms of number of individuals. This is clearly shown by the complementary indices of dominance and equitability (). Locality SOGS1 showed a high number of inventoried species, but its high value of dominance () indicates that a great part of the sampled individuals actually belonged to few dominant species. Consequently, locality SOGS1 showed a low value of equitability (). In fact, despite the high number of fly species which may exploit carrion, those fly assemblages are often dominated by a single or a few species (Beaver Citation1977; Hanski Citation1987; Martín-Vega & Baz Citation2013), being species from the sarcosaprophagous families Calliphoridae, Muscidae and Piophilidae – those which dominated in terms of numbers in the current study (Martín-Vega & Baz Citation2013). By contrast, locality SHoG3, which showed a lower number of inventoried species in comparison with other sampled localities, showed nevertheless a high value of equitability (), thus indicating that the collected individuals were quite distributed among that inventoried species. As a consequence, the value of dominance in locality SHoG3 was lower than other sampled localities (). Hence, it is necessary to consider several parameters in order to draw a more complete assessment of the diversity of a given locality, not only limiting it to the species richness.
If the diversity patterns differ between sampling localities (), then the values of climatic, topographical and land use parameters in each locality may influence the diversity. Among the topographical parameters, the elevation and slope showed a negative relationship with the Shannon diversity index; the relationship was significant in the case of slope and close to significance in the case of elevation (). Although opposite altitudinal effects on diversity can be found within different insect groups (Hodkinson Citation2005), decreasing diversity through increasing elevation has generally been the most accepted pattern (Stevens Citation1992). Elevation affects both the species richness and the species composition of insect communities (Hodkinson Citation2005), although no significant correlation between species richness and elevation has been found for different insect groups in the Mediterranean region (González-Megías et al. Citation2008; Hackenberger et al. Citation2009). In the present study, no significant relationship was found between elevation and species richness; nevertheless, this relationship was negative (). In fact, oromediterranean localities, which corresponded with the highest sampling sites (Table S1), showed a significantly lower number of observed species in comparison with mesomediterranean and supramediterranean habitats. This can also be visualized by the few sarcosaprophagous fly species, which typify oromediterranean habitats, compared with the other bioclimatical levels (Martín-Vega & Baz Citation2013). No significant differences were found, however, in the diversity indices (Shannon index, dominance and equitability) between the three sampled bioclimatical levels. This supports previous results suggesting that high numbers of fly species may exploit carrion at the same time, but the assemblages are often dominated by a single or a few species (Beaver Citation1977; Hanski Citation1987; Martín-Vega & Baz Citation2013).
In accordance with their relationship with elevation (see Results), solar radiation and annual rainfall showed a negative relationship (although this was only significant in the case of solar radiation) with the Shannon diversity index, whereas the relationship between mean temperature and Shannon diversity index was significantly positive (). Insects, as poikilothermic organisms, depend on environmental temperature, which determines their spatial and seasonal distribution. Hence, few sarcosaprophagous fly species are active during the cold season in the Mediterranean region (Martinez-Sanchez et al. Citation2000; Martín-Vega & Baz Citation2013), and most species may overwinter as diapaused larvae (Hwang & Turner Citation2005). On the other hand, during the warmer seasons, many species prefer low elevations, where mean temperatures are consequently higher (Baz et al. Citation2007; Martín-Vega & Baz Citation2013). In such a situation, cool-tolerant species from the families Calliphoridae or Piophilidae occur in cool habitats at higher elevations during warm seasons (Baz et al. Citation2007; Martin-Vega & Baz Citation2011), taking advantage and being the dominant species in those habitats (Martín-Vega & Baz Citation2013).
It is striking to note the significantly negative relationship between the percentage of forest surface and the Shannon’s diversity index, as well as the close-to-significant positive relationship between the percentage of urban surface and the Shannon’s diversity index (). As in many other taxa, the species diversity of Diptera is higher in natural habitats than in urban habitats (McKinney Citation2008). Current results suggest that, within natural habitats, the diversity of sarcosaprophagous Diptera would be higher in those localities which are closer to human activities. A possible explanation may be found precisely in the organic residues associated with those human activities, which may favour the occurrence of synanthropic sarcosaprophagous flies (Nuorteva Citation1963) together with other species more associated with non-urban habitats. Indeed, in Mediterranean agroecosystems, human activities have been a significant diversification agent for those insects which exploit resulting organic residues (Zamora et al. Citation2007). Some synanthropic fly species show, moreover, a wide habitat range and strong dispersal abilities, which enable them to survive in both urban and natural environments (Hwang & Turner Citation2005).
The present study highlights the concept of carrion as a valuable but ephemeral resource, which can be exploited by many sarcosaprophagous fly species (Woodcock et al. Citation2002). Temperature appears to be an important factor determining the species diversity in a particular habitat, as it influences the insect activity and is in accordance with what has been observed for other insect groups in the Mediterranean region (González-Megías et al. Citation2008; Hackenberger et al. Citation2009). Thus, lower numbers of species have been inventoried in those habitats located at higher elevations, where mean temperatures are lower. Also, heterogeneity (as indicated by the Shannon diversity index) appears to decrease with increasing elevation and decreasing temperatures (), but differences between groups of habitats according to the bioclimatical level have been shown to be not significant. Despite the calculation of randomized species richness curves and non-parametric estimators confirming the representativeness of the current inventories, more intensive surveying efforts would be desirable to measure more accurately the sarcosaprophagous Diptera diversity in the natural habitats of central Spain, as well as for a better understanding of these observed patterns. It would also be desirable to have a complete identification of those Diptera families with a complex taxonomy (see Materials and methods). In many studies, taxonomic problems have hindered the determination of species composition from these families (Buck Citation1997). In any case, the dominance of few species in the carrion fly assemblage may be the general trend in every habitat (Martín-Vega & Baz Citation2013). This pattern means that some areas may show high species richness but low diversity index values. Therefore, it is essential to consider several, complementary diversity measurements to obtain a proper assessment of the diversity of a given area.
Table S1.doc
Download MS Word (61 KB)Acknowledgements
We are grateful to those specialists who kindly helped with the identification of some species from some families, namely, Miguel Carles-Tolrá (Barcelona, Spain), Bernhard Merz (Muséum d’Histoire Naturelle, Genève, Switzerland) and Thomas Pape (Natural History Museum, Copenhagen, Denmark). Two anonymous reviewers provided highly useful comments and suggestions on a previous version of the current manuscript. This work was funded by the Ministerio de Ciencia y Tecnología (Spanish Ministry of Science and Technology; Research Project BOS2003-00400) and the University of Alcalá (Research Project PI2003/016). The authors are members of the Instituto Universitario de Investigación en Ciencias Policiales (IUICP) of the University of Alcalá. Survey permission was granted by the Consejería de Medio Ambiente y Ordenación del Territorio of the Madrid Community. DMV was supported by scholarships from the Ministerio de Ciencia y Tecnología (Formación de Profesorado Universitario (FPU) Programme) and the University of Alcalá.
References
- Amendt J, Richards CS, Campobasso CP, Zehner R, Hall MJR. 2011. Forensic entomology: Applications and limitations. Forensic Science, Medicine, and Pathology 7:379–392. doi:10.1007/s12024-010-9209-2.
- Barton PS, Cunningham SA, Lindenmayer DB, Manning AD. 2013. The role of carrion in maintaining biodiversity and ecological processes in terrestrial ecosystems. Oecologia 171:761–772. doi:10.1007/s00442-012-2460-3.
- Baz A, Cifrián B, Díaz-äranda LM, Martín-Vega D. 2007. The distribution of adult blow-flies (Diptera: Calliphoridae) along an altitudinal gradient in Central Spain. Annales de la Société Entomologique de France 43:289–296. doi:10.1080/00379271.2007.10697524.
- Beaver RA. 1977. Non-equilibrium ‘Island’ communities: Diptera breeding in dead snails. The Journal of Animal Ecology 46:783–798. doi:10.2307/3640.
- Braack LEO. 1987. Community dynamics of carrion-attendant arthropods in tropical African woodland. Oecologia 72:402–409. doi:10.1007/BF00377571.
- Buck M. 1997. Sphaeroceridae (Diptera) reared from various types of carrion and other decaying substrates in Southern Germany, including new faunistic data on some rarely collected species. European Journal of Entomology 94:137–151.
- Cardoso P, Henriques SS, Gaspar C, Crespo LC, Carvalho R, Schmidt JB, Sousa P, Szűts T. 2009. Species richness and composition assessment of spiders in a Mediterranean scrubland. Journal of Insect Conservation 13:45–55. doi:10.1007/s10841-007-9116-3.
- Chao A. 2005. Species richness estimation. In: Balakrishnan N, Read CB, Vidakovic B, editors. Encyclopedia of statistical sciences. New York: Wiley. pp. 7909–7916.
- Colwell RK. 2005. EstimateS: Statistical estimation of species richness and shared species from samples, version 7.5. Available: http://viceroy.eeb.ucom.edu/estimates. Accessed Nov 2013 21.
- Colwell RK, Coddington JA. 1994. Estimating terrestrial biodiversity through extrapolation. Philosophical Transactions of the Royal Society B: Biological Sciences 345:101–118. doi:10.1098/rstb.1994.0091.
- González-Megías A, Gómez JM, Sánchez-Piñero F. 2008. Factors determining beetle richness and composition along an altitudinal gradient in the high mountains of the Sierra Nevada National Park (Spain). Ecoscience 15:429–441. doi:10.2980/15-4-3105.
- Gotelli NJ, Colwell RK. 2001. Quantifying biodiversity: Procedures and pitfalls in the measurement and comparison of species richness. Ecology Letters 4:379–391. doi:10.1046/j.1461-0248.2001.00230.x.
- Hackenberger BK, Jarić D, Krčmar S. 2009. Distribution of tabanids (Diptera: Tabanidae) along a two-sided altitudinal transect. Environmental Entomology 38:1600–1607. doi:10.1603/022.038.0611.
- Hanski I. 1987. Carrion fly community dynamics: Patchiness, seasonality and coexistence. Ecological Entomology 12:257–266. doi:10.1111/j.1365-2311.1987.tb01004.x.
- Hodkinson ID. 2005. Terrestrial insects along elevation gradients: Species and community responses to altitude. Biological Reviews 80:489–513. doi:10.1017/S1464793105006767.
- Hwang C, Turner BD. 2005. Spatial and temporal variability of necrophagous Diptera from urban to rural areas. Medical and Veterinary Entomology 19:379–391. doi:10.1111/j.1365-2915.2005.00583.x.
- Jiménez-Valverde A, Hortal J. 2003. Las curvas de acumulación de especies y la necesidad de evaluar la calidad de los inventarios biológicos. Revista Ibérica de Aracnología 8:151–161.
- Keating KA, Quinn JF. 1998. Estimating species richness: The Michaelis-Menten model revisited. Oikos 81:411–416. doi:10.2307/3547060.
- Lloyd M, Ghelardi RJ. 1964. A table for calculating the ‘Equitability’ component of species diversity. The Journal of Animal Ecology 33:217–225. doi:10.2307/2628.
- Martin-Vega D, Baz A. 2011. Variation in the colour of the necrophagous fly, Prochyliza nigrimana (Diptera: Piophilidae): A case of seasonal polymorphism. European Journal of Entomology 108:231–234. doi:10.14411/eje.2011.031.
- Martín-Vega D, Baz A. 2013. Sarcosaprophagous Diptera assemblages in natural habitats in central Spain: Spatial and seasonal changes in composition. Medical and Veterinary Entomology 27:64–76. doi:10.1111/j.1365-2915.2012.01028.x.
- Martinez-Sanchez A, Rojo S, Marcos-Garcia MA. 2000. Annual and spatial activity of dung flies and carrion in a Mediterranean holm-oak pasture ecosystem. Medical and Veterinary Entomology 14:56–63. doi:10.1046/j.1365-2915.2000.00205.x.
- McKinney ML. 2008. Effects of urbanization on species richness: A review of plants and animals. Urban Ecosystems 11:161–176. doi:10.1007/s11252-007-0045-4.
- McNaughton SJ, Wolf LL. 1970. Dominance and the niche in ecological systems. Science 167:131–139. doi:10.1126/science.167.3915.131.
- Melo AS. 2004. A critique of the use of jackknife and related non-parametric techniques to estimate species richness. Community Ecology 5:149–157.
- Michaelis L, Menten M. 1913. Die Kinetic der Invertinwirkung. Biochemische Zeitschrift 49:333–369.
- Morón MA, Terrón RA. 1984. Distribución altitudinal y estacional de los insectos necrófilos en la Sierra Norte de Hidalgo, México. Acta Zoologica Mexicana 3:1–47.
- Ninyerola M, Pons X, Roure JM. 2005. Atlas climático digital de la Península Ibérica. Metodología y aplicaciones en bioclimatología y geobotánica. Bellaterra: Universidad Autónoma de Barcelona.
- Nuorteva P. 1963. Synanthropy of blowflies (Diptera: Calliphoridae) in Finland. Annales Entomologici Fennici 29:1–49.
- Peet RK. 1974. The measurement of species diversity. Annual Review of Ecology and Systematics 5:285–307. doi:10.1146/annurev.es.05.110174.001441.
- Rivas-Martínez S, Gandullo Gutiérrez JM, Allué Andrade JL, Montero de Burgos JL, González Rebollar JL. 1987. Memoria del mapa de series de vegetación de España. Madrid: ICONA. pp. 1–268.
- Stefanescu C, Herrando S, Páramo F. 2004. Butterfly species richness in the north-west Mediterranean Basin: The role of natural and human-induced factors. Journal of Biogeography 31:905–915. doi:10.1111/j.1365-2699.2004.01088.x.
- Stevens GC. 1992. The elevational gradient in altitudinal range: An extension of Rapoport’s latitudinal rule to altitude. The American Naturalist 140:893–911. doi:10.1086/285447.
- Toti DS, Coyle FA, Miller JA. 2000. A structured inventory of Appalachian grass bald and heath bald spider assemblages and a test of species richness estimator performance. Journal of Arachnology 28:329–345. doi:10.1636/0161-8202(2000)028[0329:ASIOAG]2.0.CO;2.
- Woodcock BA, Watt AD, Leather SR. 2002. Aggregation, habitat quality and coexistence: A case study on carrion fly communities in slug cadavers. Journal of Animal Ecology 71:131–140. doi:10.1046/j.0021-8790.2001.00584.x.
- Zamora J, Verdu JR, Galante E. 2007. Species richness in Mediterranean agroecosystems: Spatial and temporal analysis for biodiversity conservation. Biological Conservation 134:113–121. doi:10.1016/j.biocon.2006.08.011.