
Abstract
Pinctada imbricata radiata (Leach, 1814) was the first Lessepsian bivalve reported in the Mediterranean Sea where it is progressively expanding westward. Its native range includes the Indian Ocean and western Atlantic. The present study provides the first insight into the species’ phylogeographic structure, by analysing sequences of a 385-bp region of the mitochondrial gene coding for the subunit I of the cytochrome c oxydase (COI). Sixty-four individuals collected at seven Mediterranean localities were sequenced; in addition, eight COI sequences of individuals from the species’ native range (Persian Gulf) were retrieved from GenBank. Overall, we detected 10 haplotypes. Samples from both the native range and invaded localities were characterised by low levels of haplotype and nucleotide diversity (total h = 0.351, total π = 0.0013). Significant genetic divergence was found between Persian Gulf and Mediterranean Sea samples, whereas very shallow genetic structuring was observed within the Mediterranean study area. Moreover, no pattern of isolation by distance was detected in the Mediterranean. From a historical demography perspective, our results on Mediterranean samples were consistent with a very recent, or even ongoing, demographic expansion. Range expansion of exotic thermophilic species in this area is a widely observed phenomenon that many authors have related to global warming.
Introduction
Biological invasions represent unique opportunities for understanding both ecological and genetic processes, and molecular techniques can be applied to alien species, in order to gather information on several problems such as the definition of colonisation routes and source populations, dispersal patterns and community interactions (Lawson Handley et al. Citation2011 and references therein). A large number of marine invaders reached the Mediterranean Sea from the Red Sea through the Suez Canal (Lessepsian migration) (Por Citation1978), becoming a case study for marine bioinvasion research and generating dramatic modifications in the local communities (Por Citation1978; Galil Citation2000).
The rayed pearl oyster Pinctada imbricata radiata (Leach, 1814) is distributed in coastal habitats of the Indian Ocean, including Red Sea and Persian Gulf regions, and the western Atlantic Ocean (Cunha et al. Citation2011). It was the first Lessepsian bivalve migrant to be recorded in the Mediterranean Sea, although it was initially reported as Meleagrina savignyi (Monterosato, 1878). Despite a certain degree of confusion with its taxonomic status, P. imbricata radiata is currently the most used specific denomination for this bivalve. The earliest records of this species in the Mediterranean Sea were from Tunisian, Maltese and Greek waters in 1895, 1912 and 1963, respectively (Zenetos et al. Citation2003); however, the mechanism of its introduction into these areas is still being debated. The first individuals probably arrived via shipping, either as adults in biofouling communities, or as larvae in ballast waters (Zibrowius Citation1992). The pelagic larval phase of Pinctada species lasts about 3 weeks (Gervis & Sims Citation1992), suggesting a high potential for species’ dispersal. In addition, its geographic distribution within the Mediterranean Sea is presumed to be expanding westward, as observed for other Lessepsian species, such as, for instance, the seagrass Halophila stipulacea (Forsskål) Ascherson, 1867 (Procaccini et al. Citation1999), the bivalve Brachidontes pharaonis (P. Fischer, 1870) (Sarà et al. Citation2008) and the fish Fistularia commersonii Rüppell, 1838 (Pais et al. Citation2007). It is widely accepted that the process of expansion can be a consequence of global warming (Bianchi & Morri Citation2000; Bianchi Citation2007; Occhipinti-Ambrogi Citation2007; Occhipinti-Ambrogi & Galil Citation2010).
With the present study, we provided the first molecular insight into the species’ phylogeographic structure in the Eastern Mediterranean Sea. Our work is aimed at assessing the validity of the hypothesis that individuals of an invasive species established in a new range should be characterised by low levels of genetic heterogeneity. To accomplish this objective, we analysed individuals of P. imbricata radiata collected at seven Mediterranean localities along with some sequences from the native range available in GenBank. As a genetic marker, we used a fragment of the mitochondrial gene coding for the subunit I of cytochrome c oxidase (COI), a molecular marker extensively used for population genetic and phylogeographic purposes.
Materials and methods
A total of 64 individuals were sampled at the following seven Mediterranean localities: two sites in Israel approximately 30 km apart, Ashkelon (31°40ʹ44″N, 34°33ʹ7″E; N = 4) and Palmachim (31°56ʹ00″N, 34°42ʹ02″E; N = 6); Xylofagou, Cyprus (34°56ʹ31″N, 33°51ʹ31″E; N = 7); Agios Nikolaos, Crete (35°11ʹ36″N, 25°43ʹ59″E; N = 9); two sites in Malta approximately 5 km apart, Qalet Marku (35°56ʹ46″N, 14°26ʹ57″E; N = 13) and Bahar ic-Caghaq (35°56ʹ30″N, 14°27ʹ28″E; N = 15); and Ghannouch, Tunisia (33°56ʹ07″N, 10°5ʹ08″E; N = 10) (). The specimens were collected by SCUBA divers, shells were successively removed and soft tissues were stored at −20°C in absolute ethanol.
Figure 1. Pinctada imbricata radiata. Location of sampling sites. AN: Agios Nikolaos; AS: Ashkelon; BC: Bahar ic-Caghaq; GA: Ghannouch; PA: Palmachim; QM: Qalet Marku; XY: Xylofagou.
For each specimen, a small piece of the adductor muscle (~10 mg) was excised and used for genomic DNA extraction. Extractions were carried out using Sigma-Aldrich GenEluteTM Mammalian Genomic DNA Miniprep Kit. COI was amplified using the specific primers LCX (5′-TCG TATAGA GCT CCG TCG ACC TG-3′) and HCY (5ʹ-TGG AAC AAA ACT GGA TCG CC -3ʹ) designed by Arnaud-Haond et al. (Citation2000). Polymerase chain reaction (PCR) amplifications were carried out in 20-μL reactions using 1× PCR buffer, 2.5 mM of magnesium chloride, 0.2 mM of each deoxynucletide triphosohate (dNTP), 0.6 μM of each primer and 0.2 U of PerfectTaq DNA polymerase (5 PRIME). The following profile modified from Cunha et al. (Citation2011) was applied: an initial denaturing step at 94°C for 4 min; 35 cycles of denaturing at 94°C for 1 min, annealing at 45°C for 1 min and extending at 72°C for 1 min; and a final extending step at 72°C for 5 min. A negative control was included for each reaction. Amplification products were checked with 1.2% agarose gel electrophoresis and sent to Macrogen Europe for sequencing.
In addition to the sequences obtained in the present work, eight COI sequences were downloaded from GenBank and added to our data set. All downloaded sequences were obtained from individuals sampled in the United Arab Emirates: four from an unreported location (Cunha et al. Citation2011; GenBank accession nos. GQ355875, GQ355876, GQ355877, GQ355878), and four from the Persian Gulf, Ras al-Khaimah (Meyer et al. Citation2013; GenBank accession nos. KF284059, KF284060, KF284061, KF284062). Overall, the data set included 72 COI sequences. Hereafter, Cunha et al.’s (Citation2011) and Meyer et al.’s (Citation2013) samples are denominated CU and ME, respectively.
Sequences were scored with Chromas Lite (http://technelysium.com.au) and aligned using CLUSTALX 2.0 (Larkin et al. Citation2007); subsequently, they were checked and edited in BioEdit 7.0 (Hall Citation1999). Neither insertions nor deletions were found in the sequenced region. We used the likelihood ratio test implemented in jModelTest 0.1.1 (Posada Citation2008) in order to assess the best model of evolution for our sequences under the Akaike Information Criterion (AIC). DnaSP v. 5.10.1 (Librado & Rozas Citation2009) was used to calculate haplotype diversity (h) and nucleotide diversity (π) for each local sample and the total data set. The contributions of single samples to total gene diversity (CT) were computed according to the method described by Petit et al. (Citation1998), as implemented in the software CONTRIB v. 1.02 (available at https://www6.bordeaux-aquitaine.inra.fr/biogeco_eng/Scientific-Production/Computer-software/Contrib-Permut/Contrib). This rarefaction-based method partitions the relative contribution of each sample to both total gene diversity (CS) and among-sample genetic divergence (CD). Rarefaction was set to the smallest sample size (N = 4).
The relationships between haplotypes were analysed by means of a median-joining network (Bandelt et al. Citation1999), using the software NETWORK 4.611 (www.fluxus-engeneering.com). Estimates of genetic divergence among sampling sites were calculated by employing the fixation index ΦST (Excoffier et al. Citation1992), an analogue of Wright’s (Citation1949) fixation index FST, as implemented in Arlequin v. 3.5 (Excoffier & Lischer Citation2010). Estimates of female gene flow between regions were obtained through the formula Nfm = 0.5[(1/ΦST) − 1] (Hartl & Clark Citation1997). The significance of variance components and Φ-statistics values were assessed by permutation tests with 10,000 replicates. The correlation between the matrices of pairwise ΦST-values between Mediterranean samples and minimal nautical distances between sampling locations was assessed by the Mantel test (10,000 replicates), as implemented in the IBDWS programme v. 3.23 (Jensen et al. Citation2005). Pairwise geographic distances between collection sites were estimated using Google Earth v. 7.1.5.1557 (https://www.google.com/earth/).
Hierarchical analysis of molecular variance (AMOVA) as implemented in Arlequin v. 3.5 (Excoffier et al. Citation1992) was used to partition genetic variance into the (1) within-sample and (2) among-sample components. A second analysis including three hierarchical levels was conducted by pooling samples in three different groupings, according to the geographic area from which they originated, in order to detect the occurrence of genetic structuring at a broader geographic scale, and the possible divergence between Mediterranean Sea and Indian Ocean samples. The first region included samples from the United Arab Emirates, the second region samples from Israel, Cyprus, and Crete, and the third region samples from Malta and Tunisia. A third AMOVA analysis was carried out considering Mediterranean samples only, in order to eliminate the effect of divergence between native and non-native populations and to assess the occurrence of possible genetic structuring within the Mediterranean Sea. Grouping criteria were established according to the Mediterranean biogeographic sectors proposed by Bianchi (Citation2007).
The demographic history of the Mediterranean rayed pearl oyster population was inferred through the analysis of the distribution of the number of site differences between pairs of sequences (mismatch distribution), as implemented in Arlequin v. 3.5. Expected values for a model of sudden expansion (Rogers Citation1995) were calculated and plotted against the observed values (Rogers & Harpending Citation1992). The sum of squared deviations (SSD) and Harpending’s (Citation1994) raggedness index (r) were used to evaluate the sudden expansion model. In addition, to test for population expansion, we computed two other tests: Fu’s (Citation1997) FS, and Ramos-Onsins & Rozas’ (Citation2002) R2.
Results
The 64 COI sequences obtained, aligned and trimmed to 416 bp corresponded to 12 haplotypes (GenBank accession nos. KT768194-KT768203). After alignment and trimming with the eight sequences downloaded from GenBank, their length was reduced to 385 bp. This procedure determined the loss of two polymorphic sites that were present in the data set of the newly analysed individuals, resulting in a total of 10 haplotypes (). For the total data set, the best-fit model of nucleotide substitution detected by jModelTest was F81 (Felsenstein Citation1981) with fA = 0.214, fC = 0.171, fG = 0.257 and fT = 0.358. Considering the total data set, 10 polymorphic sites were found (2.6% of the 385-bp sequence). COI haplotypes H1, H3, H4, H5 and H6 were newly found for the species. The two samples from the native range displayed a particular pattern, with the four ME sequences all identical and corresponding to the haplotype H2; conversely, the CU sequences were all different and found only in that location (; ). As regards the Mediterranean individuals, the haplotype H2 was shared by all samples. Each of the considered locations exhibited two haplotypes (). Haplotype diversity values ranged from h = 0.133 (Bahar ic-Caghaq, BC) to 0.667 (Ashkelon, AS). Nucleotide diversity was low, with values ranging from π = 0.0004 (BC) to 0.0017(AS) (). Overall estimates of genetic diversity within the Mediterranean were low, with h = 0.287 ± 0.073 and π = 0.0008 ± 0.0002 (). The samples CU and AS provided positive values of relative contributions to the within-population component of gene diversity, whilst positive values for the among-population genetic divergence were detected in CU, Agios Nikolaos (AN) and AS ().
Table I. Pinctada imbricata radiata. List of cytochrome c oxydase subunit I (COI, 385bp) haplotypes detected in the nine localities considered. AS: Ashkelon; PA: Palmachim; XY: Xylofagou; AN: Agios Nikolaos; BC: Bahar ic-Caghaq; QM: Qalet Marku; GA: Ghannouch; CU: Cunha et al. (Citation2011); ME: Meyer et al. (Citation2013).
Figure 2. Pinctada imbricata radiata. Median-joining network of cytochrome c oxydase subunit I (COI) haplotypes. The area of each circle is proportional to the number of individuals exhibiting that haplotype. Mutated site positions between haplotypes are reported with numbers on the network branches. AS: Ashkelon; PA: Palmachim; XY: Xylofagou; BC: Bahar ic-Caghaq; QM: Qalet Marku; AN: Agios Nikolaos; GA: Ghannouch; CU: Cunha et al. (Citation2011); ME: Meyer et al. (Citation2013).
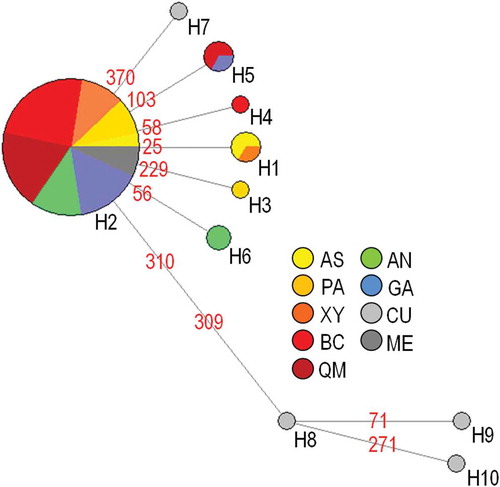
Table II. Pinctada imbricata radiata. Estimates of genetic diversity for COI (385 bp) sequences. Sample size (N), number of polymorphic sites (Ns), number of haplotypes (Nh), haplotype diversity (h) and nucleotide (π) diversity for each locality and the total.
Figure 3. Pinctada imbricata radiata. Contribution to total gene diversity of each sample. White bars indicate the contribution of the sample to total within-sample gene diversity (CS), while grey bars measure the contribution to the among-sample genetic divergence (CD). The black dots on the bars indicate the contribution to total gene diversity (CT) of that sample. AS: Ashkelon; PA: Palmachim; XY: Xylofagou; AN: Agios Nikolaos; BC: Bahar ic-Caghaq; QM: Qalet Marku; GA: Ghannouch; CU: Cunha et al. (Citation2011); ME: Meyer et al. (Citation2013).
The median-joining network showed one high-frequency and geographically widespread haplotype (H2; ), which was present in 58 (= 81%) of individuals sampled across the whole study area. With the exception of H9 and H10, all the remaining haplotypes were directly connected with H2, consistently with a star-like phylogeny, indicative of a past demographic expansion event (Avise Citation2000). A relatively high number of private haplotypes (six out of 10) was found; however, four of those were detected by Cunha et al. (Citation2011) in a sample from Persian Gulf.
Significant levels of genetic divergence were found between AS and BC and between CU and all other samples, with the exception of the comparison with AS and ME (). The highest levels of female gene flow were found among Xylofagou (XY) and Palmachim (PA), whereas the lowest values of Nfm were observed between CU and most of the other samples (). Mantel test carried out on matrixes of pairwise ФST values and minimum nautical distances produced a Z = 3775.483 (P = 0.084) that allowed us to reject the presence of isolation by distance in the study area.
Table III. Pairwise ΦST values between Pinctada imbricata radiata sampling localities (below diagonal) and estimates of female gene flow (Nfm, above diagonal). Significance of ΦST values was assessed by a permutation test with 10,000 replicates.
The two-level AMOVA assigned the largest portion of molecular variance (67.8%) to the “among individuals within localities” level, whereas the remainder (32.2%) was attributed to the “among localities” level, with an associated value of ФST = 0.322, which was highly significant by permutation test (). The three-level AMOVA assigned a fraction of molecular variance to the “within samples” level (64.9%) that was similar to the value given by the two-level analysis; the “among regions” and “among samples within regions” were characterised by 13.3% and 21.8% of the variance, respectively (). The Ф-statistics parameters were all significantly greater than zero (). The second three-level AMOVA, which considered only two regions within the Mediterranean Sea, assigned 86.6% of molecular variance to the “within samples” level, 2.7% to the “among Mediterranean regions” level and 10.7% to the “among samples within Mediterranean regions” level (). The Ф-statistics parameter associated with the “among regions” level was not significantly greater than zero, while ФSC and ФST were ().
Table IV. Pinctada imbricata radiata. Hierarchical analyses of molecular variance (AMOVA) computed from the matrix of Tamura and Nei’s (Citation1993) genetic distances. Two levels were considered in the first analysis, whereas in the second analysis the “region” level was added. In the third analysis, only samples from Mediterranean Sea were considered. Probability values were obtained after a permutation test with 10,000 replicates.
The mismatch distribution for the Mediterranean population showed a high degree of consistency with the curve expected under the Rogers (Citation1995) model of sudden demographic expansion. Accordingly, both SSD and r were not significant. This result was confirmed by significant values of Fu’s (Citation1997) FS and Ramos-Onsins and Rozas’ (Citation2002) R2 tests ().
Figure 4. Pinctada imbricata radiata. Frequency distribution (grey bars) of the number of pairwise nucleotide differences (mismatch) between cytochrome c subunit I (COI) haplotypes for the Mediterranean data set. The solid line is the theoretical distribution under the assumption of population expansion. SSD: sum of squared differences in mismatch analysis; r: Harpending’s (Citation1994) raggedness index; FS: Fu’s (Citation1997) statistics; R2: Ramos-Onsins and Rozas’ (Citation2002) statistics. Probability values were obtained after permutation tests with 100,000 replicates.
Discussion
The majority of Lessepsian bioinvaders do not show a reduction of genetic diversity after their introduction into the Mediterranean (Bernardi et al. Citation2010). Pinctada imbricata radiata can be included in the minority of those Lessepsian species that exhibit low levels of genetic diversity in the invaded areas, as indicated by the low values of both haplotype and nucleotide diversity. Haplotypes differed by only one or two substitutions, as usually occurs in areas of introduction of alien species, as in the case of Corbicula fluminea (O.F. Müller, 1774) populations that have invaded two Portuguese estuaries (Sousa et al. Citation2007). Samples of P. imbricata radiata from Ashkelon and from Cunha et al. (Citation2011) mostly contribute to the degree of haplotype diversity detected. Similar low levels of polymorphism were detected in American populations of the Asian green mussel Perna viridis (Linnaeus, 1758) (Gilg et al. Citation2013), and are comparable to those detected in Californian invasive populations of the bivalve Gemma gemma (Totten, 1834) (Hoos et al. Citation2010). On the other hand, other invasive species exhibit high levels of polymorphism, like Mediterranean populations of the gastropod Aplysia dactylomela Rang, 1828 (Valdés et al. Citation2013), estuarine northwestern USA populations of the bivalve Arcuatula senhousia (Benson in Cantor, 1842) (Asif & Krug Citation2012) and estuarine Mediterranean populations of the bivalve Xenostrobus securis (Lamarck, 1819) (Barbieri Citation2011). Moreover, the high level of polymorphism detected in Cunha et al.’s (Citation2011) sample suggested that the species could harbour a higher degree of genetic variability in its native range, as expected for native populations of an alien species (Allendorf & Lundquist Citation2003). Nonetheless, the sample from Meyer et al. (Citation2013), coming from the Persian Gulf, shows the lowest level of diversity. The “Hedgecock effect”, due to the sweepstakes-like chance of reproductive success (Hedgecock Citation1994), could account for the reduced level of genetic diversity found in our work. We excluded the occurrence of sampling error due to low sample size, as the genetic diversity estimates () were consistent with those reported by Al-Saadi (Citation2013), who analysed a total of 107 individuals collected at three closely located sites within the species’ native range (Persian Gulf), obtaining estimates of genetic diversity ranging from h = 0.094 to 0.470. Low levels of genetic diversity observed in Mediterranean samples of P. imbricata radiata may have derived from a founder effect. However, many recent studies have revealed that the relation between genetic diversity and invasion success of aquatic species is weak (reviewed in Roman & Darling Citation2007). The presence of P. imbricata radiata in the Mediterranean has been well known since the late nineteenth century, but, as yet, the species has not experienced a wide geographic expansion in this sea, being mostly confined to the eastern part of the basin. Considering the main ecological differences between the western and eastern basins of the Mediterranean Sea (Sarà Citation1985), another potentially non-exclusive explanation is that the eastern basin environmental conditions might be more consistent with the species’ ecological requirements.
As regards the species’ genetic structure, the AMOVAs indicated significant genetic heterogeneity in the whole study area and, to a much lesser extent, within the Eastern Mediterranean. A tendency toward genetic homogeneity within the invaded area is a common feature of alien species, as it is widely believed that their spread into a new region would induce enough gene flow to counteract the onset of genetic structuring (Biedrzycka et al. Citation2014). The time since initial invasion is another crucial factor to consider when studying alien species’ genetic structure in their non-native range. In this regard, no evidence of genetic structuring has been found in other invasive bivalves such as X. securis, perhaps because populations of this species have not had enough time to diverge (Barbieri Citation2011). Nonetheless, examples of genetic structuring among non-native populations of bivalve species do exist, as in the case of Ruditapes philippinarum (Adams & Reeve, 1850) (Chiesa et al. Citation2011) and A. senhousia (Asif & Krug Citation2012). Non-native populations can diverge after spreading due to random drift or natural selection (Biedrzycka et al. Citation2014). Another possible explanation is that, due to multiple colonization events, invasive populations may originate from different source populations that were already structured in their native range (Roman & Darling Citation2007). Given the long period P. imbricata radiata spent in the Mediterranean Sea, we believe that drift could have played a role in shaping its genetic architecture. As evidenced by our work, we found a major genetic break separating Mediterranean Sea and Persian Gulf samples. Such an outcome is supported by the low values of female gene flow calculated among samples from the two basins. Also, significant values of ΦST were found between the sample by Cunha et al. (Citation2011) and all other samples, with the exception of Meyer et al. (Citation2013), indicating a degree of isolation. Samples that provided positive contributions to the among-sample genetic divergence were Ashkelon and those from Cunha et al. (Citation2011) (). A situation far from the migration-drift equilibrium could account for the inconsistency of P. imbricata radiata Mediterranean samples with the isolation-by-distance model (Hutchison & Templeton Citation1999). Moreover, other mechanisms, such as for instance secondary introductions due to human-mediated translocations, could hinder the settlement of the isolation-by-distance pattern within the invaded area.
Our study highlighted that a demographic expansion of P. imbricata radiata occurred in the Mediterranean study area. Rogers and Harpending (Citation1992) reported that the closer the maximum of the mismatch curve is to the vertical axis, the more recent was the population expansion. The trend of the mismatch distribution suggests the demographic expansion is very recent or even ongoing (). The expansion of exotic thermophilic species in the Mediterranean Sea is a widely observed phenomenon that some authors related to global warming (Bianchi & Morri Citation2000; Bianchi Citation2007; Occhipinti-Ambrogi Citation2007; Occhipinti-Ambrogi & Galil Citation2010).
The present work represents an initial investigation of the genetic diversity of Mediterranean and native populations of P. imbricata radiata. The results obtained need confirmation by means of a broader sampling design and the use of different classes of genetic markers.
Acknowledgements
We wish to thank the following colleagues for providing local samples: D. Angel (Ashkelon, Palmachim), D.P. Cilia and G. Fabrizio (Bahar ic-Caghaq, Qalet Marku), C. Jimenez (Xylofagou), S. Tlig-Zouari (Ghannouch) and A. Zenetos (Agios Nikolaos).
This study was made possible through funds released through the PANACEA project funded within the Italia–Malta 2007–2013 Operational Programme I (www.panaceaproject.net).
References
- Allendorf FW, Lundquist LL. 2003. Introduction: Population biology, evolution, and control of invasive species. Conservation Biology 17:24–30. doi:10.1046/j.1523-1739.2003.02365.x.
- Al-Saadi A. 2013. Population structure and patterns of genetic variation in a pearl oyster (Pinctada radiata) native to the Arabian Gulf. MSc Dissertation, Queensland University of Technology Brisbane, Australia
- Arnaud-Haond S, Monteforte M, Galtier N, Bonhomme F, Blanc F. 2000. Population structure and genetic variability of pearl oyster Pinctada mazatlanica along Pacific coasts from Mexico to Panama. Conservation Genetics 1:299–308. doi:10.1023/A:1011575722481.
- Asif JH, Krug PJ. 2012. Lineage distribution and barriers to gene flow among populations of the globally invasive marine mussel Musculista senhousia. Biological Invasions 14:1431–1444. doi:10.1007/s10530-011-0169-6.
- Avise JC. 2000. Phylogeography: The history and formation of species. Cambridge, MA: Harvard University Press.
- Bandelt HJ, Forster P, Röhl A. 1999. Median-joining networks for inferring intraspecific phylogenies. Molecular Biology and Evolution 16:37–48. doi:10.1093/oxfordjournals.molbev.a026036.
- Barbieri M. 2011. Genetic diversity in brackish-water environments as revealed by mitochondrial markers in three species with different ecological traits. PhD Dissertation, Pisa, Italy: University of Pisa.
- Bernardi G, Golani D, Azzurro E. 2010. The genetics of Lessepsian bioinvasions. In: Golani D, Appelbaum-Golani B, editors. Fish invasions of the Mediterranean Sea: change and renewal. Sofia-Moscow: Pensoft Publishers. pp. 71–84.
- Bianchi CN. 2007. Biodiversity issues for the forthcoming tropical Mediterranean Sea. Hydrobiologia 580:7–21. doi:10.1007/s10750-006-0469-5.
- Bianchi CN, Morri C. 2000. Marine biodiversity of the Mediterranean Sea: Situation, problems and prospects for future research. Marine Pollution Bulletin 40:367–376. doi:10.1016/S0025-326X(00)00027-8.
- Biedrzycka A, Zalewski A, Bartoszewicz M, Okarma H, Jędrzejewska E. 2014. The genetic structure of raccoon introduced in Central Europe reflects multiple invasion pathways. Biological Invasions 16:1611–1625. doi:10.1007/s10530-013-0595-8.
- Chiesa S, Nonnis Marzano F, Minervini G, De Lucrezia D, Baccarani G, Bordignon G, Poli I, Ravagnan G, Argese E. 2011. The invasive manila clam Ruditapes philippinarum (Adams & Reeve, 1850) in Northern Adriatic Sea: Population genetics assessed by an integrated molecular approach. Fisheries Research 110:259–267. doi:10.1016/j.fishres.2011.04.013.
- Cunha RL, Blanc F, Bonhomme F, Arnaud-Haond S. 2011. Evolutionary patterns in pearl oysters of the genus Pinctada (Bivalvia: Pteriidae). Marine Biotechnology 13:181–192. doi:10.1007/s10126-010-9278-y.
- Excoffier L, Lischer HEL. 2010. Arlequin suite ver. 3.5: A new series of programs to perform population genetics analyses under Linux and Windows. Molecular Ecology Resources 10:564–567. doi:10.1111/j.1755-0998.2010.02847.x.
- Excoffier L, Smouse PE, Quattro JM. 1992. Analysis of molecular variance inferred from metric distances among DNA haplotypes: Application to human mitochondrial DNA restriction data. Genetics 131:479–491.
- Felsenstein J. 1981. Evolutionary trees from DNA sequences: A maximum likelihood approach. Journal of Molecular Evolution 17:368–376. doi:10.1007/BF01734359.
- Fu YX. 1997. Statistical tests of neutrality of mutations against population growth, hitchhiking and background selection. Genetics 147:915–925.
- Galil BS. 2000. A sea under siege - alien species in the Mediterranean. Biological Invasions 2:177–186. doi:10.1023/A:1010057010476.
- Gervis MH, Sims NA. 1992. The biology and culture of pearl oysters (Bivalvia: Pteriidae). London, UK: ICLARM Stud. Rev. 21. ODA.
- Gilg MR, Johnson EG, Gobin J, Bright BM, Ortolaza I. 2013. Population genetics of introduced and native populations of the green mussel, Perna viridis: Determining patterns of introduction. Biological Invasions 15:459–472. doi:10.1007/s10530-012-0301-2.
- Hall T. 1999. BioEdit: A user-friendly biological sequence alignment editor and analysis program for Windows 95/98/NT. Nucleic Acids Symposium Series 41:95–98.
- Harpending RC. 1994. Signature of ancient population growth in a low-resolution mitochondrial DNA mismatch distribution. Human Biology 66:591–600.
- Hartl DL, Clark AG. 1997. Principles of population genetics. Sunderland, MA: Sinauer Associates.
- Hedgecock D. 1994. Does variance in reproductive success limit effective population sizes of marine organisms? In: Beaumont AR, editor. Genetics and evolution of aquatic organisms. London, UK: Chapman and Hall. pp. 122–134.
- Hoos P, Geller J, Ruiz G, Miller W, Vrijenhoek RC. 2010. The introduction of western Atlantic Gemma gemma to California: Comparing inferences from genetic ad historical data. Biological Invasions 16:582–592.
- Hutchison DW, Templeton AR. 1999. Correlation of pairwise genetic and geographic distance measures: Inferring the relative influences of gene flow and drift on the distribution of genetic variability. Evolution 53:1898–1914. doi:10.2307/2640449.
- Jensen J, Bohonak A, Kelley S. 2005. Isolation by distance, web service. BMC Genetics 6:13. doi:10.1186/1471-2156-6-13.
- Larkin MA, Blackshields G, Brown NP, Chenna R, McGettigan PA, McWilliam H, Valentin F, Wallace IM, Wilm A, Lopez R, Thompson JD, Gibson TJ, Higgins DG. 2007. Clustal W and Clustal X version 2.0. Bioinformatics 23:2947–2948. doi:10.1093/bioinformatics/btm404.
- Lawson Handley L-J, Estoup A, Evans DM, Thomas CE, Lombaert E, Facon B, Aebi A, Roy HE. 2011. Ecological genetics of invasive alien species. BioControl 56:409–428. doi:10.1007/s10526-011-9386-2.
- Librado P, Rozas J. 2009. DnaSP v5: A software for comprehensive analysis of DNA polymorphism data. Bioinformatics 25:1451–1452. doi:10.1093/bioinformatics/btp187.
- Meyer JB, Cartier LE, Pinto-Figueroa EA, Krzemnicki MS, Hänni HA, McDonald BA. 2013. DNA fingerprinting of pearls to determine their origins. Plos One. doi:10.1371/journal.pone.0075606.
- Occhipinti-Ambrogi A. 2007. Global change and marine communities: Alien species and climate change. Marine Pollution Bulletin 55:342–352. doi:10.1016/j.marpolbul.2006.11.014.
- Occhipinti-Ambrogi A, Galil B. 2010. Marine alien species as an aspect of global change. Advances in Oceanography and Limnology 1:199–218. doi:10.1080/19475721003743876.
- Pais A, Merella P, Follesa MC, Garippa G. 2007. Westward range expansion of the Lessepsian migrant Fistularia commersonii (Fistulariidae) in the Mediterranean Sea, with notes on its parasites. Journal of Fish Biology 70:269–277. doi:10.1111/jfb.2007.70.issue-1.
- Petit RJ, El Mousadik A, Pons O. 1998. Identifying populations for conservation on the basis of genetic markers. Conservation Biology 12:844–855. doi:10.1046/j.1523-1739.1998.96489.x.
- Por FD. 1978. Lessepsian migration. The influx of Red Sea biota into the Mediterranean by way of the Suez Canal. Ecological studies. Vol. 23. Berlin, Germany: Springer Verlag.
- Posada D. 2008. jModelTest: Phylogenetic model averaging. Molecular Biology and Evolution 25:1253–1256. doi:10.1093/molbev/msn083.
- Procaccini G, Acunto S, Famà P, Maltagliati F. 1999. Structural, morphological and genetic variability in Halophila stipulacea (Hydrocharitaceae) populations in the western Mediterranean. Marine Biology 135:181–189. doi:10.1007/s002270050615.
- Ramos-Onsins SE, Rozas J. 2002. Statistical properties of new neutrality tests against population growth. Molecular Biology and Evolution 19:2092–2100. doi:10.1093/oxfordjournals.molbev.a004034.
- Rogers AR. 1995. Genetic evidence for a Pleistocene population explosion. Evolution 49:608–615. doi:10.2307/2410314.
- Rogers AR, Harpending H. 1992. Population growth makes waves in the distribution of pairwise genetic differences. Molecular Biology and Evolution 9:552–569.
- Roman J, Darling JA. 2007. Paradox lost: Genetic diversity and the success of aquatic invasions. Trends in Ecology & Evolution 22:454–464. doi:10.1016/j.tree.2007.07.002.
- Sarà M. 1985. Ecological factors and their biogeographic consequences in the Mediterranean ecosystems. In: Moraitou-Apostolopoulou M, Kiortsis V, editor. Mediterranean marine ecosystems. New York, NY: Plenum Press. pp. 1–17.
- Sarà G, Romano C, Mazzola A. 2008. A new Lessepsian species in the western Mediterranean (Brachidontes pharaonis Bivalvia: Mytilidae): Density, resource allocation and biomass. Marine Biodiversity Records. doi:10.1017/S175526720600087X.
- Sousa R, Freire R, Rufino M, Méndez J, Gaspar M, Antunes C, Guilhermino L. 2007. Genetic and shell morphological variability of the invasive bivalve Corbicula fluminea (Müller, 1774) in two Portuguese estuaries. Estuarine, Coastal and Shelf Science 74:166–174. doi:10.1016/j.ecss.2007.04.011.
- Tamura K, Nei M. 1993. Estimation of the number of nucleotide substitutions in the control region of mitochondrial DNA in humans and chimpanzees. Molecular Biology and Evolution 10:512–526.
- Valdés A, Alexander J, Crocetta F, Yokes MB, Giacobbe S, Poursanidis D, Zenetos A, Cerera JL, Caballer M, Galil BS, Schembri PJ. 2013. The origin and dispersal pathway of the spotted sea hare Aplysia dactylomela (Mollusca: Opisthobranchia) in the Mediterranean Sea. Aquatic Invasions 8:427–436. doi:10.3391/ai.2013.8.4.06.
- Wright S. 1949. The genetical structure of populations. Annals of Eugenics 15:323–354. doi:10.1111/j.1469-1809.1949.tb02451.x.
- Zenetos A, Gofas S, Russo G, Templado J. 2003. CIESM Atlas of exotic species in the Mediterranean. Molluscs. Vol. 3. Monaco, Germany: CIESM Publishers.
- Zibrowius H. 1992. Ongoing modifications on the Mediterranean marine fauna and flora by the establishment of exotic species. Mesogée 51:83–107.