
ABSTRACT
The effect of iwi community justice panels is assessed using data from seven years of implementation. Panel participants of 1013 are compared to a control group drawn from 73,000 offenders charged with similar offences and propensity-matched by age, gender, ethnicity, offending history and location. The dependent measure is re-harm from offending calculated using the NZ Crime Harm Index. Panel participants did not reduce their rate of offending compared to matched controls. However, there is a significant reduction in harm from post-panel offending, on average by 26.9 ± 21.05 equivalised prison days. The relative reduction is 22.25% of the harm committed by matched controls. Iwi panels are an effective alternative justice resolution. Panel participants are found to re-offend with minor offences and thus any focus on rates of offending would miss the complexity of the restorative justice process that reduces the harm of re-offending.
Introduction
Turning to Māori for solutions to low-level offending recognises a persistent over-representation of Māori in New Zealand’s criminal justice system (Fergusson et al. Citation2003; Marie Citation2010; Shepherd and Ilalio Citation2016). New Zealand has had noted success with alternative resolutions, such as family group conferences, that were developed based on Māori principles and practices (UN Office on Drugs and Crime Citation2006). Iwi Community panels similarly include Maori community-leaders’ desires to have more voice in the justice process. The expansion of the panels signifies a political imperative to address systemic bias towards Māori and reduce the burden on the criminal justice system. Notwithstanding the intent, restorative justice alternatives like iwi panels are controversial, with some recent critical analysis arguing New Zealand’s model has little evidence of any real impact on re-offending (Wood Citation2015).
Iwi panels provide an alternative justice resolution process for all people who commit low-level offences (with a penalty of less than six months imprisonment, not methamphetamine or family violence-related), who are aged 17 years or older and have accepted responsibility for the offence. The arresting officer may recommend that the person attend an iwi panel as opposed to going through the courts.
Although ‘restorative justice’ is contentious to define (Daly Citation2002), an iwi panel may be considered a form of restorative justice. The panels attempt to address some of the limitations of the existing adversarial criminal justice system (Zehr Citation2015). At its core, restorative justice aims to, ‘repair the damage created by criminal offending and restore the balance of relationships within the society’ (Maxwell Citation2004, p. 5). Restorative justice focuses on the harm caused, the fact that those harms result in obligations, and that there are underlying principles of engagement and participation from victims, offenders and members of the community (Zehr Citation2015).
Iwi panels are underpinned by tikanga Māori customs and kaupapa Māori worldviews (Akroyd et al. Citation2016) and therefore most include mihi (formal greetings), karakia (prayer); kai (food); and, whakawhanaungatanga (the establishment of relationships) (translations from Ka'ai et al. Citation2004). Although aspects of pre-colonisation restorative practices are an important feature of all iwi panels, they also amalgamate many aspects of the colonial adversarial justice system (Latimer et al. Citation2005). Critical commentary has identified that the panels are a response to a need for a culturally appropriate solution, not a form of justice derived from Māori practices (Daly Citation2002).
Despite being observed for more than thirty years, a bias against Māori is still obvious in New Zealand when over half of all men incarcerated are Māori, and when Māori represent only 15.1% of the population. The over-representation is even more prominent for Māori women who make up 63% of the women’s prison population Akroyd, et al (Citation2016). The present research observes approximately one-quarter of the iwi panel participants are young Māori offenders (less than 25 years old). Studies have established that Māori youth are three times more likely to be apprehended, prosecuted and convicted than non-Māori youth who commit the same offence (Owens Citation2001). However, it is also important to recognise that iwi panels provide an alternative resolution regardless of the ethnicity of those involved, with 55-60% of offenders referred to a panel not identifying as Māori.
By 2014 an initial scheme piloted in Christchurch in 2010 was expanded to four other police districts: Canterbury, Counties–Manukau, Wellington and Eastern. Further panels were added in 2017 as part of the police’s Prevention First operating model but are yet to be evaluated. Another four new sites were introduced in June 2018 and another six are being developed for introduction in early 2019 (Nash Citation2018). New Zealand now spends more than $9 million per annum on restorative justice programmes (Hughes Citation2016). However, the concept of restorative justice is contentious politically, with fears that the programme provides a soft alternative to justice. Others argue there has been little or no empirical evidence to support that the programmes achieve positive social outcomes, despite seven years of implementation.
One distinct priority of iwi panels is to provide the wrongdoer with a wide range of community-based support and other tools (for example, referral to a driver training programme) which may be used to address the specific underlying causes related to the offending. In this way, further wrongdoing may potentially be prevented, thus breaking patterns of reoffending. All those impacted by the offences are invited to participate in a panel, also made up of community members, including local iwi representatives. Victim representation at the panels is low (less than 10%) but most who attend report the experience is positive (New Zealand Police 2012).
Whether a person is sent to an iwi panel is mostly influenced by arresting officer. For example, whenever someone is charged for an eligible minor offence, the arresting officer will recommend action on the charge to accompany processing through a custody unit. There are several likely outcomes: process and release without charge; formal warning; referral to an iwi panel or ordered to appear in court. There are many other factors associated with the pathway an arrestee will progress, including in some cases the decisions of custody unit supervisors who will obtain additional information about the arrestee, oversee searching (for weapons, etc) and potentially add additional charges. However, the arresting officer’s view is the most influential exercise of police discretion in bringing a person to an iwi panel because they have the information about the circumstances that brought the person to being arrested or charged and an awareness of the perspectives of the victim.
The panel is often held on a marae, a traditional community meeting place for Māori. All participants are encouraged to develop a plan for remedying the harm caused by utilising a problem-solving approach. Once the plan is agreed, it is typically expected to be completed within three months. If the plan is completed the case is closed as resolved, otherwise it proceeds to prosecution (New Zealand Police 2012; Akroyd et al. Citation2016). Most offenders (over 80%) who attend a panel fully meet the conditions of their plans (New Zealand Police 2012).
New Zealand has established restorative justice approaches within the criminal justice system. Key examples include family group conferences aimed at youth offending (Broad Citation2007) and faith-based prison units (Workman Citation2007). A Campbell Collaboration review on Restorative Justice Conferencing (RJC) found that when offenders and victims were willing participants, RJC’s reduced future crime (Strang et al. Citation2013). Further, victims showed higher levels of satisfaction with the handling of their case in an RJC compared with experiences of the adversarial criminal justice system, a finding found in almost all assessment of restorative justice programmes (Shapland et al. Citation2008). Community members and offenders also report higher levels of satisfaction (Strang et al. Citation2013).
Of particular importance in relation to re-offending, recent systematic review has found, including Braithwaite (Citation2016), that restorative justice does reduce re-offending rates significantly when compared to control groups (Sherman et al. Citation2015). Others find that diversion from the formal court process has no impact on re-offending rates (Rausch Citation1983). Some older assessments found restorative justice programmes did not work to reduce re-offending (Farrington and Welsh Citation2005).
This study is the first empirical analysis investigating the impact of iwi panels on harm related to re-offending in New Zealand since 2010. Additionally, this the first study to employ the recently developed New Zealand Crime Harm Index (NZCHI) (Curtis-Ham and Walton Citation2017) to assess re-offending patterns using police data.
Research question
The aim of the current analysis is to assess the impact of attendance at iwi panels, and subsequent completion of plans, on re-offending by panel participants compared to matched controls. There are many concerns that naturally sit alongside this question, such as the impact on different participant cohorts, whether some types of persistent offending can be successfully managed, and whether varying delivery practices of the panels have different impacts. These questions all imply a form of analysis or data that would extend that presented here. The focus of this research is to determine whether iwi panels are effective at reducing the harm related to re-offending and to quantify any observed effect as this is a prerequisite for further inquiry.
Methodology
Data sources
New Zealand Police (Māori, Pacific and Ethnic Services Division) provided a list with details of individuals referred to and attending an iwi panel between 2010–2016. This iwi panel dataset contained gender, date of birth, ethnicity and name details as well as dates of referral to, and attendance at, an iwi panel. These formed what is described in public health as the ‘treatment group’ and is hereafter referred to as the ‘iwi panels list’.
The national recording standards that establish the field codes for all police data offers ‘Community Justice Panel’ as a record of the formal method of proceeding against the individual. However, this method of recording panel attendance is not accurate in the National Intelligence Application (NIA) record, and only overlapped by 71% with the iwi panels list. An effort was made to match the individuals from the iwi panels list, using names, surnames, birth dates and identification numbers (where recorded). A comparison of the miscoded records indicates that an inaccurate method of proceeding would be normally recorded as ‘Prosecution’. The consequence of this is that the method of proceeding could not be relied on to form a case/control group and the iwi panel list needed to be matched to a larger set of records of all offending.
A second (much larger) data set was provided from police records in NIA containing demographic details and information recorded about any police occurrences since 1 January 2009 for all individuals born between 1948 and 1999, as well as those where the date of birth was unknown. A useful definition of the ‘occurrence records’ it is an event with an identified offence, linked to an individual, that has been dealt with in some way by police (from formal warning to prosecution). These records are not those that could be dealt with summarily through, for example, issuing a ticket or infringement notice. This is an important limitation in the current analysis.
Occurrences data provide a more consistent measure of offending patterns than court outcomes data for young people (between 17 and 25 years old), given a large proportion of offences are diverted from prosecution. For example, it is reported that in 2013/2014, 69% of apprehensions involving young people (14- to 16-year olds) were dealt with by means other than prosecution (Spier and Wilkinson Citation2016).
These occurrences data contained name, gender, age and ethnicity as well as age at the time of each occurrence and date and geographic details, the offence code recorded using the ANZSOC standard to classify offences into types (Australian Bureau of Statistics Citation2018). This information was extracted from the data environment (NIA pre-count domain).
Data manipulation
Over one thousand participants (n = 1097) were matched to the iwi panels list (N = 1258) in the official NIA records (2003–2018), using the recorded surname, first names, and birth dates. Those not matched were removed from further consideration.
There were five cohorts of panels. By 2014 the initial scheme piloted in Christchurch in 2010 was expanded to Canterbury, Counties-Manukau, Wellington and Eastern. However, the examination of the NIA records reveals that panels were sometimes conducted after the year they were recorded in the iwi panels list, largely due to delays in the criminal justice system. To improve accuracy of the offending histories, a year-by-year analysis is produced, matching participants in the panel years based on the ‘date of proceeding’ (with the list providing the year, or the NIA record when it recorded ‘Community Justice Panel’ as the method of proceeding and the list did not record the date of the panel). This resulted in seven year-by-year cohorts (2010–2016) of iwi panel participants. For future reference, this year reference is described as the ‘limiting year’. The limiting year establishes the point in time (year) for aggregating an individual’s offending history, and the post-panel offending which is a key component of the before/after analysis in the research design.
Data were filtered according to criteria: (1) that the occurrence was committed by a person, not an organisation; (2) that the person linked to the offending was born between 13 February 1948 and 29 May 1999 (or had a date of birth unknown) and that the proceeding date was since 2009. The data are all offences linked to an individual, recognising a method of proceeding but has no account for the outcome of that proceeding. This means an offence is recorded against an individual, and sufficient effort is put into pursuing that charge (i.e. an informal warning would not be recorded in this domain, but a formal warning is included). For the purposes of analysis, this is ‘contact’ with police for suspected/alleged offending which is conceptually different from the ‘offences a person has committed’, as these might be established in a court of law.
The NIA record unit file is indexed to ‘offences’, it, therefore, contains many more records (N = 2,038,879) than people (N = 509,000). To match individuals into two groups for a case/control comparison the data frame was first re-indexed to a Person Identification, aggregating the units relating to the factors later used in the propensity score matching to identify the control group.
A person’s record (as indexed by a unique PID) has multiple lines indicating all their contact with police. In rare cases, there are changes in the recorded gender within an individual’s police record. Far more commonly, there are numerous instances of changes in recorded ethnicity. The modal representation was used. The algorithm would select the first entry if modal ranks were tied, although this is exceptionally rare. This technical aspect of the data manipulation addresses something of the complexity of police data (Eck Citation2003) but it should be emphasised that the instances are rare (as low as 1 in 10,000) but must be dealt with when the volume of data is vast (in this instance, over 2 million lines of data).
The modal representation of gender, ethnicity, age, and the aggregated harm of their offending to the limiting year were used to form the seven year-by-year cohorts. In this way, the data frame was tagged with those who had been identified as part of the iwi panels, and their demographic factors and offending histories were available for matching.
Due to the complexity of the crime data, the NZCHI (Curtis-Ham and Walton Citation2017) was used as a dependent measure. The NZCHI indexes all offence types to a rank-ordered list based on the minimum expected number of prison days a person would receive for any single offence. It was developed using sentencing data and takes the 15% percentile of the distribution of actual sentences given, converting the days in prison, community service, fine or other sentence types into ‘Equivalised Prison Days’ to give a value for all 6633 offence codes available within the New Zealand jurisdiction. The NZCHI can be aggregated so ‘re-offending’ is constructed into a single metric for ease of analysis (Curtis-Ham and Walton Citation2017).
Iwi-panel-eligible offences are a subset of the 6633 Offence codes within the New Zealand justice system. There are 2602 offences that are deemed too serious for the panels to administer because they carry a maximum sentence of more than 6-months imprisonment, or for other reasons are excluded (e.g. family harm and methamphetamine-related offending). The remaining offences (n = 4031) are here described as ‘iwi-panel-eligible’ and make available a potential comparison-group sample frame of N = 73,560 persons. A relatively narrow range of offences are present in the current research, with a total of 219 different types of offences representing the offences leading to an iwi panel and those committed by their matched controls. presents the 10 most common offences for the iwi panel and matched controls to provide an example of the types of offending that are included as ‘iwi-panel-eligible’.
Table 1. The 10 most frequent offence types (as represented by offence codes and descriptions) for the Iwi panel participants and the matched controls.
Propensity score matching (PSM)
Each of the seven sample frames (2010–2016) was limited to those persons who had committed an iwi-panel-eligible offence in the ‘limiting year’. This is not limiting their entire offending history, just the offending in the year the panel participants went through their iwi panel. Summing NZCHI-values formed the indicator of ‘level of prior offending’.
Three adjustments were made to the data to remove around 7% of the cases. First, a ‘high-pass filter’ removed those with greater than 30 previous charges in the dataset. The problem encountered was that those accumulating 30 or more charges were statistical outliers (>95th Percentile of aggregated NZCHI) (the most extreme case was a ‘tagger’ charged with 607 counts of wilful damage) and could otherwise be matched to people with very serious offence histories (e.g. Murders, Sexual Assaults). Apart from the difficulties of managing a non-normal distribution, the individuals could potentially distort the outcomes within the matching. Importantly, iwi panels are intended to divert people from the formal court system, and this is increasingly unlikely for a person who has already faced thirty or more charges.
Second, there were a few examples of offenders who went on to commit murders or serious sexual assaults. These few people had the potential to distort the data as their accumulated ‘after limiting year NZCHI value’ could match the entire offending of the rest of the panel participants (Murder has a value of 5337; the modal value of offences post panel was 5 on the NZCHI). For the 2013 year, those with extreme (NZCHI ≥500) post-panel NZCHI values were also removed. With these two adjustments to the data the panel participants available for matching reduced to from n = 1097 to n = 1021 (or 93% of the original sample).
Third, a further eight panel participants were removed (leaving n = 1013) because they appeared on two occasions in the dataset, attending two distinct iwi panels. These people upset the integrity of the research design, so rather than choosing one of these panels as their ‘intervention’, they were simply excluded from further analysis.
Two methods of PSM were trialled, but both with the dependent variable being whether a person attended a panel. The first is a ‘nearest neighbour’ which extracts from the data frame a record that has the lowest difference based on a logit of the combination of the covariates: age (in years), gender, ethnicity, place of panel/or known location, and offence harm history prior to the year of the panel (summed NZCHI-value prior to the limiting year). Second, the ‘exact’ method. In our analysis, the ‘exact match’ failed to extract matches and reduced the sample size so the ‘nearest neighbour’ was preferred.
Using a 4:1 ratio nearest neighbourhood matching (four controls for each iwi panel participant), seven PSMs were run, one for each limiting year. The seven sets of matches were then combined into a total set to form a single comparison group of n = 4084, extracted from the total sample frame of all people who had committed an iwi-panel-eligible offence. This method of sub-population propensity score matching is explained and recommended by (Caliendo and Kopeinig Citation2008). Using a 4:1 ratio introduces variability in the matched control but the decrease in bias from fewer matches is weighed against the lower efficiency arising with fewer observations. A one-to-many match will increase sample size and efficiency but can also result in greater bias from matches that are not as close as the initial match (Garrido et al. Citation2014).
Data analysis
The dependent measure is the accumulated harm from offending before/after the limiting year, developed by aggregating offending histories using the NZCHI to form a continuous measure.
This study uses a linear-mixed effects model that provides significant advantages over more traditional analyses requiring tightly controlled factorial designs (Gałecki and Burzykowski Citation2013). Case/control comparisons were conducted for the offence records of the panel and the control after the limiting year. The critical factor was whether a person who attended an iwi panel had a subsequent offence record significantly different to that observed in the matched control.
Analysis used R (R Core Team Citation2015 version 3.5.0) and LME 4 to perform a linear mixed effects analysis of the relationship between re-offending and the case/control constructed through propensity score matching.
The generalised linear model has a repeated measure (offending harm, as represented by aggregated CHI-score prior to the limiting year and then after the limiting year). The fixed effects entered in the model were whether the person was under 25 years old and whether they attended a panel. The modelled random effect alters the intercepts for aggregated Crime Harm for before the limiting year (i.e. individual intercepts for each participant). Visual inspection of residual plots did not reveal any obvious deviations from homoscedasticity but there is some deviation from normality at both extremes of the predictors.
Results
The dataset contained 1013 iwi panel participants and 4084 individuals that served as matched controls. presents a summary of demographic details for participant and control individuals.
Table 2. Demographic details of sample indicating the participants from iwi panels and their matched control group extracted using nearest neighbour propensity matching.
As a function of the nearest neighbour matching by gender, age and ethnicity it is a contrived outcome that the case and control groups would have similar rates of young people, Māori, and by logical extension ‘young-Māori’. The balance provides some confidence that the technique of nearest neighbour matching was successful.
However, what is more important to highlight is that the ‘young Māori’ sub-group represents around 24% of the sample on which the analyses are conducted.
The matching of ‘place’ was to the district where they were mostly (i.e. modally) up to and including the limiting year. If there was just the record of the panel then that would be their location. Thus, a relevant match would be also located in that region, as opposed to the region in which the panel operated on the rare (less than 5%) of cases where these differed.
The comparisons in give an indication of the success of the matching. Comparisons are made between the iwi panels list and the matched controls.Footnote1 Additional comparisons are made between the iwi panels list and the entire sample frame, those that were not matched. Welsh two tail t-tests are used for measures of age and prior offending, and chi-square tests of independence for gender, ethnicity and location. It is observed that a small portion (4–5%) of participants moved from the region in which they attended a panel. The matching process has also improved the similarity of the controls to the iwi panels list on prior-offending (measured by aggregated CHI) and gender, by matching to more females.
Table 3. Comparisons between the iwi-panel list and the matched controls group (aggregated across the seven cohorts: Years 2010–2016) and the iwi panels list compared to the unmatched controls.
presents the aggregated pre-and post-means for each of the areas, collapsed across the years of the cohorts. From it might appear obvious that the panels were successful at reducing harm from re-offending but this form of presentation aggregates the ‘control’ or matched participants with the key concern being the correlation between ‘pre-panel offending’ and ‘post-panel offending’: (Kendall Tau Rank correlation = 0.187, p < .001). Pre-panel offence histories vary between the different panels (with Canterbury having a pre-panel NZCHI-index mean offence history of 37.04, less than half of Counties/Manukau, mean = 88.83). This suggests that different regions had different criteria for iwi panel participants, and consequently differences in performance. Also, note that Canterbury has a post-panel time period of up to seven years, whereas Counties/Manukau has three years of post-panel offending data. This variation is ‘opportunity’ to offend and is controlled within the matching and analysis. represents the post-panel offending (between the panel year and 31 December 2017) recorded against individuals who attended one of the four regional panels from the years 2010 to 2016.
Figure 1. The Canterbury Iwi Community Justice Panels (2010–2015) post-panel re-offending aggregated from the year after the panel to 2017, compared to controls matched on pre-panel location, gender, age and whether Māori or not.
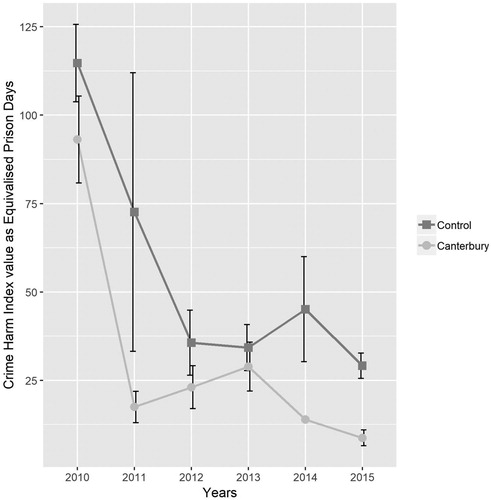
Figure 2. The Wellington Region (Lower Hutt) Iwi Community Justice Panels (2014–2016) post-panel re-offending aggregated from the year after the panel to the end of 2017, compared to controls matched on pre-panel location, gender, age and whether Māori or not.
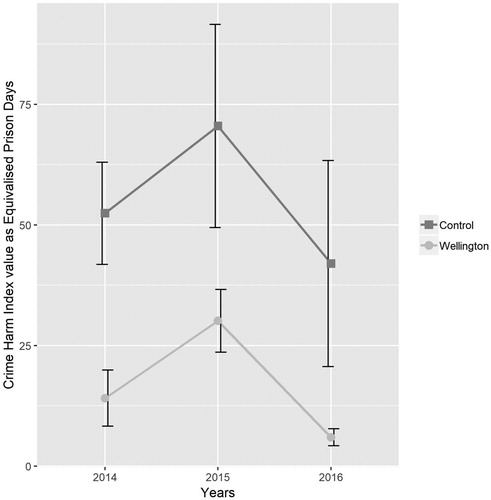
Figure 3. The Counties/Manukau (South Auckland: Manukau Urban Māori Authority) Iwi Community Justice Panels (2014–2016) post-panel re-offending aggregated from the year after panel to the end of 2017, compared to controls matched on pre-panel location, gender, age and whether Māori or not.
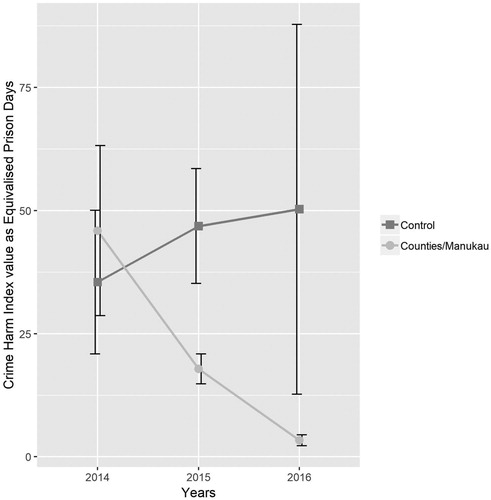
Figure 4. The Tairawhiti (Eastern Police District) Iwi Community Justice Panels (2014–2016) post- panel re-offending aggregated from the year after the panel to the end of 2017, compared to controls matched on pre-panel location, gender, age and whether Māori or not.
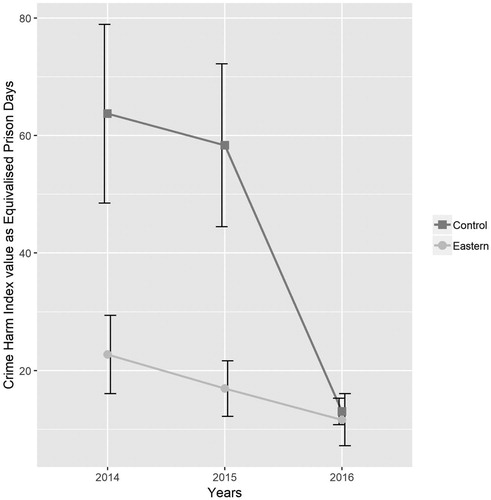
Table 4. Mean accumulated CHI values before and after the year of panel attendance.
A univariate analysis of the data is undertaken with the key variables (Panel vs. Control) against whether the individuals went on to have any further offence (a total of 18284 offences, per person, mean = 3.58, range 0–117, with the mode being 0, and the median = 1). The results are presented in . Around 74% of panel participants went on to have another offence compared with only around 60% of the matched controls. The result expressed in this way would be interpreted as a failure of iwi panels as panel participants are less likely to abstain from further offending (OR = 1.85, 95% CI: 1.58–2.12). A similar result is obtained when examining the frequency of offending. Comparing the average number of offences committed by those from iwi panels (m = 3.11, sd = 6.57) to controls (m = 3.7, sd = 7.19) reveals that iwi panel participants have significantly more post-panel offences (t = 2.51, df = 1667.5, P < .01).
Table 5. The frequency of post-panel offending across three categories (none, less than 5 CHI or greater than 5 CHI) in Iwi panel participants and matched controls.
However, even an unsophisticated indexing (cf the significant improvement through the NZCHI) establishes that panel participants are apprehended for a more minor offending relative. Considering the distribution of across all participants, a summed value of 5 is the most common number at the midpoint of the series (n = 114), zero is by far the most common overall (n = 1769) and the above a CHI of 5 the most common value id 10 (n = 67). When compared to their matched controls, iwi panel participants are accountable for fewer serious offences (NZCHI > 5), χ2 (5097) = 225.78, p < .001. Thus, the odds of committing any further offence are significantly greater compared to the control but the odds of committing higher-level harm are significantly greater (around 3 times greater) for control group participants (OR = 3.2 95% CI: 2.75–3.80).
are a graphical representation of the effectiveness of the panels by location. The figures graphically represent the times at which the panels have been in operation and represents the post-panel offending in terms of aggregated Crime Harm. The NZCHI converts fines and non-custodial sentences into a single measure of ‘Equivalised Prison Days’, the comparison groups are those derived from the matching of pre-panel location.
The linear mixed effects model has the advantage of accounting for the within-subject variance in a repeat measures design. The main model of interest is the full saturated model containing the interaction effects for the fixed covariates: Panel/Control; being under 25 years old. The saturated model is fit by maximum likelihood and is contrasted to the main effects model and determined to be significant χ2 (11) = 12.35, p = .015 indicating an interaction effect is necessary to consider. The coefficients for the fixed effects are presented in .
Table 6. Fixed effects: intercepts and coefficients for the saturated model with interactions.
Age, gender, and ethnicity (whether recorded as Māori or not) have all been matched in the selection of a control group so they are not expected to interact with whether a person attended a panel. An additional model (not presented in this paper) was run to assess whether being Māori had any interaction with the observed effect for panel attendance. No significant effect was found for Māori. However, age in years was used for matching purposes but could be further considered by entering it into the model. Whether a person was ‘younger’ (aged 25 years or less at the time of the limiting year) is included to determine its potential influence on re-offending.
The intercept shows that offending occurs at a mean baseline level of crime harm, m = 70.17 (b = 70.17, SE = 4.41, p < .001). The mean NZCHI score is increased on average by m = 50.71 across the panel and the matched controls (b = 50.71, SE = 4.67, p < .001). Importantly, the attendance at the panel shows no significance without considering the pre–post panel offending (b = −4.70, SE = 10.53, p = .66). This finding provides an additional check on the integrity of the propensity score matching that controlled for pre-panel offence histories. However, younger offenders have a decrease in overall harm in post-limiting year offending by m = 19.21 NZCHI ± 5.58 standard errors. Those who attend a panel (of any age) reduce their harm in their offending in the years after their limiting year by m = 26.89 NZCHI ± 10.74 standard errors, compared with the matched controls. Being under 25 years does not interact with the effect for attending the panel, though in itself brings a reduction in their offending in the years after their limiting year.
The overall effect size is d = 0.183, 95% CI = 0.11–0.25, calculated from the reported mean differences and standard deviations reported in .
Discussion
Iwi panel participants are found to commit significantly less harm in post-panel offending when compared with their matched controls when harm is here measured using the NZCHI. The reduction is around two-thirds of the mean score of the average NZCHI index offence, which may be represented as 26.9 Equivalised Prison Days. It is possible to compare the average reduction in offending between panel participants and their non-panel matched controls. Having regard to the totality of offending, therefore including their pre-panel baseline, panel participants have about a 22.25% reduction in the harm associated with their offending post-panel.
The overall reduction in harm does fall within the range observed by Strang et al. (Citation2013) within their review of 10 experimental investigation of restorative justice programmes: finding between 7% and 45% fewer repeat convictions or arrests. Latimer et al. (Citation2005) conducted a meta-analysis on studies of restorative justice and found a more modest overall effect size of around .07, (95% CI 0.02–0.12). Our mean observed effect d = 0.183 sits above this observed range. However, Latimer et al. (Citation2005) report studies with effect sizes ranging from +0.38 to −0.23.
Sherman et al. (Citation2015) recognise the frequency of criminal convictions (or arrests) is a crude indicator of the amount of harm caused by crime and recommends the use of seriousness-weight indices to capture the complexity of criminal behaviour. Our study introduces a method for the analysis of complex administrative data concerning criminal offending, with the first use of the NZCHI to assess a New Zealand programme’s performance.
The finding here is achieved retrospectively given the available data record. However, the data bend into form only after consideration of a sophisticated dependent measure in the form of the NZCHI. The data frame is limited to histories of those committing an iwi-panel-eligible offence, and propensity score matched case/controls are constructed, separated into seven cohorts. The analysis occurs within a mixed effect, linear model, which offers an improvement to the traditional techniques which rely on tightly-controlled factorial research designs (Gałecki and Burzykowski Citation2013).
The data have the capacity to mislead if the dependent measures were simply ‘re-offending’, or if one were to use techniques (e.g. survival analysis) considering such measures as ‘time to reoffend’ without also considering the seriousness of that offending (cf Bouffard et al. Citation2017). An analysis of the odds of re-offending shows that iwi panel participants have exaggerated levels of re-offending at very low levels of crime harm. This is consistent with previous analyses that examine re-offending rates for restorative justice programmes in New Zealand Akroyd, et al (Citation2016). Thus, by finding a reduction in harm, as opposed to rate, we have additionally demonstrated the benefit for using a crime harm index in the assessment and evaluation of recidivism or programmes designed to reduce re-offending. Indeed, the opposite finding would have been reasonable if we relied on the observed rates of re-offending.
What is considered ‘re-offending’ requires careful consideration as it has been operationalised into an index within the NZCHI. When this is considered within a matched sample, panels work well across all offenders with no distinct consideration for Māori and Non-Māori. This finding repeats an earlier observation comparing re-offending rates for Māori youth offenders with non-Maori (Fergusson et al. Citation2003; Maxwell Citation2004). Further, we report there is no effect for ‘youth’ (here those under the age of 25 years) observing a similar outcome to that reported in the overall moderator analysis by (Strang et al. Citation2013).
The analyses are inherently conservative because they describe the differences between a control group and those who have been through an iwi panel, with a basic consideration of the age of the offender being under the age of 25 years, or over 25 years old. Recent work identifies that age-dependent offending is complex and poorly understood (Jolliffe et al. Citation2017). A refined model would recognise that the age-analysis is overly constrained and does not reflect known patterns in re-offending that sees older people developing patterns of reduced recidivism (Bäckman et al. Citation2014).
Other relevant social and psychological factors are known to influence re-offending, such as employment (e.g. Leschied et al. Citation2008), or family history (Farrington et al. Citation2009) but are not available to this research in the recorded data concerning each participant, though in principle could be made available through an effort to monitor panel participants prospectively. Again, our focus is simple, even if the data environment is complex: we wanted to know whether iwi panels are effective at reducing the harm from criminal offending, so we have allowed much to go into an unexplained (error) factor that we expect is distributed randomly across in the two groups.
In the mixed model, we add one or more random effects to the usual structured fixed effects that are known to influence the rates of offending. These random effects essentially give structure to the error term because the error term is not consistent across the participants (Gałecki and Burzykowski Citation2013). In the case of our models here, we added a random effect for each subject’s prior opportunity and level of offending, characterising the idiosyncratic variation that is due to individual differences. Modelling this random effect also accounts for some of the individual variability of when the panel was conducted which is unique to each participant.
Further analysis could consider types of offences, for example, driving-related offending. Careless driving and failing to comply with a prohibition not to drive (i.e. driving without a licence) rank in the top three offences considered by the panels. The principles of the iwi panel lend themselves to supporting offenders to obtain a licence and to drive responsibly but more importantly, driving-related offending tend to fall within the range of the NZCHI-values that are observed to be over-represented in the pre-panel offending of panel participants.
There is some perceived variability in the level of support offered to panel participants post-panel and this could be modelled separately by comparing the offending rates post-panel at different locations, having due consideration to the fact that the models are complex and that the sample sizes and geographic variability in baseline offending may make such analysis challenging with respect to statistical power.
A future evaluation would benefit by considering a randomised control trial methodology to avoiding complex data-matching and the complex analysis that is employed here to overcome the limitations of the available data opportunity.
Limitations
A significant limitation relates to challenges experienced matching the names of those attending iwi panels provided as an independent list with the NIA record data for those individuals. This challenge meant the total population of those attending iwi panels was not able to be included. After applying several different approaches for matching, a total of 1097 out of 1258 iwi panel participants were matched. More accurate record keeping would facilitate improved analysis. More complete records might include measures of victim engagement and empowerment, offender remorse and the rate of completion of community-directed programmes. (UN Office on Drugs and Crime Citation2006).
Limiting the data to those who have less than thirty previous charges reduces the available data by 7% but preserves the integrity of the intention of the panel to affect the trajectories of those who have not become embedded in the formal court system. However, this restriction of the data is noted as an important limitation to the generalisability of the result. That is, the success of the panels is confined to the same limitation.
It was possible for those with large accumulated offence histories to present for an iwi-panel-eligible offence and be processed through to the panel. There is likely to have been a benefit in limiting the accumulated prior offending harm (to less than 500) in addition to the limiting the sample to the person who had been charged with fewer than thirty offences.
The analysis recognises there is a selection of offenders going to an iwi panel and this is a limiting factor on the policy of their implementation. An iwi panel is not likely to work for all offenders, or at least, it should not be implied by this analysis that iwi panels should be made available for all low-level offenders.
Finally, different ways of entering an individual’s name in NIA resulting in multiple PIDs for the same individual created difficulties retrieving the occurrence history for some panel participants.
Conclusion
An iwi panel is found to be an effective alternative justice resolution process implemented in New Zealand. With minor restrictions to the available data, it is found that iwi panels significantly reduce the harm associated with re-offending compared to a control group matched by age, gender, ethnicity, prior history of offending and location. Using the NZCHI-value to convert offending into a single metric of harm, iwi panels are found to reduce offending by 26.9 equivalised prison days, which is around 22.25% less than that of their matched contemporaries. Analysis that focused solely on the observed rate of re-offending would be misleading in our data as it would indicate an increase in re-offending for panel participants compared to controls. Panel participants are found to re-offend with minor offences and thus a focus on rates of offending missing the complexity of the restorative justice process that reduces the harm or seriousness of re-offending.
Acknowledgments
The authors wish to thank the many people who offered support and encouragement, advice and input. These include the NZ Police MPES team, especially Sarah Czarnomski, Greta Gordon, Christine Jamieson, Erin Hurley and Mike McLean. The authors also thank Justine O’Reilly and Bobby Brooks. The authors are especially grateful to the reviewers who did a diligent job and made for a much-improved paper.
Disclosure statement
No potential conflict of interest was reported by the authors.
ORCID
Darren Walton http://orcid.org/0000-0001-6420-1301
Notes
1 combines the results for the seven different matched case/controls. We invite the interested reader to contact us for details of any of the individual cohorts.
References
- Akroyd S, Paulin J, Paipa K, Wehipeihana N. 2016. Iwi panels: an evaluation of their implementation and operation at Hutt Valley, Gisborne and Manukau from 2014 to 2015. Wellington: Ministry of Justice, New Zealand Police, Department of Corrections.
- Australian Bureau of Statistics. 2018. ANZSOC codes; [accessed 2018 July 6]. http://www.abs.gov.au/ausstats/[email protected]/mf/1234.0.
- Bäckman O, Estrada F, Nilsson A, Shannon D. 2014. The life course of young male and female offenders – stability or change between different birth cohorts? British Journal of Criminology. 54(3):393–410. doi: 10.1093/bjc/azu007
- Bouffard J, Cooper M, Bergseth K. 2017. The effectiveness of various restorative justice interventions on recidivism outcomes among juvenile offenders. Youth Violence and Juvenile Justice. 15(4):465–480. doi: 10.1177/1541204016647428
- Braithwaite J. 2016. Restorative justice and responsive regulation: the question of evidence. (No. 51). Available from Australian National University website: http://regnet.anu.edu.au/sites/default/files/uploads/2016-10/SSRN_2016_updated_Braithwaite%20J.pdf.
- Broad H. 2007. Restorative policing. In: G. Maxwell, J. Liu. editors. Restorative justice and practices in New Zealand: towards a restorative society. Wellington: Institute of Policy Studies. p. 125–138.
- Caliendo M, Kopeinig S. 2008. Some practical guidance for the implementation of propensity score matching. Journal of Economic Surveys. 22(1):31–72. doi:10.1111/j.1467-6419.2007.00527.x.
- Curtis-Ham S, Walton D. 2017. The New Zealand crime harm index: quantifying harm using sentencing data. Policing: A Journal of Policy and Practice. 12(4):455–467. doi: 10.1093/police/pax050
- Daly K. 2002. Restorative justice: the real story. Punishment & Society. 4(1):55–79. doi:10.1177/14624740222228464.
- Eck J. 2003. Police problems: the complexity of problem theory, research and evaluation. Crime Prevention Studies. 15:79–114.
- Farrington DP, Coid JW, Murray J. 2009 Family factors in the intergenerational transmission of offending. Criminal Behaviour and Mental Health. 19(2):109–124. doi:10.1002/cbm.717.
- Farrington DP, Welsh BC. 2005. Randomized experiments in criminology: what have we learned in the last two decades? Journal of Experimental Criminology. 1(1):9–38. doi:10.1007/s11292-004-6460-0.
- Fergusson DM, Horwood LJ, Swain-Campbell N. 2003. Ethnicity and criminal convictions: results of a 21-year longitudinal study. Australian & New Zealand Journal of Criminology. 36(3):354–367. doi: 10.1375/acri.36.3.354
- Gałecki A, Burzykowski T. 2013. Linear mixed-effects model. In: A. Gałecki, T. Burzykowski, editors. Linear mixed-effects models using R: a step-by-step approach. p. 245–273. doi:10.1007/978-1-4614-3900-4_13.
- Garrido MM, Kelley AS, Paris J, Roza K, Meier DE, Morrison RS, Aldridge MD. 2014. Methods for constructing and assessing propensity scores. Health Services Research. 49(5):1701–1720. doi:10.1111/1475-6773.12182.
- Hughes T. 2016. Restorative justice: evidence brief. Wellington: Ministry of Justice.
- Jolliffe D, Farrington DP, Piquero AR, Loeber R, Hill KG. 2017. Systematic review of early risk factors for life-course-persistent, adolescence-limited, and late-onset offenders in prospective longitudinal studies. Aggression and Violent Behavior. 33:15–23. doi:10.1016/j.avb.2017.01.009.
- Ka'ai TM, Moorfield JC, Reilly MJP, Mosely S, editors. 2004. Ki te Whaiao: an introduction to Māori culture and society. Auckland, New Zealand: Pearson Longman.
- Latimer J, Dowden C, Muise D. 2005. The effectiveness of restorative justice practices: a meta-analysis. The Prison Journal. 85(2):127–144. doi: 10.1177/0032885505276969
- Leschied A, Chiodo D, Nowicki E, Rodger S. 2008. Childhood predictors of adult criminality: a meta-analysis drawn from the prospective longitudinal literature. Canadian Journal of Criminology and Criminal Justice. 50(4):435–467. doi:10.3138/cjccj.50.4.435.
- Marie D. 2010. Maori and criminal offending: a critical appraisal. Australian & New Zealand Journal of Criminology. 43(2):282–300. doi: 10.1375/acri.43.2.282
- Maxwell G. 2004. Achieving effective outcomes in youth justice final report. Wellington: Ministry of Social Development.
- Nash S. 2018. Crown-Maori efforts to reduce reoffending. [accessed 2018 December 6]. http://www.beehive.govt.nz/release/crown-maori-efforts-reduce-reoffending.
- Owens V. 2001. Whanake Rangatahi: programmes and services to address Maori youth offending. Social Policy Journal of New Zealand. 16:175–190.
- R Development Core Team. 2015. R: A language and environment for statistical computing. R Foundation for Statistical Computing. Vienna, Austria. http://www.R-project.org.
- Rausch S. 1983. Court processing versus diversion of Status offenders: a test of deterrence and labeling theories. Journal of Research in Crime and Delinquency. 20(1):39–54. doi:10.1177/002242788302000104.
- Shapland J, Atkinson A, Atkinson H, Dignan J, Edwards L, Hibbert J, Sorsby A. 2008. Does restorative justice affect reconviction? The fourth report from the evaluation of three schemes. . Ministry of Justice Research Series. 10(8).
- Shepherd SM, Ilalio T. 2016. Maori and Pacific Islander overrepresentation in the Australian criminal justice system – what are the determinants? Journal of Offender Rehabilitation. 55(2):113–128. doi: 10.1080/10509674.2015.1124959
- Sherman LW, Strang H, Mayo-Wilson E, Woods DJ, Ariel B. 2015. Are restorative justice conferences effective in reducing repeat offending? Findings from a Campbell systematic review. Journal of Quantitative Criminology. 31(1):1–24. doi: 10.1007/s10940-014-9222-9
- Spier P, Wilkinson R. 2016. Reoffending patterns for participants of youth justice Family Group Conferences held in 2011 and 2012. https://www.msd.govt.nz/documents/about-msd-and-our-work/publications-resources/research/child-and-youth-offending-patterns/reoffending-patterns-for-court-ordered-and-itc-fgcs-for-sept-2016-publication.docx.
- Strang H, Sherman LW, Mayo-Wilson E, Woods D, Ariel B, Strang H. 2013. Restorative justice conferencing (RJC) using face-to-face meetings of offenders and victims: effects on offender recidivism and victim satisfaction. A systematic review. Campbell Systematic Reviews. 12. doi: 10.4073/csr.2013.12
- UN Office on Drugs and Crime. 2006. Handbook on restorative justice programmes; p. 114. Available from United Nations website: https://www.unodc.org/pdf/criminal_justice/Handbook_on_Restorative_Justice_Programmes.pdf.
- Wood WR. 2015. Soliciting community involvement and support for restorative justice through community service. Criminal Justice Policy Review. 26(2):131–155. doi: 10.1177/0887403413499580
- Workman K. 2007. Resolving conflict and restoring relationships: experiments in community justice within a New Zealand faith-based prison. In: G Maxwell, J Liu, editors. Restorative justice and practices in New Zealand: towards a restorative society. Wellington: Institute of Policy Studies; p. 139–161.
- Zehr H. 2015. The little book of restorative justice: revised and updated. New York: Skyhorse Publishing, Inc.