
 ?Mathematical formulae have been encoded as MathML and are displayed in this HTML version using MathJax in order to improve their display. Uncheck the box to turn MathJax off. This feature requires Javascript. Click on a formula to zoom.
ABSTRACT
From the onset of the COVID-19 pandemic, a deluge of research has sought to explain both between- and within-country variation in mortality. Research has focused primarily on policy measures and underlying population and socioeconomic characteristics. While those factors have their proper place in our global understanding of this once in a generation crisis, they do not explain the divergent outcomes observed between similar nations, such as Canada and the United States. This research adapts a Generalized Additive Model (GAM) to the unique case of these North American neighbors and illustrates the role that timely policy adoption and the state’s capacity to administer policy programs play in effective pandemic containment. By applying our empirical design sub-nationally, we demonstrate that our findings are robust to comparisons made within individual nations, as well as across an aggregation of the two countries’ subnational units. In doing so, we provide substantive evidence of the preeminent role that the government’s political capacity and policy responsiveness play in mitigating the worst effects of the COVID-19 pandemic.
RÉSUMÉ
Dès le début de la pandémie de COVID-19, un déluge de recherches a cherché à expliquer les variations de la pandémie tant entre les pays qu'à l'intérieur de ceux-ci. Ces recherches se sont principalement concentrées sur les mesures politiques et les caractéristiques démographiques et socioéconomiques sous-jacentes. Si les facteurs ont toute leur place dans notre compréhension globale de cette crise unique en son genre, ils n'expliquent pas les résultats divergents observés entre des nations similaires, comme le Canada et les États-Unis. Cette recherche adapte un modèle additif généralisé (GAM) au cas unique de ces voisins nord-américains et illustre le rôle que jouent l'adoption opportune de politiques et la capacité de l'État à administrer des programmes politiques dans l'endiguement efficace d'une pandémie. En appliquant notre modèle empirique à l'échelle infranationale, nous démontrons que nos résultats sont robustes, relativement aux comparaisons réalisées au sein des nations individuelles, ainsi qu'à travers une agrégation des unités infranationales des deux pays. Ce faisant, nous fournissons des preuves substantielles du rôle prééminent que jouent la capacité et la réactivité politiques du gouvernement dans l'atténuation des pires effets de la pandémie de COVID-19.
Introduction
The COVID-19 pandemic has visited devastation on every corner of the world, causing millions of deaths and grinding economies to a halt. Yet, there has been immense between- and within-country variation in case and fatality severity, much of which cannot be explained by common factors, such as wealth, spatial location, or demographic structure. Neighboring nations and states with overwhelming similarities have suffered vastly divergent infection rates and death tolls. Canada and the United States are two such examples. Both are rich, western, liberal democracies with market economies and federal political systems, similar in trade, urbanization, and age structure. Yet, at the time of this writing, the United States has suffered nearly three times as many reported deaths per capita and has demonstrated considerably wider-ranging subnational outcomes than has Canada.
What accounts for such varied mortality rates between two otherwise similar countries? What accounts for such varied outcomes between the subnational units of a singular country? We argue that the different outcomes observed in Canada and the United States are primarily driven by differences in the policy responsiveness of the respective governments and their capacity to implement their adopted measures. Through a Generalized Additive Model (GAM) measuring for the relative and conditional impacts of a carefully selected set of politics and policy measures, as well as a necessary set of controls, we demonstrate that (1) timely and appropriate policy is effective in its efforts to reduce COVID-19 mortality, (2) state political capacity, as measured by relative political extraction (RPE), is also negatively associated with mortality rates, and (3) that the efficacy of policy is both constrained and complimented by the capacity of the government enforcing it. In doing so, we shed light on the extent to which politics and policy combine to either save or cost lives in the face of a devastating pandemic.
Literature review
Desmet and Wacziarg (Citation2021) examine a broad series of potential correlates of COVID-19 case and fatality severity to adjudicate between two foundational but diametrically opposed views of the nature of the pandemic. The first argues that spatial variation in pandemic severity is merely a function of time. According to this view, the continued spread of the disease will ultimately leave all populations with similar rates of infection, hospitalization, and death. Therefore, the only measures of interest relate to the inherent biological properties of the novel coronavirus and public policy need not consider local population characteristics. The second view, by contrast, sees geographic variation as a reflection of fundamental characteristics of the community environment. Thus, effective public policy must be tailored to fit local conditions. The authors perform a series of county-level cross-sectional analyses throughout the first wave of infections in the United States and demonstrate that spatial heterogeneity in the United States is not only a function of timing, but that local socioeconomic and demographic features, as well as population density, nursing home populations, proximity to major international airports, and political preferences each play a role (Desmet & Wacziarg, Citation2021).
While Desmet and Wacziarg (Citation2021) find that American counties with lower relative income and higher poverty rates are disproportionately impacted, The Economist (Citation2021) reports that globally, greater mortality is found in wealthier nations. They argue that this can be primarily attributed to greater under-reporting in low- and middle-income countries, as well as the age distribution of the respective populations. Their study adopts a gradient boosting machine-learning technique to estimate excess deaths for poorer countries with compromised reporting abilities, but also produces estimates for more affluent societies. After accounting for reporting discrepancies, they estimate that actual death rates for affluent countries belonging to the OECD are 1.17 times the official figures, while actual death rates for poorer nations in sub-Saharan Africa are fourteen times the official numbers. The pattern of greater absolute mortality in wealthier nations persists in the modeled data, highlighting the influence of age on COVID-19 mortality. However, relative “death rates among poor young populations are much higher than they would be for populations in the rich world with similar age profiles” (The Economist, Citation2021, p. 18).
The risk factors of age and population density converge in nursing homes and other types of long-term eldercare facilities and are further exacerbated by the increased prevalence of preexisting chronic health conditions. While nursing home residents make up 2 percent of the population of the United States and 7 percent of the population of Canada (Canadian Institute for Health Information, Citation2020), studies estimate that nursing home residents make up approximately 35 percent of COVID-19 deaths in the United States (Yourish, Lai, Ivory, & Smith, Citation2020) and between 66 and 81 percent of deaths in Canada (Hsu et al., Citation2020). A study of long-term care facilities in Ontario, Canada published by the American Medical Association found that, compared to community-dwelling elder adults, nursing home residents were thirteen times more likely to contract novel coronavirus and five times more likely to die of COVID-19 (Fisman, Bogoch, Lapointe-Shaw, McCready, & Tuite, Citation2020). However, a further study of 78,607 residents in 618 nursing homes in Ontario, Canada reveals that infection and mortality rates were distributed unequally across nursing home populations, with 86 percent of infections occurring in just 10 percent of facilities. The authors conclude that resident density was the key contributor to this variance, lending further weight to the role of human interaction in the transmission of the disease (Brown et al., Citation2020).
Though Desmet and Wacziarg (Citation2021) did find that proximity to international airports was associated with higher case and fatality rates, they also revealed that such influence wanes over time. Thus, their findings are consistent with early research documenting the role of human mobility and interaction in the rapid spread of the virus. Kraemer et al. (Citation2020) examine mobility and case data from Wuhan, China and show that the drastic travel restrictions and control measures implemented in China were particularly effective in containing contagion in the early stages of the outbreak (Kraemer et al., Citation2020). Thus, while the political debate may obfuscate the utility of social distancing, face masks, and contact tracing, the medical and public health communities agree that these steps are necessary to reduce the spread of COVID-19 (Centers for Disease Control and Prevention, Citation2020; Mayo Clinic, Citation2021; World Health Organization, Citation2021).
The University of Oxford’s COVID-19 Government Response Tracker (OxCGRT) provides a useful index for tracking these and other policies over time. Their index reports daily values for the presence of a wide array of public health measures, including school and workplace closings, public event cancelations, restrictions on gatherings and travel, mask mandates, contact tracing, and economic support. The disparate sub-indices combine into one “Stringency Index” facilitating the comparison of state policy responsiveness over time (Hale, Angrist, et al., Citation2020). Applying the Stringency Index to assess the relationship between government responses and COVID-19-related deaths has shown that the early implementation of a more stringent policy can reduce the average growth rate in deaths (Hale, Hale, et al., Citation2020)
Yet while considerable attention has been paid to the efficacy of policy, little attention has been paid to the structural capacity of governments to administer the services and programs they institute. The work of Kugler and Tammen (eds.) (Arbetman-Rabinowitz et al., Citation2013) develops the formulae for calculating relative political capacity (RPC) and its component measures of relative political extraction (RPE), relative political reach (RPR), and relative political allocation (RPA). Within that edited volume, Arbetman-Rabinowitz, Kugler, Abdollahian, Kang, Nelson, and Tammen establish the role of extraction and population mobilization in the government’s pursuit of policy goals. As governments require public resources to enact policies, those which effectively extract financial resources and mobilize human resources, given their economic development, “will be able to implement policy and pursue their political and economic goals while preserving political stability” (Arbetman-Rabinowitz et al., Citation2013, pp. 13–20). Fukuyama (Citation2020) notes disparate pandemic outcomes across regime types and argues that state capacity, in combination with social trust and leadership, are the primary factors responsible for a successful pandemic response (Fukuyama, Citation2020). Thus, with respect to the outbreak of COVID-19, we maintain that states with higher extractive and mobilization capabilities will be more effective in combating the pandemic.
Methodology
The purpose of this paper is to examine the effects of politics and policy on the severity of COVID-19. We argue that though the policies a government chooses and the timing of those policies with respect to the virus are key determinants of death rates from the coronavirus, their influence is conditional on government’s capacity to implement and enforce them. To examine this dynamic, we draw inspiration from most similar systems design (MSSD) research and aim our empirical analysis at the unique cases of the United States and Canada. By centering our focus on this pair of countries, we can implicitly control for their respective commonalities and move beyond global, large-N statistical relationships and toward a deeper understanding of the underlying mechanisms through which politics and policy implementation converge to save or cost lives. Such comparative research allows us to examine the generalizability of the effects in question and allows for a deeply contextual discussion of the results.
The key to MSSD research is to select two systems, which are as similar as possible across as many relevant factors as possible. In such a design, “similar variables are treated as parameters in order to cut down on the number of operative variables” (Faruby, Citation1976, p. 154). Ideally, the two cases to be compared are so similar that “most of the contextual characteristics that might be of influence otherwise, are held constant. Hence, only those characteristics on which the selected cases differ may generate an effect” (van Klingeren, Boomgaarden, Vlietgenthart, & de Vreese, Citation2015). Thus, the two systems should exhibit significant variation only in the outcome of interest and the variables that are posited to explain the divergence of the said outcome. If so, “the causes behind the difference in outcomes cannot logically be located within what the two countries share” (Lecours & Beland, Citation2013, p. 95) and therefore can plausibly be attributed to differences in the variable of interest.
According to these criteria, Canada and the United States can be seen jointly as a prime candidate for MSSD. First, they are in the same region, which is most often the case for such a design (Faruby, Citation1976). That Canada and the United States are neighbors is also beneficial given the nature of pandemic spread; continental effects can be ruled out as an explanation for the difference in overall death rates between the two countries.
Second, Canada and the United States have an abundance of similar characteristics which may be relevant to the topic of this research. “Mutual features of the two countries include their shared Anglo-American heritage, federal structures and liberal market economies” (Turgeon, Papillon, Wallner, & White, Citation2014, p. 14). Further, Canada and the United States are both rich countries with comparable life expectancies, and similar levels of imports per capita, net migration, and international travel (The World Bank, Citation2021), all of which contend as explanations for death rates from COVID-19, and each of which can be logically eliminated as significant causes of divergent outcomes between the two countries.
Third, while Canada and the United States are comparable across all the previously mentioned parameters, they differ significantly in the two key areas that we argue impact death rates: political capacity and the responsiveness of policy choices. Among OECD member countries, Canada ranks 21st in relative political extraction (RPE) with a score of 0.91, while the United States ranks 32nd of 37 OECD member countries with a score of 0.70. In terms of relative political reach (RPR), Canada ranks 17th with a score of 0.95, while the United States ranks 25th with a score of 0.90 (Fisunoglu, Kang, Arbetman-Rabinowitz, & Kugler, Citation2020). To put this into perspective, Canada’s RPE is one standard deviation higher than that of the United States, while its RPR is one third standard deviation higher. This indicates that, while Canada is somewhat more effective at “penetrating into the daily lives of individuals”, it is tremendously more effective at compelling its population to “comply with the demands of government” and allowing the “implementation of governmental goals” (Arbetman-Rabinowitz et al., Citation2013).
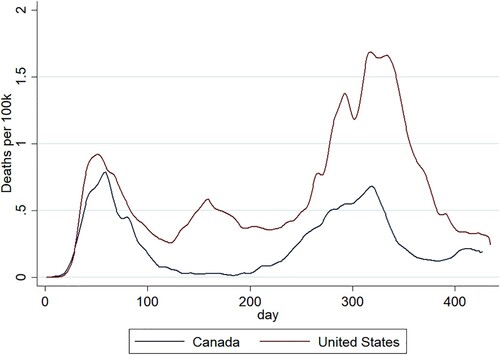
Finally, for the MSSD approach to be appropriate, there must exist significant differences in the dependent variable between cases. In fact, “one of the arguments against the most similar systems design is that such systems often do not show sufficient variation of the dependent variable” (Faruby, Citation1976, p. 154). The choice of Canada and the United States shields us from this potential critique; there has been extreme variation in death rates between the two countries in total and for nearly every week since the start of the pandemic (). Therefore, Canada and the United States constitute an ideal choice for MSSD research.
Figure 1. Daily deaths per 100,000 people in Canada and the United States. The x-axis corresponds with the number of days since each country reported at least one death from COVID-19.
We constrain the scope of this analysis to these two countries with similar national characteristics to logically reduce the number of competing causal mechanisms and bolster support for our overarching theory that political capacity plays a prominent but underappreciated role in our collective management of the pandemic. Empirically, our analysis focuses on the subnational units of each country. Just as substantive variation exists between the national mortality rates and political capacity of the United States and Canada, notable heterogeneity exists between the respective states and provinces. By adapting our political and policy measures of interest to these subnational units, we capture a higher degree of variation in the measures of interest and establish more robust support for our conclusions regarding the role of state capacity in managing the pandemic’s severity. To capture the extent to which political factors affect the evolution of the pandemic, we adopt the following general function:
From this general theory, we establish and test the following set of hypotheses:
COVID-19 mortality rates are reduced by timely and responsive policymaking.
COVID-19 mortality rates are reduced by state-level political capacity.
The efficacy of policy responsiveness is conditional on the state’s capacity to implement and enforce the selected policy measures.
Given the non-linear, time-dependent trajectory of deaths over time, and in line with the latest ecological research on the coronavirus (Prata, Rodriguez, & Bermejo, Citation2020; Wu et al., Citation2020), we utilize a generalized additive model (GAM) as our estimator. GAMs are frequently applied to problems of virology because of their efficiency in combining fixed, random, and non-linear effects. For our purposes, GAM allows us to model the time-based, path-dependent trajectory of death rates through a series of nonparametric, polynomial smoothing functions, estimated by restricted maximum likelihood (REML)Footnote1, while maintaining the interpretability of our parametric coefficients (Wood, Citation2017). To test our hypotheses, we apply the following statistical model to the Canadian provinces and American states at the state-week level:
where severity is represented by total deaths per 100,000 people, GDPPC represents per capita state and provincial gross domestic product, elders is the proportion of the population age 85 or older,Footnote2 and RPE is subnational relative political extraction, a component measure of political capacity, weighted by the state or province’s respective national RPE score.Footnote3 Responsiveness is a measure derived from the average weekly Oxford Stringency Index (OSI) score and lagged infection rates using the following equation:
Responsiveness, therefore, represents not just policy stringency in a vacuum, but rather the stringency of policy given the pace of infection.Footnote4 It, therefore, measures both policy stringency and, crucially, the timing of COVID-related policy measures. Minority Population represents the proportion of the population that are nonwhite, ethnic or racial minorities. Population Density captures provincial and state populations per square kilometer. Finally, s(week) represents the nonparametric smoothing function applied additively to week by the GAM estimator, where week is the number of weeks since each country reported at least one death from COVID-19. The underlying dataset measures mortality as the cumulative total at the end of a given week for each state and province and spans from the point at which each province and/or territory suffered its first recorded COVID-19 death until March 28, 2021.Footnote5
Contrasting COVID-19 conditions and responses
From the onset of the COVID-19 pandemic, researchers have sought to understand the social and political correlates of infection and mortality in an effort to explain the diverse outcomes observed throughout the world and develop the targeted mitigation strategies necessary to reduce the severity of this and future outbreaks. To date, research has revealed that population characteristics affiliated with wealth, population density, and age distribution, each play a prominent role in determining a community’s degree of vulnerability to transmission and lethality of the virus. While these factors do have their proper place in our global understanding of the pandemic, they are not sufficient to explain the disparate outcomes experienced in Canada and the United States.
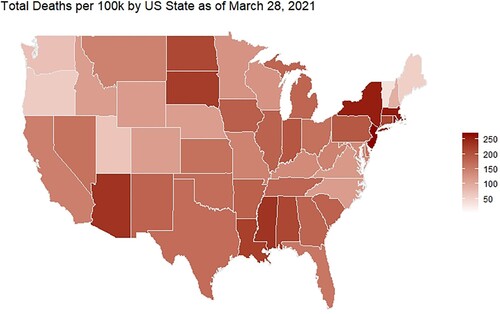
As illustrates, despite the national-level structural similarities outlined above, COVID-19 outcomes in the United States and Canada have followed diverging paths. By the 20th week after the first ten reported deaths, the United States had suffered 43 fatalities per 100,000 people, while Canada had suffered only 24 per 100,000. That variance transcended national statistics. As and demonstrate, severe subnational variation is also evident, with the United States generally underperforming the Canadian provinces. In fact, Prince Edward Island reported no COVID-19 deaths within the timespan of our data, despite being the most population dense of all Canadian provinces. British Columbia, New Brunswick, Newfoundland and Labrador, and Nova Scotia all have mortality rates lower than Hawaii and Vermont, the best performing states in the United States.
Figure 2. Comparative COVID-19 death tolls in Canada and the United States.
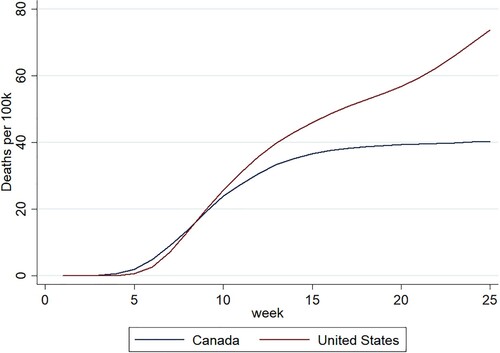
Figure 3. COVID-19 deaths per 100,000 within the Canadian provinces as of March 2021. Quebec omitted as outlier in the analysis.
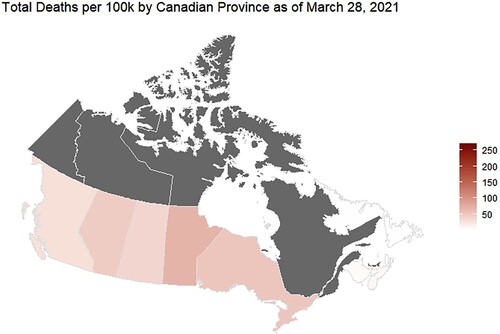
Figure 4. COVID-19 deaths per 100,000 within the United States as of March 2021.
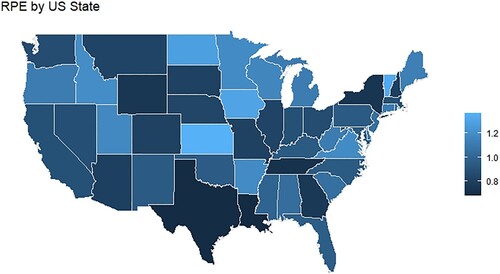
Structurally, Canada and the United States differ in one crucial respect. Canada’s political capacity is significantly greater than the United States, particularly in terms of its ability to extract financial resources from the population. Relative political extraction (RPE) “measures the ability of a government to obtain resources from a population given their level of economic development” (Arbetman-Rabinowitz et al., Citation2013). Canada’s national RPE score of 0.91 is one full standard deviation higher than the 0.70 of the U.S – ranking it 21st among OECD member countries, while the United States ranks 32nd within the 37-country collective. Additionally, the Canadian subnational governments hold far less variation in RPE than those of the United States, due in large part to Canada’s federal resource equalization program (Fisunoglu et al., Citation2020). and illustrate this rather extraordinary contrast.Footnote6 While the weighted subnational RPE of the Canadian provinces ranges from 0.869 to 0.951, with a mean of 0.904 and standard deviation of 0.033, the United States' weighted subnational RPE spans an expansive 0.477–1.094, with a mean of 0.693 and standard deviation of 0.135. Thus, indicating that at both the national and subnational levels, Canada is significantly more capable of compelling its population to comply with government demands and facilitating the implementation of policies which may be locally unpopular, but ultimately serve the greater interests of the country. Moreover, Canada is more adept at ensuring that all subnational entities have sufficient resources to implement the policies necessary to foster collective benefits and earn the public’s trust through the delivery of those benefits.
Figure 5. Canadian weighted provincial RPE.
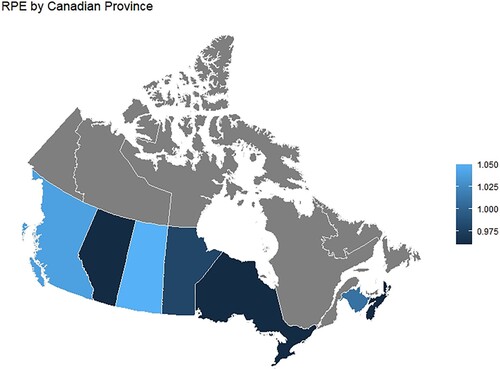
Figure 6. United States weighted state by state RPE.
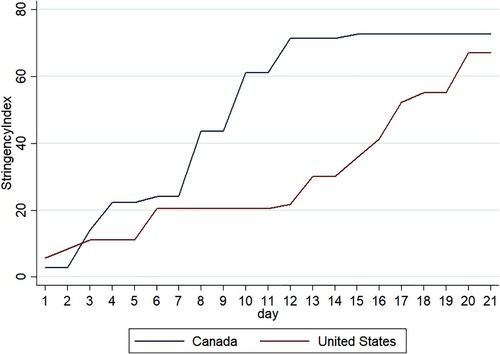
Similar patterns emerge in the two countries’ degrees of policy stringency. At the national level, the Canadian government demonstrated more immediate action at the onset of the pandemic. In the crucial early days, when swift action was essential to containing the exponential spread of the virus, Canada’s Oxford Stringency Index measure rose from zero to 43.52, while the United States rose to a mere 20.37, despite a comparable number of cases producing three times the fatalities (Worldometer, Citation2021).Footnote7 Over the following three days, Canadian stringency
rose an additional 64 percent to 71.3, while the United States remained essentially stagnant and would not catch up for another ten days (). Sub-nationally, Canada maintained policy measures that were both more stringent and more stable than the United States. Throughout the time period of our data, the Canadian provinces averaged OSI scores of 55.46 with a standard deviation of 10.39, while the United States maintained a mean OSI of 50.23 and a standard deviation of 15.17.
Figure 7. Overlaid time series of Oxford Stringency Index scores in Canada and the United States. The x-axis represents the number of days since the first non-retroactively reported death (U.S. = February 29, 2020. Canada = March 9, 2020).
Results
presents the empirical results of the generalized additive model (GAM) specification as applied to each of the fifty states and the eight Canadian provinces with comparable RPE measures and at least one COVID-19 death recorded in our data.Footnote8 Analysis spans from the week of each individual province/state’s first reported COVID-19 death until March 28, 2021. The dependent variable, Total Deaths per 100,000, as well as the independent variables GDP Per Capita and Population Density have been logged to approach a normal distribution. Outputs are reported for the model as applied to all states and provinces collectively, as well as separate, independent applications to Canada and the United States. All variables have been standardized to allow for direct comparison of their relative impacts. Each model run is applied to uniquely standardized variables due to the different data subsets.
Table 1. Results of a generalized additive model estimating the effects of political capacity and policy responsiveness on death rates from COVID-19 across Canadian provinces and U.S. states. All variables are standardized to allow for a comparison of the relative impact of each variable.
The results detailed in provide strong support for our full set of hypotheses. Each model run achieves an adjusted R-squared statistic exceeding 0.8 and each variable relevant to our theory achieves statistical significance at p < 0.000 across each run, except for the interactive term in model 2, which is significant at p < 0.01. Most of our controls also achieve significance and lend further support to the explanatory power of our design.
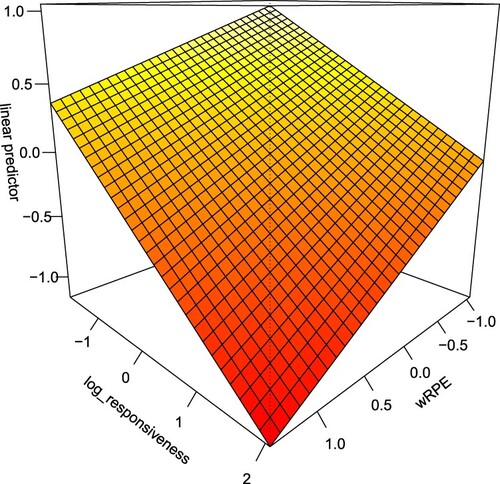
Model 1 is applied to the full sample of provinces and states. The leading coefficients, in terms of relative magnitude, are Policy Responsiveness, Population Density, and RPE. The interaction of RPE and Policy Responsiveness achieves significance at p < 0.000. Thus, a preliminary review of the results table indicates support for all three of our hypotheses. Responsive policy-making and state-level political capacity, as well as their interaction, have a significant negative association with COVID-19 mortality. However, as the reported values of the interaction’s constitutive terms do not represent their independent, average marginal effects, but their values given the conditioning variable equals zero, we examine the conditional marginal effects visualized in for a more meaningful review of the results.
Figure 8. Model 1 conditional marginal effects of Policy Responsiveness and weighted RPE on Total Deaths per 100,000. Full sample. All measures are standardized.
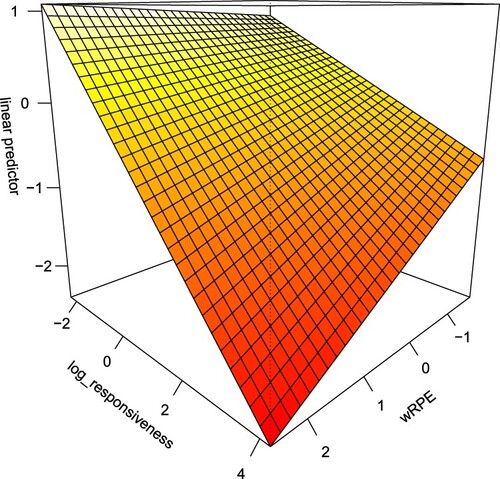
As illustrates, both Policy Responsiveness and RPE are clearly associated with declines in mortality. However, their associations are also distinctly constrained by each other. A state or province with maximum Policy Responsiveness and a standardized, weighted RPE of one, would achieve COVID-19 mortality rates that are about one full standard deviation lower than a state or province with equally responsive policy, but a standardized, weighted RPE of −1. Conversely, it is evident that RPE alone is insufficient. States or provinces with extremely polarized RPE scores but standardized policy responsiveness scores of −2 would not be expected to produce any improvement in mortality rates. As governments engage in policy, the slopes associated with that policy steepen as RPE increases.
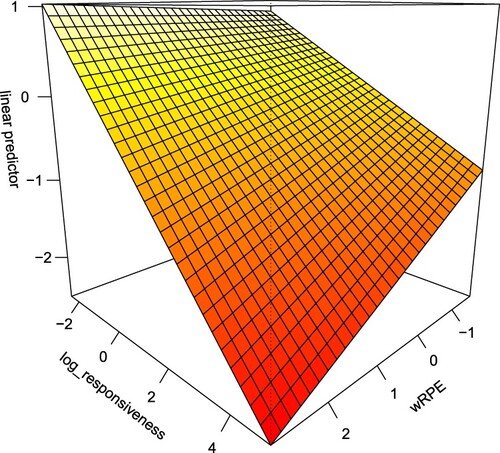
Similar patterns emerge in Canada. Results of model 2 suggest that the most influential variables in terms of relative magnitude are RPE, Policy Responsiveness, and Population Aged 85 and Up. Canada’s challenge in confronting mortality rates in its nursing home population is outlined above. These results are consistent with that literature. However, politics and policy outweigh even that well-documented component of this crisis.
illustrates the conditional marginal effects of politics and policy on COVID-19 mortality between the Canadian provinces. Note that while the strength of the conditional relationship is weakened from the full sample analysis of model 1, it remains prominent. Both of the slopes associated with Policy Responsiveness and RPE’s relationship to mortality rates steepen considerably as their conditional term increases.
Figure 9. Model 2 conditional marginal effects of Policy Responsiveness and weighted RPE on Total Deaths per 100,000. Canada sample. All measures are standardized.
Finally, the results of the independent United States analysis further solidify our hypotheses and support the preeminent role of government capacity and responsive policymaking in mitigating the worst effects of the COVID-19 pandemic. In this sample, consistent with the full sample, the leading coefficients, in terms of relative magnitude, are Policy Responsiveness, Population Density, and RPE. While in Canada the relative impact of Policy Responsiveness and RPE are effectively equal, Policy Responsiveness has a more substantive impact in the United States. This is borne out in both the results table and the marginal effects plot (). However, the United States continues to produce distinctly steeper slopes for high RPE states versus low.
Figure 10. Model 3 conditional marginal effects of Policy Responsiveness and weighted RPE on Total Deaths per 100,000. United States sample. All measures are standardized.
Conclusion
This research has addressed a key omission in scholars’ understanding of the underlying correlates of COVID-19 pandemic severity. While a torrent of research focused on this crisis has meaningfully advanced our knowledge, the interplay between policy choices and government’s capacity to implement such choices has been overlooked. As such, the divergent outcomes observed between nations as structurally similar as Canada and the United States – as well as divergent outcomes within states – have lacked sufficient explanation. We have illustrated the significant role that policy responsiveness and political capacity play in understanding these outcomes by offering a general theory of the underlying dynamic, deriving a series of hypotheses from that theory, and empirically testing those hypotheses both across and within two independent nations. By selecting the unique cases of Canada and the United States, we implicitly control for the influence of macro commonalities such as continental location, federal structure, liberal market economy, and life expectancy. By demonstrating that our hypotheses hold true across the subnational units of two unique countries, as well as across the aggregation of the subnational units of those countries, we demonstrate the robustness of our conclusions. To the extent that debate on the issue remains, the policies measured by the OSI and included with our responsiveness variable clearly have a negative impact on death rates from this coronavirus. Additionally, the capacity of the government to enforce those policies is instrumental. Governments with relatively low capacity cannot be expected to produce results equal to those with relatively higher capacity, ceteris paribus.
The policy implications of our findings are immense and warrant serious consideration and further study. As the world endures the second year of the pandemic, the impacts on international stability, trade, and migration are compounding. Domestic tensions, particularly in the United States, are also growing more severe. We believe that the tremendous variation in political capacity and policy choices between states in the United States leads to worse outcomes for all states. Further, we worry that the distribution and administration of vaccines have become yet another field on which the shortcomings of low-capacity governments will be evident, exacerbating this spillover effect. Further research in these areas is imperative. Federal governments must concern themselves with these threats at both the international and domestic levels and understand the role that policy and political capacity play in their ability to mitigate such risks. Leadership that promotes effective policy while bolstering political capacity where necessary is essential to success in combating this pandemic.
Disclosure statement
No potential conflict of interest was reported by the author(s).
Additional information
Notes on contributors
Joseph Immormino
Joseph Immormino is a research fellow at TransResearch Consortium. He is a PhD candidate in Computational Analytics at Claremont Graduate University.
Nicholas Stowell
Dr. Nicholas Stowell is a research fellow at TransResearch Consortium. He earned his PhD in Political Science from Claremont Graduate University in 2021.
Notes
1 The models are estimated in R using the MCVG package. We use REML to estimate smoothing parameters, which “allows us to control smoothness of predictor functions to prevent overfitting” and to “directly tackle the bias/variance tradeoff” (Larsen, Citation2015)
2 The model was tested on an assortment of age thresholds for the determination of the applied definition of elder population. Our findings revealed no substantive change to the measures of theoretical interest. However, using age 85 and over improved overall model performance and was selected for that reason.
3 RPE measures extraction given economic development. Subnational RPE measures are designed to compare between subnational units within a given country. Thus, to allow for cross-national comparison of subnational units, we weighted the subnational RPE scores by their respective national metrics.
4 For this analysis, OSI alone risks comparing the stringency of policy measures across incomparable environments. Provinces and states with relatively lower stringency at times of low infection may have an appropriately responsive policy, while those with higher stringency at times of higher infection may not. By estimating responsiveness as OSI/Infections we correct for that condition. However, the measure is susceptible to variance in testing capacities.
5 Data cutoff March 28, 2021 was to facilitate research of a continuing scenario. However, we note that by the Spring of 2021 vaccine distribution had been mainstreamed. Mass vaccination began a separate era of the COVID-19 pandemic worthy of its own independent follow-up study.
6 The province of Quebec and the three Canadian territories (Nunavut, Yukon, and Northwest Territories) are omitted due to substantive differences in governing relations with the Canadian federal government, as well as differences in central government transfer formulas, rendering them outliers in RPE estimation. In the United States, the District of Columbia and all unincorporated territories are omitted.
7 Based on the 9 days following the first reported death.
8 All Canadian provinces with the exception of Quebec and Prince Edward Island.
References
- Arbetman-Rabinowitz, M., Kugler, J., Abdollahian, M., Kang, K., Nelson, H. T., & Tammen, R. L. (2013). Political performance. In J. Kugler & R. L. Tammen (Eds.), Performance of nations (pp. 7–49). New York, NY: Rowan and Littlefield Publishers, Inc.
- Brown, K. A., Daneman, N., Chan, A., Schwartz, K. L., Garber, G. E., Costa, A. P., … Stall, N. M. (2020). Association between nursing home crowding and COVID-19 infection and mortality in Ontario, Canada. JAMA Internal Medicine, 181(2), 229–236.
- Canadian Institute for Health Information. (2020, May 25). Long-term care and COVID-19: International comparisons. Retrieved from cihi.ca: https://www.cihi.ca/en/long-term-care-and-covid-19-international-comparisons.
- Centers for Disease Control and Prevention. (2020, May 14). Retrieved from cdc.gov: https://www.cdc.gov/coronavirus/2019-ncov/need-extra-precautions/older-adults.html.
- Desmet, R., & Wacziarg, K. (2021). Understanding spatial variation in COVID-19 across the United States. Journal of Urban Economics. doi:10.1016/j.jue.2021.103332
- Faruby, I. (1976). Premises, promises, and problems of comparative foreign policy. Cooperation and Conflict, 11(3), 139–162.
- Fisman, D. N., Bogoch, I., Lapointe-Shaw, L., McCready, J., & Tuite, A. (2020). Risk factors associated with mortality among residents with coronavirus disease 2019 (COVID-19) in long-term care facilities in Ontario, Canada. JAMA Network Open, 3(7), 1–7.
- Fisunoglu, A., Kang, K., Arbetman-Rabinowitz, M., & Kugler, J. (2020). Relative political capacity dataset (Version 2.4). Retrieved from Harvard Dataverse: https://dataverse.harvard.edu/dataset.xhtml?persistentId=doi:10.7910/DVN/NRR7MB.
- Fukuyama, F. (2020, August). The pandemic and political order. Foreign Affairs, 99, 26.
- Hale, T., Angrist, N., Kira, B., Petherick, A., Phillips, T., & Webster, S. (2020). Variation in government responses to COVID-19 Version 7.0 (Blavatnik School of Government Working Paper).
- Hale, T., Hale, A. J., Kira, B., Petherick, A., Phillips, T., Sridhar, D., … Angrist, N. (2020). Global assessment of the relationship between government response measures and COVID-19 deaths. COVID-19 Sars-CoV-2 preprints from medRxiy and bioRxiy.
- Hsu, A. T., Lane, N., Sinha, S. K., Dunning, J., Dhuper, M., Kahiel, Z., … Sveistrup, H. (2020). Impact of COVID-19 on residents of Canada's long-term care homes – ongoing challenges and policy responses. International Long-Term Care Policy Network, 17, 1–18.
- Kraemer, M. U., Yang, C.-H., Gutierrez, B., Wu, C.-H., Klein, B., Pigott, D. M., … Scarpino, S. V. (2020). The effect of human mobility and control measures on the COVID-19 epidemic in China. Science, 368(6490), 493–497.
- Larsen, K. (2015). GAM: The predictive modeling silver billet. Retrieved from Stitchfix: https://multithreaded.stitchfix.com/assets/files/gam.pdf.
- Lecours, A., & Beland, D. (2013). The institutional politics of territorial redistribution: Federalism and equalization policy in Australia and Canada. Canadian Journal of Political Science, 46(1), 93–113.
- Mayo Clinic. (2021, May 18). Retrieved from mayoclinic.org: https://www.mayoclinic.org/diseases-conditions/coronavirus/expert-answers/novel-coronavirus/faq-20478727.
- Prata, D. N., Rodriguez, W., & Bermejo, P. (2020). Temperature significantly changes COVID-19 transmission in (sub)tropical cities of Brazil. Science of the Total Environment, 729, 1–7.
- The Economist. (2021, May 15). Counting the dead. London: The Economist.
- The World Bank. (2021). World Bank open data. Retrieved January 20, 2021, from https://data.worldbank.org/.
- Turgeon, L., Papillon, M., Wallner, J., & White, S. (2014). Comparing Canada: Methods and perspectives on Canadian politics. Vancouver: UBC Press.
- van Klingeren, M., Boomgaarden, H. G., Vlietgenthart, R., & de Vreese, C. H. (2015). Real world is not enough: The media as an additional source of negative attitudes toward immigration. European Sociological Review, 31(3), 268–283.
- Wood, S. N. (2017). Generalized additive models: An introduction with R. Boca Raton, FL: CRC Press.
- World Health Organization. (2021, May 12). Retrieved from who.int: https://www.who.int/emergencies/diseases/novel-coronavirus-2019/advice-for-public.
- Worldometer. (2021, May). United States. Retrieved from worldometer.info: https://www.worldometers.info/coronavirus/country/us/.
- Wu, Y., Jing, W., Ma, Q., Yuan, J., Wang, Y., Du, M., … Liu, M. (2020). Effects of temperature and humidity on the daily new cases and new deaths of COVID-19 in 166 countries. Science of the Total Environment, 729, 1–7.
- Yourish, K., Lai, K. R., Ivory, D., & Smith, M. (2020, May 11). One-third of all U.S. coronavirus deaths are nursing home residents or workers. New York Times.
Appendix
Table A1. Most similar systems design reference data and sources.
Table A2. Scatterplot matrix of relevant variables.
Table A3. Correlation matrix of relevant variables.
Table A4. Summary statistics for model variables.