?Mathematical formulae have been encoded as MathML and are displayed in this HTML version using MathJax in order to improve their display. Uncheck the box to turn MathJax off. This feature requires Javascript. Click on a formula to zoom.
ABSTRACT
Arctic fox (Vulpes lagopus) and its tundra habitat are a unique system for the study of rabies virus epidemics. Contrary to theoretical calculations reporting a critical density (KT) of approximately 1 fox/km2 for rabies endemicity, arctic rabies persists at densities below this. The calculation of KT = 1 fox/km2 assumes uniform fox density across the landscape and unrestricted mixing between susceptible and infected foxes. We hypothesize that spatial heterogeneity arising from resource distribution or social structure may result in regions where rabies is endemic, even though average fox densities at the regional or landscape-level are below KT. To expand upon the limited body of research surrounding arctic rabies persistence, we examine arctic rabies via a two-patch structure. We find that arctic rabies can persist in heterogeneous landscapes where the mean carrying capacity is below the threshold carrying capacity required for endemicity in homogeneous landscapes. Rabies endemicity in low-carrying capacity regions within heterogeneous landscapes is further facilitated by high transmission rates, potentially due to non-breeding foxes (i.e. floaters), and when between-patch movement is restricted to latent and infected foxes. Our results suggest that rabies may persist in heterogeneous landscapes when the mean carrying capacity is as low as 0.25 foxes/km2.
Résumé
Le renard arctique (Vulpes lagopus) et son habitat toundrique constituent un système unique pour l’étude des épidémies du virus de la rage. Contrairement aux calculs théoriques rapportant une densité critique (KT) d’environ 1 renard/km2 pour l’endémicité de la rage, la rage arctique persiste à des densités moindres. Le calcul de KT = 1 renard/km2 suppose une densité uniforme de renards dans le paysage et un libre mélange des renards susceptibles et infectés. Nous posons l’hypothèse que l’hétérogénéité spatiale due à la répartition des ressources ou à la structure sociale pourrait résulter en régions où la rage est endémique même si les densités moyennes de renards sont inférieures à KT à l’échelle régionale ou du paysage. Pour ajouter aux connaissances limitées sur la persistance de la rage dans l’Arctique, nous examinons la rage arctique selon une structure bi-parcellaire. Nos résultats montrent que la rage arctique peut persister dans des paysages hétérogènes quand la capacité de charge moyenne est sous le seuil d’endémicité des habitats homogènes. L’endémicité de la rage dans les régions à faible capacité de charge dans des paysages hétérogènes est par ailleurs facilitée par des taux de transmission élevés, potentiellement attribuables aux renards non-reproducteurs et à la restriction des mouvements inter-parcellaires aux renards latents et infectés. Nos résultats suggèrent que la rage peut persister dans des paysages hétérogènes jusqu’à une capacité de charge moyenne aussi faible que 0,25 renard/km2.
Introduction
Thresholds for disease persistence derived from models assuming homogeneous mixing, and without spatial structure identify critical densities necessary for disease spread (Lloyd-Smith et al. Citation2005; Keeling and Rohani Citation2008). However, those commonly used models can predict densities not found in nature. For instance, Anderson et al. (Citation1981) predicts rabies persistence in Europe when densities of its regional host, red fox (Vulpes vulpes), are as low as 1 fox/km2, yet rabies persists in the tundra when densities of arctic fox (Vulpes lagopus) are well below this threshold (Simon et al. Citation2019). One way such a contradiction could exist is that environmental heterogeneity may lower threshold host densities for disease persistence. In this scenario, connectivity between populations can facilitate ‘rescue effects’, preventing disease extirpation that would otherwise occur in an equivalent homogenous environment (Hess Citation1996; Hagenaars et al. Citation2004). Here, we hypothesize that spatial structure reduces the threshold fox density for rabies persistence, to be consistent with reported arctic fox densities and observed rabies endemicity.
Previous results from metapopulation theory offer additional insights into how spatial structure will affect predicted rabies dynamics. For disease persistence in a metapopulation, at least one of the subpopulations must be able to support the disease independently (Hethcote Citation1976). For a two-patch model, where only one patch can support the disease independently, either the disease dies out or persists in both patches, depending on the between-patch connectivity (Wang and Zhao Citation2004). More generally, pairing two populations with different qualitative or quantitative behavior can lead to the emergence of new population dynamics and novel spatial patterns (Pedersen et al. Citation2016). Spatial structure and population connectivity affect persistence and threshold values (Bolker and Grenfell Citation1995; Wang and Mulone Citation2003; Wang and Zhao Citation2004), and once a disease becomes endemic, the intensity of outbreaks and fade-out dynamics can be influenced by the spatial arrangement (Post et al. Citation1983; Sattenspiel Citation1987). Considering arctic rabies within a metapopulation structure complements previous research that applies metapopulation theory to communicable diseases such as hepatitis A, gonorrhea, and HIV, which are all characterized by non-homogenous mixing and infections (Lajmanovich and Yorke Citation1976; Sattenspiel Citation1987; Jacquez et al. Citation1988). In these instances, the inclusion of spatial heterogeneity is justified in that humans, as a host, violate homogenous mixing assumptions, since most people use the same travel routes, work in the same areas, and reside in the same locations daily.
Of the various host species and their habitable environments, the arctic fox and its tundra habitat have proved to be a unique system for the rabies virus. Contrary to the well-documented disease density threshold (KT) of approximately 1 fox/km2 (Anderson et al. Citation1981), arctic rabies persists endemically at densities below this. Indeed, landscape-level arctic fox densities rarely exceed 0.3 breeders/km2 (Angerbjörn et al. Citation1999; Eide et al. Citation2004; Simon et al. Citation2019). When these numbers are scaled into total number of foxes per square kilometer, by including non-breeding foxes and juvenile survival, Arctic densities are still unlikely to exceed an average of 1 fox/km2. While most Arctic regions have average densities below KT, some local areas have carrying capacities that exceed the KT threshold. These areas are, for instance, town dump sites, migratory bird colonies, and carrion along caribou migratory pathways, all of which are potentially regions within a metapopulation that can independently support rabies (Harris Citation1981; Trewhella et al. Citation1988; Savory et al. Citation2014), thus meeting Hethcote’s (Citation1976) requirement for disease persistence in a metapopulation. In addition, ‘floater’ foxes move between social groups, having high mobility rates, and are an overlooked aspect of arctic rabies persistence (Lindström Citation1989).
Previous rabies modeling research provides meaningful insights and shows some agreement with empirical observations. Specifically, previous models predict spread rates (Källén et al. Citation1985; Murray et al. Citation1986; Smith et al. Citation2002) and define thresholds for vaccination regimes and efficient implementation (Broadfoot et al. Citation2001; Russell et al. Citation2006; Asano et al. Citation2008; Clayton et al. Citation2010; Neilan and Lenhart Citation2011). When the carrying capacity of all foxes in an area is greater than the threshold density (K>KT), either dampened oscillations or limit cycles result, and these characteristics have been well documented in the epidemiological data of red fox populations across Europe and most of North America (Anderson et al. Citation1981). Still, many critical questions, such as the spread and maintenance of rabies in the Arctic, are largely unresolved (Mørk and Prestrud Citation2004). Simon et al. (Citation2019) extended Anderson et al. (Citation1981) to consider high transmission rates, short incubation periods, prolonged infectious periods, periodicity in the birth rate, and interaction with red foxes. With these modifications to Anderson’s model, rabies can persist in the Arctic with fox densities lower than 0.15 fox/km2, yet at low densities, immigration will cause sporadic outbreaks of rabies, and this leaves open the question of dispersal’s role in arctic rabies endemicity (Simon et al. Citation2019).
Without spatially structured source-sink disease dynamics, host interactions are not partitioned into a biologically representative scheme but are represented as an average; without spatial structure the potential for rescue effects and disease reintroduction is eliminated. Here, we formulate and parameterize a two-patch disease model to explore rabies persistence in the Arctic and disease dynamics in low-density regions. We identify the necessary conditions for rabies endemicity in a metapopulation and consider how rabies can persist at landscape-level densities below KT, given the assumptions our model makes about space, connectivity, and individuals.
Methods
Two-patch model
We use a two-patch deterministic model (). One of the two patches is a low-carrying capacity patch (K1<KT) that is characteristic of many Arctic areas (hereafter referred to as the ‘sink patch’, and where tundra-specific variables and parameters are indexed with a subscript 1). The sink patch is coupled with a higher-carrying capacity patch (K2 > K1) to represent the area surrounding a town, migratory pathway, or a migratory bird colony (hereafter referred to as the ‘source patch’, where specific variables and parameters are indexed with a subscript 2).
Figure 1. A two-patch model describing rabies dynamics. The epidemiological status of foxes are susceptible, S1 and S2; latent, E1 and E2; and infected, I1 and I2, where the subscript 1 indicates residence on a sink (low-carrying capacity) patch and the subscript 2 indicates residence on a source patch (high-carrying capacity). The transmission rate is β, the rate of disease progression from exposed to infected is p, and the disease-induced mortality rate is v. The inter-patch movement rate, from a patch i to j is mij and the epidemiological status of foxes does not change while travelling between patches. The model assumes that each of these parameters (β, p, and v) are the same for all individuals. The figure does not show reproduction, mortality, or density-dependent constraints for visual clarity. See EquationEquations 1(1)
(1) –Equation6
(6)
(6) for the complete model
The within-patch epidemiological dynamics, including density-dependent population growth, are based on Anderson et al. (Citation1981). Within a patch, i, the model variables describe the density of susceptible, Si, latent or exposed, Ei, and infected, Ii, foxes (fox/km2), and the model does not consider recovery as rabies is almost always fatal. The density on patch i is , and rabies percent prevalence is defined as
which is a percent ranging between 0 and 100. The rate that each susceptible fox is exposed to rabies per infected fox is β (foxes/km2)−1 yr−1 (transmission dynamics assume mass action). Foxes in the latent compartment (Ei) have the virus but are not yet contagious to others. The rate of disease progression from Ei to Ii is p, and the rate of disease-induced mortality for infected individuals is v (both with units yr−1). Our formulation assumes that only foxes susceptible to rabies (S1 and S2) can reproduce, as the degenerative effects of rabies make it unlikely that foxes of any other epidemiological status would be able to reproduce, and assumes that pups are born susceptible. Foxes disperse between patches at the rate mji from patch j to i. Parameter values are the same on both patches except interpatch dispersal, mji, and the carrying capacity, Ki, which appears in EquationEquations 1
(1)
(1) –Equation6
(6)
(6) via µi, since µi = r/Ki (i.e. see ). The model dynamics are,
Table 1. Parameter descriptions for the two-patch rabies model (EquationEquations 1(1)
(1) –Equation6
(6)
(6) ). Parameters are the same as Anderson et al. (Citation1981) and Simon et al. (Citation2019), but where subscripts denote patch-specific values. The parameter values are the same on each patch, except for carrying capacity and dispersal
Parameter values provided in are based on Anderson et al. (Citation1981) and Simon et al. (Citation2019), and parameter values were also cross-referenced with Mørk and Prestrud (Citation2004) to ensure biological relevance for arctic fox populations. The parameter set, derived from demographic studies of foxes, yields a theoretically simulated disease density threshold of 1 fox/km2. Anderson et al. (Citation1981) notes that observed epidemiological evidence suggests KT is between 0.25 and 1.0 fox/km2; data which reflect realized thresholds rather than a fundamental threshold. We move forward with the above parameter set to provide comparable results to equivalent spatially homogenous models, and changes in KT via our different patch and demographic configurations are relative to the initial threshold, KT = 1 fox/km2, and those baseline parameters.
To estimate carrying capacity, we assumed that the estimated densities of foxes are near carrying capacity, and we included breeding pairs, juveniles that remain at the den, and adult non-breeding foxes (floaters). The density of breeders is estimated as 0.02–0.3 breeders/km2 (Angerbjörn et al. Citation1999). The regression given by Strand et al. (Citation1995) estimates litter size from placental scars, giving an average litter of 9 pups for a breeding pair. Pup to juvenile survival is about 10% (Meijer et al. Citation2008), so there are approximately 0.45 juvenile foxes/breeder/year. Next, we consider floaters, which have been documented as up to 25% of the population (Lindström Citation1989), and for this study we assume floaters are on average 20% of the population. The carrying capacity estimate, per breeder, is (1. As the density of breeding pairs spans a range that is 15x greater than its lower bound, we will estimate low-, mid- and high-carrying capacity values for the sink patch to acknowledge this uncertainty. Our estimates for the carrying capacity on the sink patch are:
(Low),
(Mid),
(High).
The transmission rate for rabies is estimated to be (Anderson et al. Citation1981; Llyod Citation1980). However, it is unclear whether this estimate is calculated for resident foxes or also considers highly mobile ‘floaters’, which may be 7–10 times more mobile (Lindström Citation1989). When floaters are excluded from the
estimate, and given our previous assumption that floaters are 20% of the population, an estimate of the transmission rate that considers floaters would range from
. Further explanation of this calculation and its assumptions can be seen in Appendix 2.
To perform our analyses, we numerically solved EquationEquations (1(1)
(1) –Equation6
(6)
(6) ) using the ode45 function in MATLAB Citation2018a until the total population size reached an equilibrium state. The system of equations and the computer code are available via the following link: https://doi.org/10.6084/m9.figshare.c.4840710
Results
Low to intermediate levels of dispersal in heterogeneous environments can support rabies in low-carrying capacity ‘sink’ patches, where rabies would be absent if the patch was isolated, or if the landscape was homogeneous with the carrying capacity equal to this low value, K1 (). As the carrying capacity on the sink patch increases toward the threshold carrying capacity in a homogeneous environment, KT, the sink patch requires less augmentation via dispersal from the source patch to maintain disease, which is reflected by the expanding parameter space for endemicity as shown for the low- (), mid- (), and high- () estimates for K1. Disease is supported in the sink patch until dispersal from the source patch removes too many susceptible and infected foxes, such that disease dynamics cannot be maintained on the source patch, at which point, the disease dies out in both patches ().
Figure 2. Rabies is endemic to the sink patch (low-carrying capacity), where disease would otherwise be absent, when low to intermediate levels of movement couples the disease dynamics between the sink and source (high-carrying capacity) patches. Panels show rabies prevalence, (100(E1+I1)/N1), on the sink patch (% prev (1)) for our three estimates of carrying capacity with K1 equal to low: 0.036 (a); mid: 0.29 (b), and high: 0.54 (c) fox/km2. Rabies prevalence (%) on the sink patch is highest for large values of the carrying capacity in the source (large K2), large values of the carrying capacity in the source (c; high estimate of K1), and for intermediate movement rates to the sink from the source patch (m21), a pattern that is explained further in . Parameter values are given in and m12 = 0.25
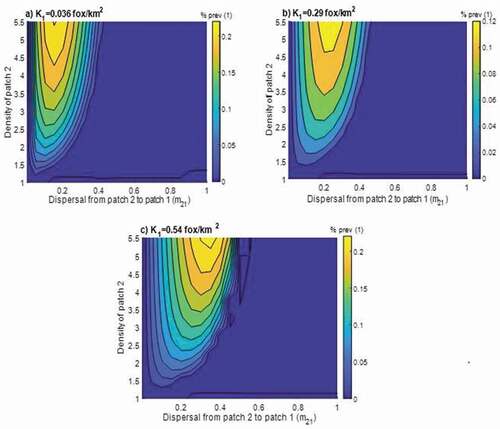
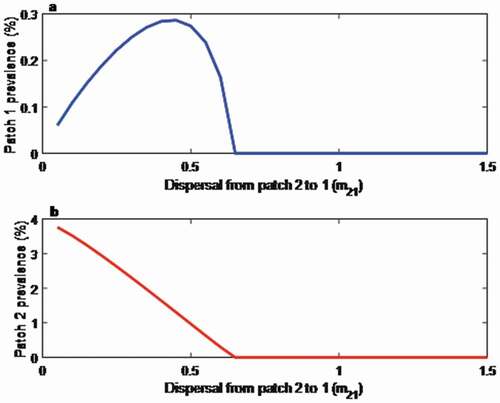
Figure 3. Rabies prevalence (%) on the sink patch (a) peaks at intermediate movement rates because high movement rates eradicate the infection in the source patch (b). For high levels of movement, the source patch cannot maintain its function as a disease source when the density of susceptible and infected foxes are depleted through movement and become too few to sustain the epidemic. Parameter values are given in , with m12 = 0.25, K1 = 0.54 fox/km2, and K2 = 5 fox/km2
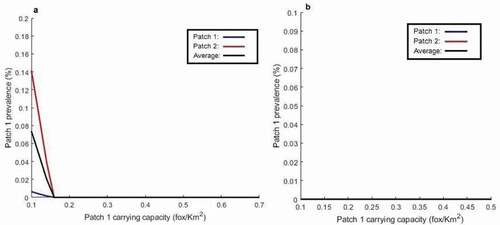
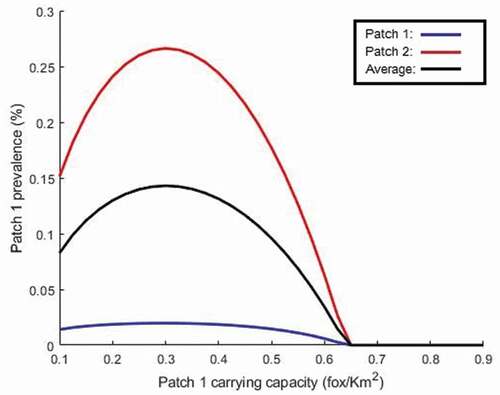
In a heterogeneous two-patch landscape, rabies can persist when the landscape-level mean carrying capacity is below the threshold carrying capacity for rabies endemicity in a homogeneous landscape, KT (). When the landscape-level mean carrying capacity is fixed at 0.9 foxes/km2, and different combinations of K1 and K2 are considered, we find that rabies prevalence is highest when the carrying capacities on the sink and source patches are the most different (). However, for lower values of the landscape-level mean carrying capacity, for example, = 0.5 fox/km2, rabies endemicity is not possible (see Appendix 3), as infection prevalence on the source patch is too low to both sufficiently subsidize the sink patch and maintain disease locally.
Figure 4. Rabies can be endemic in a heterogeneous landscape where the mean carry capacity is less than the threshold carrying capacity for rabies endemicity in a homogeneous landscape. For our parameter values (), rabies is endemic in a homogenous landscape when the carrying capacity is greater than 1 fox/km2 (K>KT = 1; (Andersen and May (1981)). We set the landscape-level mean carrying capacity for our two-patch model to = (K1 +K2)/2 = 0.9 foxes/km2. When K1 =K2 =
=0.9< KT (far right on the x-axis), no disease occurs on either patch since the landscape is homogeneous; however, as the variance between the two carrying capacities on each patch increases (toward the left on the x-axis), rabies becomes established on both patches (red and blue lines). The between-patch movement rates are m12 =m21 =0.25, and all other parameter values are as given in
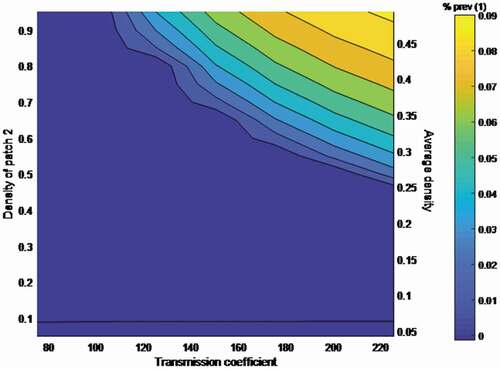
We estimate that rabies can persist in fox populations with heterogeneous environments where the mean carrying capacity is as low as ~0.25 foxes/km2 and the carrying capacity in the sink patch is as low as 0.036 foxes/km2 (). To generate this lower bound, we considered the maximum feasible estimate of β = 224 km2/foxyr and our lowest estimate of fox carrying capacity.
Figure 5. Higher transmission rates, for example, due to highly mobile ‘floater’ foxes, allow for rabies endemicity for landscape-level carrying capacities as low as 0.25 foxes/km2. The transmission rate is elevated by floaters or higher mobility foxes (we consider a range of values beginning from the baseline value of 80 and increase to 224 km2 foxes−1 yr−1). With the carrying capacity on the sink patch set to its lowest estimate: K1 =.036 fox/km2, we find that rabies can persist when the carrying capacity on the source patch is ~0.46 foxes/km2 (the value of K2 for the blue contour when β = 224 km2/foxes−1 yr−1) corresponding to a landscape-level mean carrying capacity of ~0.25 foxes/km2, as seen on the right y-axis. Parameter values are m12 =m21 =0.1 yr−1, and all other parameters are as described in
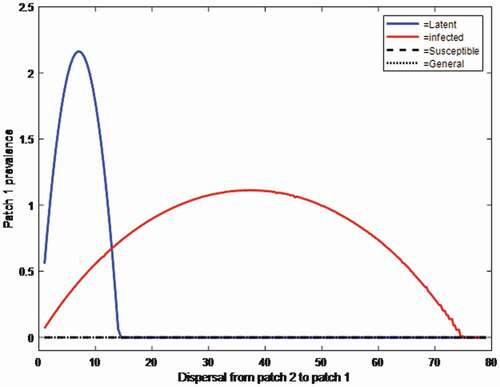
We found that rabies persistence is sensitive to our assumptions restricting the epidemiological status of dispersing foxes (). We set K1 = 0.54 foxes/km2 and K2 = 2 foxes/km2 and found that irrespective of the level of dispersal from the source to the sink patch, rabies could never persist if all epidemiological compartments disperse equally, or if only susceptible foxes disperse, for dispersal rates >1 yr−1 (, black lines). By contrast, rabies did persist when only latent or infected foxes disperse (, blue and red lines). Rabies persistence occurred over the widest range of ecological conditions when only infected foxes dispersed; however, rabies prevalence reached its highest value when only latent foxes disperse.
Figure 6. Rabies can be endemic on the sink patch, when it might otherwise be eliminated (black), if between-patch movement occurs for only infected foxes (red) or only latent foxes (blue). Assuming that between-patch movement occurs for foxes with all epidemiological statuses or only for susceptible foxes, then rabies cannot persist for a wide range of movement rates from the source to the sink patch (black dashed and dotted lines), but when assuming only infected foxes move between patches rabies is present on the sink patch for a wide range of movement rates (red). Assuming that only latent foxes move between patches, rabies prevalence on the sink patch can be high, but results in the extinction of the fox population for high movement rates (blue). The model formulation is described in Appendix 1 and parameters are given in , with K2 = 2 fox/km2, K1 = 0.54 fox/km2, and m12 = 0.25 yr−1
Discussion
Low fox densities and spatial discontinuity heavily influence rabies disease dynamics in the Arctic. Spatially homogenous disease models, which assume uniform density and mixing, typically give a useful simplification of infection dynamics, as seen in Anderson et al. (Citation1981). The increased resolution that heterogeneity gives a model is especially important near threshold values, where small changes can shift the qualitative outcome of a deterministic model. Using spatial heterogeneity as a lens to view arctic rabies, we extended the work of Simon et al. (Citation2019) whereby infected animals subsidize the system via an unspecified source without any dynamics. Doing so, we determined the conditions in which rabies can persist in the Arctic under a two-patch structure, where infectious individuals move between source and sink patches.
We showed endemicity in the low-carrying capacity patch when paired with a higher carrying capacity disease source patch. This was observed across a range of low-densities and dispersal values (), and when latent only or infected only individuals move between patches (). We found that rabies can persist when the average carrying capacity, = (K1+K2)/2, across the two patches in the metapopulation is less than KT = 1 fox/km2 (). Our results are consistent with previous studies. Like Hethcote (Citation1976), we found that for a low-carrying capacity patch to support disease, the subsidization from the source patch must not be so much that it suppresses disease dynamics in that patch (). We also found equilibrium rabies prevalence in the metapopulation peaks with low-level symmetric bi-directional dispersal () as noted in Gurarie and Seto (Citation2008), and further extend those results by showing that high levels of dispersal can maximize disease prevalence when only latent, or infectious individuals disperse ().
We examined the potential for higher mobility of arctic foxes via the transmission coefficient, β, as floater foxes may play a major role in disease transmission. We showed endemicity in all low-carrying capacity patches across a wide range of β values, and for larger β values, even when the source patch carrying capacity (K2) was well below KT (). show the plausibility of rabies on low-carrying capacity patches; however, if we assume that the neurological effects of rabies make its host the most likely demographic to disperse (), then there is a much larger parameter space that will allow for rabies persistence in the Arctic than seen in . This is particularly relevant, given that specific strains of the virus can influence the dispersal and habitat permeability to infected individuals (Scott Citation1988), and rabies may alter movement patterns (Barton et al. Citation2010), which is in contrast to the well-studied territoriality and demographic dispersal events observed in fox populations.
We independently considered several mechanisms that facilitated rabies endemicity at low carrying capacity, yet it is likely that many of these mechanisms are working in combination to create an environment where rabies is endemic at extremely low densities. Furthermore, we used a two-patch system; however, additional patches would allow for a lower threshold for endemicity, as a single patch could potentially experience the additive effects of multiple patches contributing to or subsidizing that single patch population and disease dynamics. With the presence of a disease reservoir, i.e., around towns or goose colonies, floater foxes with higher transmission rates, and dispersal of foxes with latent or clinical rabies infection, we suggest it is feasible to have rabies endemicity in landscapes where the average landscape density is 0.25 fox/km2, and where sink patches have fox densities of 0.036 fox/km2 (see for details). Whereas we consider patch dynamics in the context of spatial heterogeneity and the related assumptions, it has also been noted that positive temporal autocorrelation and dispersal can enhance metapopulation persistence (Matthews and Gonzalez Citation2007; Roy et al. Citation2005), even when that metapopulation is composed entirely of sinks (Manojit et al. Citation2005).
A discrete-patch metapopulation ensemble resembles the structure of the Arctic: the discrete patches are disconnected by several land masses (e.g. mainland Canada), island systems (e.g. Greenland), and archipelagos (e.g. Svalbard) connected by sea ice. Genetic studies show that strains of rabies are spread between these patches, as consistent with the assumptions of metapopulation epidemic models for arctic foxes (Raundrup et al. Citation2015; Hanke et al. Citation2016). The geography of Svalbard, an endemically infected area, is consistent with the discrete space assumption of a disease metapopulation model. The most likely origin of rabies in Svalbard is via the migration of arctic foxes from Greenland or the Siberian islands (Mørk et al. Citation2011). On the island of Spitsbergen in the Svalbard archipelago, the density of breeding foxes is approximately 0.1–0.15 fox/km2 with prevalence values of ~0.3% (Eide Citation2002; Mansfield et al. Citation2006; Mørk et al. Citation2011). These results closely mirror those seen in our low-carrying capacity patches when connected to a disease source.
Rabies is usually absent on the island of Newfoundland, but in the spring of 2002, Newfoundland saw its first outbreak of rabies in 14 years (Nadin-Davis et al. Citation2008). It is assumed that the disease was introduced to the island from an infected mainland fox that travelled on an ice sheet across the 9-mile-wide Strait of Belle Isle from Labrador. This outbreak captures the essence of arctic rabies; it is a disease that is largely governed by the spatial arrangement of the Arctic and its connectivity. Here, we examined arctic rabies through this lens using a two-patch structure and found that rabies can persist endemically in the Arctic via source-sink dynamics, partitioning of densities, selective dispersal, and increased mobility. These all provided realistic parameter space for rabies endemicity, further supported by the disease dynamics observed in Arctic regions characterized by a metapopulation structure. Our study expanded upon the limited body of research surrounding the persistence of arctic rabies and showed the feasibility of endemicity at low densities by considering spatial dynamics.
Acknowledgments
We would like to thank J. Marino, A. Fofana, A. McLeod, and M. Noonan for their helpful comments on previous drafts of this paper.
Disclosure statement
The authors report no financial interests or conflict of interests.
Additional information
Funding
References
- Anderson MR, Helen CJ, Robert MM, Anthony MS. 1981. Population dynamics of fox rabies in Europe. Nature. 289:765–771. doi:https://doi.org/10.1038/289765a0.
- Angerbjörn A, Tannerfeldt M, Erlinge S. 1999. Predator-prey relationships: arctic foxes and lemmings. J Anim Ecol. 68:34–49. doi:https://doi.org/10.1046/j.1365-2656.1999.00258.x.
- Asano E, Gross L, Lenhart S, Real LA. 2008. Optimal control of vaccine distribution in a rabies metapopulation model. Math Biosci Eng. 5:219–238.
- Barton HD, Gregory AJ, Davis R, Hanlon CA, Wisely SM. 2010. Contrasting landscape epidemiology of two sympatric rabies virus strains. Mol Ecol. 19:2725–2738. doi:https://doi.org/10.1111/j.1365-294X.2010.04668.x.
- Blackwood JC, Streicker DG, Altizer S, Rohani P. 2013. Resolving the roles of immunity, pathogenesis, and immigration for rabies persistence in vampire bats. P Natl Acad Sci USA. 110:20837–20842. doi:https://doi.org/10.1073/pnas.1308817110.
- Bolker B, Grenfell B. 1995. Space, persistence and dynamics of measles epidemics. Philos T Roy Soc B. 348:309–320.
- Brauer F, van den Driessche P. 2001. Models for transmission of disease with immigration of infectives. Math Biosci. 171:143–154. doi:https://doi.org/10.1016/S0025-5564(01)00057-8.
- Broadfoot JD, Rosatte RC, O’Leary DT. 2001. Raccoon and skunk population models for urban disease control planning in Ontario, Canada. Ecol Appl. 11:295–303. doi:https://doi.org/10.1890/1051-0761(2001)011[0295:RASPMF]2.0.CO;2.
- Clayton T, Duke-Sylvester S, Gross LJ, Lenhart S, Real LA. 2010. Optimal control of a rabies epidemic model with a birth pulse. J Biol Dynam. 4:43–58. doi:https://doi.org/10.1080/17513750902935216.
- Eide NE. 2002. Spatial ecology of arctic foxes. Relations to resource distribution, a spatiotemporal dynamics in prey abundance [Doctor Scientiarum Thesis]. Norway: Agricultural University of Norway. 82.
- Eide NE, Jepsen JU, Prestrud P. 2004. Spatial organization of reproductive Arctic foxes Alopex lagopus: responses to changes in spatial and temporal availability of prey. J Anim Ecol. 73:1056–1068. doi:https://doi.org/10.1111/j.0021-8790.2004.00885.x.
- Gurarie D, Seto EY. 2008. Connectivity sustains disease transmission in environments with low potential for endemicity: modelling schistosomiasis with hydrologic and social connectivities. J Roy Soc Interface. 6:495–508. doi:https://doi.org/10.1098/rsif.2008.0265.
- Hagenaars TJ, Donnelly CA, Ferguson NM. 2004. Spatial heterogeneity and the persistence of infectious diseases. J Theor Biol. 229:349–359. doi:https://doi.org/10.1016/j.jtbi.2004.04.002.
- Hanke D, Freuling CM, Fischer S, Hueffer K, Hundertmark K, Nadin-Davis S, Marston D, Fooks AR, Bøtner A, Mettenleiter TC, et al. 2016. Spatio-temporal analysis of the genetic diversity of Arctic rabies viruses and their reservoir hosts in Greenland. PLoS Neglect Trop D. 10(7):e0004779. doi:https://doi.org/10.1371/journal.pntd.0004779
- Harris S. 1981. An estimation of the number of foxes (Vulpes vulpes) in the city of Bristol, and some possible factors affecting their distribution. J Appl Ecol. 18:455–465. doi:https://doi.org/10.2307/2402406.
- Hess G. 1996. Disease in metapopulation models: implications for conservation. Ecology. 77:1617–1632. doi:https://doi.org/10.2307/2265556.
- Hethcote HW. 1976. Qualitative analyses of communicable disease models. Math Biosci. 28:335–356. doi:https://doi.org/10.1016/0025-5564(76)90132-2.
- Jacquez JA, Simon CP, Koopman J, Sattenspiel L, Perry T. 1988. Modeling and analyzing HIV transmission: the effect of contact patterns. Math Biosci. 92:119–199. doi:https://doi.org/10.1016/0025-5564(88)90031-4.
- Källén A, Arcuri P, Murray JD. 1985. A simple model for the spatial spread and control of rabies. J Theor Biol. 116:377–393. doi:https://doi.org/10.1016/S0022-5193(85)80276-9.
- Keeling M, Rohani P. 2008. Modeling infectious disease in humans and animals. Princeton (NJ): Princeton University Press.
- Lajmanovich A, Yorke JA. 1976. A deterministic model for gonorrhea in a nonhomogeneous population. Math Biosci. 28:221–236. doi:https://doi.org/10.1016/0025-5564(76)90125-5.
- Lindström E. 1989. Food limitation and social regulation in a red fox population. Ecography. 12:70–79. doi:https://doi.org/10.1111/j.1600-0587.1989.tb00824.x.
- Lloyd HG. 1980. The Red Fox. London: Batsford Ltd.
- Lloyd-Smith JO, Cross PC, Briggs CJ, Daugherty M, Getz WM, Latto J, Sanchez MS, Smith AB, Swei A. 2005. Should we expect population thresholds for wildlife disease? Trends Ecol Evol. 20:511–519. doi:https://doi.org/10.1016/j.tree.2005.07.004.
- Manojit R, Holt RD, Barfield M. 2005. Temporal autocorrelation can enhance the persistence and abundance of metapopulations comprised of coupled sinks. Am Nat. 166:246–261. doi:https://doi.org/10.1086/431286.
- Mansfield KL, Racloz V, McElhinney LM, Marston DA, Johnson N, Rønsholt L, Christensen LS, Neuvonen E, Botvinkin AD, Rupprecht CE, et al. 2006. Molecular epidemiological study of Arctic rabies virus isolates from Greenland and comparison with isolates from throughout the Arctic and Baltic regions. Virus Res. 116:1–10. doi:https://doi.org/10.1016/j.virusres.2005.08.007.
- MATLAB. 2018a. Natick (MA): The MathWorks Inc.
- Matthews DP, Gonzalez A. 2007. The inflationary effects of environmental fluctuations ensure the persistence of sink metapopulations. Ecology. 88:2848–2856. doi:https://doi.org/10.1890/06-1107.1.
- Meijer T, Norén K, Hellström P, Dalén L, Angerbjörn A. 2008. Estimating population parameters in a threatened Arctic fox population using molecular tracking and traditional field methods. Anim Conserv. 11:330–338. doi:https://doi.org/10.1111/j.1469-1795.2008.00188.x.
- Mørk T, Bohlin J, Fuglei E, Åsbakk K, Tryland M. 2011. Rabies in the Arctic fox population, Svalbard, Norway. J Wildlife Dis. 47:945–957. doi:https://doi.org/10.7589/0090-3558-47.4.945.
- Mørk T, Prestrud P. 2004. Arctic rabies – a review. Acta Vet Scand. 45:1–9. doi:https://doi.org/10.1186/1751-0147-45-1.
- Murray JD, Stanley EA, Brown DL. 1986. On the spatial spread of rabies among foxes. P Roy Soc Lond B Bio. 229:111–150.
- Nadin-Davis S, Muldoon F, Whitney H, Wandeler AI. 2008. Origins of the rabies viruses associated with an outbreak in newfoundland during 2002–2003. J Wildlife Dis. 44:86–98. doi:https://doi.org/10.7589/0090-3558-44.1.86.
- Neilan RM, Lenhart S. 2011. Optimal vaccine distribution in a spatiotemporal epidemic model with an application to rabies and raccoons. J Math Anal Appl. 378:603–619. doi:https://doi.org/10.1016/j.jmaa.2010.12.035.
- Pedersen EJ, Marleau JN, Granados M, Moeller HV, Guichard F. 2016. Nonhierarchical dispersal promotes stability and resilience in a tritrophic metacommunity. Am Nat. 187:E116–E128. doi:https://doi.org/10.1086/685773.
- Post WM, DeAngelis DL, Travis CC. 1983. Endemic disease in environments with spatially heterogeneous host populations. Math Biosci. 63:289–302. doi:https://doi.org/10.1016/0025-5564(82)90044-X.
- Raundrup K, Moshøj C, Wennerberg S, Kapel C. 2015. Spatiotemporal distribution of rabies in Arctic foxes in Greenland. Eur J Wildlife Res. 61: 457–456. doi:https://doi.org/10.1007/s10344-015-0917-5.
- Roy M, Holt RD, Barfield M. 2005. Temporal autocorrelation can enhance the persistence and abundance of metapopulations comprised of coupled sinks. Am Nat. 166(2): 246–261
- Russell CA, Real LA, Smith DL, Baylis M. 2006. Spatial control of rabies on heterogeneous landscapes. PLoS ONE. 1:e27. doi:https://doi.org/10.1371/journal.pone.0000027.
- Sattenspiel L. 1987. Epidemics in nonrandomly mixing populations: a simulation. Am J Phys Anthropol. 73:251–265. doi:https://doi.org/10.1002/ajpa.1330730212.
- Savory GA, Hunter CM, Wooller MJ, O’Brien DM. 2014. Anthropogenic food use and diet overlap between red foxes (Vulpes vulpes) and Arctic foxes (Vulpes lagopus) in Prudhoe Bay, Alaska. Can J Zool. 92:657–663. doi:https://doi.org/10.1139/cjz-2013-0283.
- Scott ME. 1988. The impact of infection and disease on animal populations: implications for conservation biology. Conserv Biol. 2:40–56. doi:https://doi.org/10.1111/j.1523-1739.1988.tb00334.x.
- Simon A, Hurford A, Lecomte N, Belanger D, Leighton PA. 2019. Dynamics and persistence of rabies in the Arctic. Polar Res, 38:33-66.
- Smith DL, Lucey B, Waller LA, Childs JE, Real LA. 2002. Predicting the spatial dynamics of rabies epidemics on heterogeneous landscapes. P Natl Acad Sci USA. 99:3668–3672. doi:https://doi.org/10.1073/pnas.042400799.
- Strand O, Skogland T, Kvam T. 1995. Placental scars and estimation of litter size: an experimental test in the Arctic fox. J Mammal. 76:1220–1225. doi:https://doi.org/10.2307/1382615.
- Trewhella WJ, Harris S, McAllister FE. 1988. Dispersal distance, home-range size and population density in the Red fox (Vulpes vulpes): a quantitative analysis. J Appl Ecol. 25:423–443. doi:https://doi.org/10.2307/2403834.
- Wang W, Mulone G. 2003. Threshold of disease transmission in a patch environment. J Math Anal Appl. 285:321–335.
- Wang W, Zhao X-Q. 2004. An epidemic model in a patchy environment. Math Biosci. 190:97–112.
Appendix 1
The following model is a modified version of the previously stated two-patch model. In addition to our prior formulation, each equation here has two additional terms. The general dispersal from patch to patch, m12 and m21 have been modified to ,
,
, and
,
,
. The addition of S, E, and I superscripts to each dispersal term represents the epidemiological compartment that is dispersing. This formulation allowed us to selectively disperse foxes of different disease statuses.
Appendix 2
This model uses the same formulation as previously used, with the exception of the transmission term, which is further discussed here.
Blackwood formulation: βS(I + φ) where the parameter φ represents the additive disease effect from floaters. This model assumes that when the infected animals on a patch go to zero, the floaters (ie. φ) continues to infect the population. Therefore, when disease dynamics lead to a fade out or burnout, the equilibrium prevalence of a population is proportional to φ. New infections are transmitted from floaters in every timestep, regardless of the population dynamics of residents, forcing an unstable disease-free equilibrium (Brauer and van den Driessche Citation2001).
Our formulation: , where bf and fp are parameters that represent the efficacy of floater transmission relative to residents, and the proportion of infected floaters relative to residents. With this modification, we are able to elevate the population level transmission coefficient to account for floater-driven interactions. Although this model includes higher mobility through an additive infection term, we multiply the additive effect of floaters by the resident population; therefore, when S or I go to zero, so do the effects of floaters. This allows us to relax the assumptions of Blackwood et al. (Citation2013) and Simon et al. (Citation2019) that if the infected population on a patch goes extinct, then floaters can still infect the resident population by reemerging every timestep in a proportion equal to φ. Because of this assumption, the Blackwood formulation forces an unstable disease-free equilibrium because new infections are transmitted from floaters in every timestep, regardless of resident population dynamics, specifically K< KT. This formulation is not seen in the paper, as we just report the beta values that result from this multiplication.
Appendix 2 References
Blackwood JC, Streicker DG, Altizer S, Rohani P. 2013. Resolving the roles of immunity, pathogenesis, and immigration for rabies persistence in vampire bats. P Natl Acad Sci USA. 110:20,837–20,842.
Brauer F, van den Driessche P. 2001. Models for transmission of disease with immigration of infectives. Math Biosci. 171: 143–154.
Simon A, Hurford A, Lecomte N, Belanger D, Leighton PA. 2019. Dynamics and persistence of rabies in the Arctic. Polar Res. 38: 33-66.
Appendix 3
This figure shows that in our two-patch system, with lower values of the landscape-level mean carrying capacity, rabies endemicity is not possible.
Figure A3. Very low landscape level averages (a) and
(b) provide limited parameter space for endemicity (a) and can be exhausted of its disease by dispersal without effectively infecting the other patch (b). is taken across the two patches in the landscape. The landscape-level average prevalence (%) of rabies, when the mean carrying capacity,
= 0.7 fox/km2 (a), and,
= 0.5 fox/km2 (b) is for an ascending value of the low-carrying capacity patch 1, K1, and the carrying capacity on patch 2 is 2
– K1. When
, no disease occurs on either patch; however, as the variance in the Ki between the two patches increases (toward the left side), rabies becomes established on both patches in (a), although at extremely low prevalences. Dispersal is unidirectional with m12 = 0 and m21 = 0.1. Unless otherwise stated, all parameter values are as given in