
 ?Mathematical formulae have been encoded as MathML and are displayed in this HTML version using MathJax in order to improve their display. Uncheck the box to turn MathJax off. This feature requires Javascript. Click on a formula to zoom.
ABSTRACT
We investigated the sensitivity to vegetation cover type of active (PALSAR) and passive (SMAP) freeze/thaw (F/T) classification. We also used F/T classification from high-resolution PALSAR data (30 m) to follow the evolution of frozen and thawed soil states obtained from an adaptive algorithm with low-resolution SMAP data (36 km). We used PALSAR and SMAP scenes acquired from June 2015 to January 2017 over the Tursujuq National Park (Umiujaq, Quebec, Canada). A new F/T algorithm with a specific reference threshold under each vegetation type (shrub, grass, lichen, wetland, and bare land) is proposed to classify PALSAR pixels. The validation of the PALSAR F/T classification with soil temperature at ~5 cm depth revealed a greater overall accuracy (> 80%), with horizontal transmitted and vertical received (HV) thresholds. The PALSAR F/T classification shows that a SMAP pixel is classified as frozen when more than 50% of its area is frozen at the surface. We confirmed the sensitivity to vegetation cover type of passive and active F/T classification with L-band sensor.
Résumé
Nous avons examiné la sensibilité au couvert végétal de la classification gel/dégel (G/D) active (PALSAR) et passive (SMAP). Nous avons aussi utilisé une classification G/D à partir de données à haute résolution (30 m) PALSAR pour suivre l’évolution des états gelé et dégelé des sols provenant d’un algorithme adapté avec des données à faible résolution (36 km) SMAP. Nous avons utilisé des scènes SMAP et PALSAR acquises au-dessus du Parc national Tursujuq (Umiujaq, Quebec, Canada) entre juin 2015 et janvier 2017. Un nouvel algorithme G/D avec des seuils de référence spécifiques à chaque type de végétation (arbustes, herbacées, lichens, milieu humide, et terre nue) est proposé pour classifier les pixels PALSAR. La validation de la classification G/D PALSAR avec les données de température du sol à ~5 cm de la surface a révélé une meilleure précision (> 80%) avec les seuils en polarisation de transmission horizontale et de réception verticale (HV). La classification G/D PALSAR montre qu’un pixel SMAP est classifié comme gelé lorsque plus de 50% de sa surface est gelée. Nous avons confirmé la sensibilité au couvert végétal des classifications G/D passive et active en bande L.
Introduction
The seasonal terrestrial freeze/thaw (F/T) cycle is an essential phenomenon in Earth’s climate system. It has a significant influence on ecosystem processes such as vegetation photosynthesis, soil respiration, evapotranspiration, soil water infiltration, surface runoff, frost heave, and annual ecosystem productivity (England Citation1990; Way et al. Citation1997; Lagacé et al. Citation2002; Nemani et al. Citation2003; McDonald et al. Citation2004; Smith et al. Citation2004; McDonald and Kimball Citation2005; Hayashi Citation2013). In situ measurements of soil temperature are the most accurate and direct method to determine the F/T soil state. However, these measurements are confined to the locations of the installed devices and are limited in spatial coverage.
Microwave remote sensing observations are known to be well suited for monitoring the F/T cycle over the Boreal and Arctic regions of North America (McDonald et al. Citation2004; Kim et al. Citation2011; Roy et al. Citation2015). Previous studies have used low-spatial-resolution passive microwave sensors, such as the Spatial Sensor Microwave/Imager (SSM/I) (Kim et al. Citation2011) and the Advanced Microwave Scanning Radiometer for EOS (AMSR-E) (Jones et al. Citation2007; Kalantari Citation2016) to follow the F/T cycle. Jones et al. (Citation2007) proposed an algorithm for retrieving soil temperatures from AMSR-E data for boreal forest, tundra, and grassland biomes of Alaska and Canada. More recently, the F/T retrieval algorithm initially developed by Kim et al. (Citation2011) for SSM/I data was adapted by Kalantari (Citation2016) and applied to data from the ESA’s Soil Moisture Ocean Salinity (SMOS) mission for F/T mapping in Nunavik (Northern Quebec, Canada). Active remote sensing is well suitable to follow the F/T state. The sensibility of the backscattering coefficient to soil water content and then soil F/T state has been successfully demonstrated in previous studies (Fung et al. Citation1992; Oh Citation2004; Gherboudj et al. Citation2011). Under the frozen cold conditions, the backscattering coefficient decrease due to the decrease of the soil dielectric constant (Baghdadi et al. Citation2018). Otherwise, the Differential Synthetic Aperture Radar Interferometry (D-InSAR) has been used to monitor soil surface deformation caused by freeze thaw transition and to estimate active layer depth in permafrost and discontinuous permafrost regions (Daout et al. Citation2017; Wang et al. Citation2017, Citation2018; Chen et al. Citation2020).
The Soil Moisture Active Passive (SMAP) mission was designed to make simultaneous measurements of surface emissions (via a Radiometer) and backscatter (via a Synthetic Aperture Radar) at L-band frequencies (1.20–1.41 GHz) in order to derive soil moisture products. This frequency range can sense soil conditions through moderate land cover, as microwave emissions within that range are less affected by vegetation-scattering mechanisms and are directly related to soil conditions within the first few centimeters of the surface (Ulaby et al. Citation1982).
In preparation for the SMAP launch in January 2015, studies were undertaken to investigate further the use of brightness temperature (Tb) from L-band passive microwave measurements to infer frost depth and landscape freezing and thawing. Rautiainen et al. (Citation2012) analyzed L-band Tb from local tower-based radiometers (ELBARA II) and airborne and spaceborne radiometers (SMOS) to estimate frost depth and compare the results to those from a semi-empirical L-band Tb emission model. They confirmed the potential of passive L-band instruments for monitoring and detecting frost evolution at the beginning of the freezing process. Frost-factor algorithms were developed in Rautiainen et al. (Citation2014) to monitor soil F/T state and estimate frost depth using L-band Tb time-series data and then applied at large scale using SMOS and Aquarius data (Roy et al. Citation2015; Rautiainen et al. Citation2016; Prince et al. Citation2018).
Using in situ measurements (temperature and soil moisture) and hemispheric F/T datasets (AMSR2, Aquarius, and land surface model), (Derksen et al. Citation2017) studied the sensitivity of actual SMAP radiometer (36 km) and radar (3 km) data to surface binary F/T states. Validation showed agreement exceeding 80%. Lyu et al. (Citation2018) also observed the high performance of landscape F/T state estimated using SMAP products compared to soil temperature modelling (Farhadi et al. Citation2015; Reichle et al. Citation2016) and in situ data (soil and air temperatures). These results suggest that SMAP data are suitable to follow F/T soil state.
The landscape of Nunavik is characterized by hills, large lakes and rivers, many wetlands, and discontinuous permafrost, where thawing due to recent climate warming leads to the creation of many ponds (Allard and Seguin Citation1987; Beck et al. Citation2015). This presents difficulties for remote sensing, as the spatial resolution of the radiometer used on SMAP to sense the Tb of the various land surfaces and lakes is relatively coarse (36 km). Derksen et al. (Citation2009) found that the signal from water surfaces dominates measured Tb when liquid water covers more than 40% of the surface area of a pixel. As a result, they recommended that such pixels be removed. In the Touati et al. (Citation2019) study, we developed two approaches to correct SMAP L1C Tb products for the damping effect of water bodies in a given pixel. The first one, i.e., the normalization approach, normalizes Tb values with the intercept of its linear regression with the water fraction in a SMAP pixel. The second one, i.e., Tb normalization per land cover type, normalizes the brightness temperature and used a regression line for each vegetation class (forest, tundra, wetland, and mixed vegetation). This study has shown that the normalization approach by vegetation type: (1) corrects the divergence problem observed with the SMAP original approach correcting Tb values from the effect of water damping (2) improves the overall accuracy of F/T soil state identification over the Tursujuq Park up to 24% compared to the proposed approach by the SMAP developers to develop for the SMAP L3 FT product (Chan et al. Citation2018).
In this study, we (1) investigate the sensitivity to vegetation cover type of active (PALSAR data) and passive (SMAP data) F/T classification, and (2) use F/T classification from high-resolution PALSAR data (30 m) to follow the evolution of frozen and thawed soil states determine by low-resolution SMAP data (36 km) using a version of the classification algorithm adapted by Touati et al. (Citation2019).
Study area and fieldwork
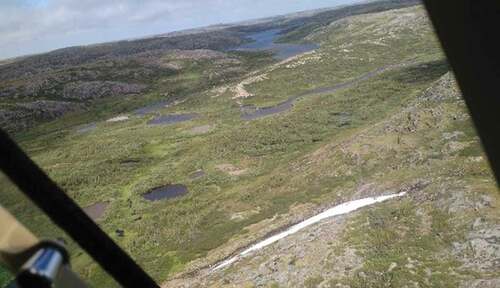
The study area is a region in the western part of Nunavik, near the northern village of Umiujaq, covering mainly the Tursujuq National Park, including the Sheldrake and the Nastapoka catchments (). We selected this area due to the significant impacts of freeze/thaw cycles infrastructure, freshwater availability, vegetation growth, ground thermal regime, and Inuit activities. Thirteen Hobo-data loggers (i.e., H-1 to H-10, Sheldrake-1, Sheldrake-2, and Sheldrake-3) were installed in different environmental conditions (vegetation, soil texture, and topography) to measure soil temperature and moisture at about 5 cm depth. These in situ observations were used to validate active and passive F/T modelling. presents Hobo-sensor characteristics: latitude, longitude, and vegetation type from the CIRCA land cover map (Latifovic et al. Citation2017). shows the study site, location of Hobo-data logger sensors, and the area covered by PALSAR scenes. is an aerial photograph of the landscape of the Sheldrake watershed, typical of the study area.
Table 1. Characteristics of the Hobo stations: location, CIRCA class (Latifovic et al. Citation2017), and vegetation type
Figure 1. Location of the study site in the western part of Nunavik (Canada), mainly covering the Tursujuq National Park (in pink), including the Sheldrake and the Nastapoka catchments. (a) Localization of the Hobo data logger sensors of temperature and soil moisture (black triangles) near the Umiujaq northern village (H-1 to H-10) and in the Sheldrake catchment (S-1, S-2, and S-3). (b) Area covered by the PALSAR scenes
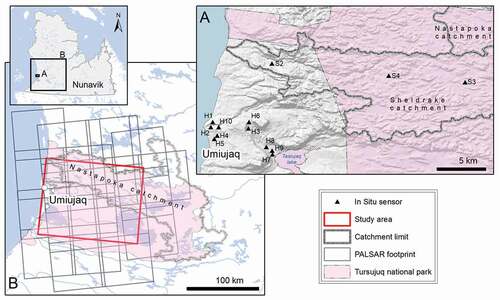
Figure 2. Natural color aerial photograph of the landscape of the Sheldrake watershed, typical of the Tursujuq National Park (Nunavik, Canada)
Data description
SMAP corrected data
Daily SMAP scenes from 2015 to 2017 from ascending (6:00 PM) and descending (6:00 AM) passes were downloaded from the National Snow and Ice Data Center (NSIDC) at ‘https://nsidc.org’. Those SMAP data were in Level 1 C format (L1C), already geolocated, and calibrated from SMAP Level 1B (L1B). The brightness temperature values (Tb) extracted from SMAP L1C pixels were corrected from the damping effect of water as described by the normalization approach per vegetation type proposed by Touati et al. (Citation2019). Only 12 SMAP scenes acquired at the same timeline of ALOS PALSAR-2 overpasses (30 min earlier than SMAP scene) were analyzed for this study.
PALSAR data
Active microwave observations from the Phased Array type L-band Synthetic Aperture Radar (PALSAR), one of the three instruments on the Advanced Land Observing Satellite (ALOS) developed by the Japan Aerospace Exploration Agency (JAXA), were used to classify soil states as frozen or thawed at a higher resolution. In this study, PALSAR-2 data, acquired by ALOS-2, format 1.5, single (HH, HV, VH, or VV), and dual-polarized (HH+HV or VH+VV) are investigated (http://en.alos-pasco.com/alos-2/palsar-2/). The PALSAR-2 Level 1.5 scenes are the projected version of Level 1.1 PALSAR-2 data with amplitude data and ground range information.
summarizes the characteristics of 27 PALSAR-2 data downloaded from July 2015 to January 2017. They were acquired in Strip Map mode with 10 m or 6 m resolution and have variable pixel spacing (6.25 or 2.5 m), nadir angles (36.6°; 28.6°; 32.9° and 21.2°), and polarization (HH-HV, HH).
Table 2. PALSAR-2 scene characteristics: acquisition date, nadir angle, pixel spacing, and polarization
Land cover data
We selected the 2010 CIRCA Land Cover map, developed by the Canada Center for Remote Sensing (CCRS), to identify the vegetation type over each PALSAR pixel. This map has a spatial resolution of 30 m and represents the land cover map of North America produced by the North American Land Change Monitoring System (NALCMS) (Latifovic et al. Citation2017). To generate this land cover map, the CCRS used the Landsat data from the Enhanced Thematic Mapper (ETM+) and the Thematic Mapper (TM) sensors. The validation done by the CCRS with 2811 sites located in different land types across North America estimates the accuracy to 76.60%. Fourteen vegetation cover types out of 19 of the CIRCA land cover map are found in Nunavik. We grouped these vegetation covers into 11 classes, as described in , based on the dominant vegetation classes identified by Provencher-Nolet et al. (Citation2014) using high-resolution airborne data and in-situ sampling over the Tursujuq National Park. Two vegetation subclasses are regrouped to form the needle leaf forest class and three vegetation classes are regrouped to form the shrubland/lichen/moss class (sub-polar or polar shrubland-lichen-moss, sub-polar or polar grassland-lichen-moss and sub-polar or polar barren-lichen-moss). The confusion within those three similar land cover is usual in Landsat images as the measured reflectance varies with the proportion of lichen or shrubs in a given pixel, regrouping them increased the classification accuracy (Beck et al. Citation2015). Further, from the 11 classes, eight are vegetation classes and we identified only five principal cover types within the Park: shrubland (1), grassland (2), lichen/moss (3), wetland (4), and barren land (5). The study by Beck et al. (Citation2015) shows that a classification accuracy of 95% for five classes (tall vegetation, shrubland, low vegetation (grass, lichen), barren land and water) could be achieved with Landsat data for this specific area.
Table 3. CIRCA land cover map: output reclassification
Processing of remote sensing data
SMAP F/T algorithm processing
The adapted version of the F/T algorithm proposed by Touati et al. (Citation2019) was used to identify freezing or thawing soil states. The F/T algorithm is based on the Normalized Polarization Ratio (NPR) described by the following equation (Roy et al. Citation2015; Rautiainen et al. Citation2016):
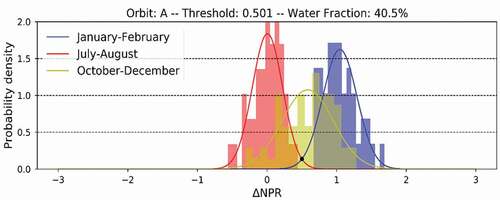
The vertical and horizontal SMAP brightness temperature corrected by the Normalization approach per vegetation type were used to calculate the NPR parameter for each SMAP pixel (x) at a time (t), NPR(x, t), and for the thaw and the freeze reference seasons, NPRThawRef (x) and NPRFreezeRef (x). Thaw and freeze reference seasons were associated with the mean value of NPR collected respectively during the July-August and the January-February periods. The NPR values corresponding to air temperatures higher than +3 and lower than −3 were kept for the summer and the winter reference seasons, respectively. For each pixel, we calculated a delta NPR (∆NPR) parameter (EquationEquation 2(2)
(2) ) and an associated threshold (T) for daily ascending and descending satellite passes.
describes the approach followed to estimate the threshold (T) for the Tursujuq National Park pixel for the ascending (A) SMAP scenes. The threshold (T) was around 0.5 and matched with the intersection point between the normal distribution of the (∆NPR) calculated during the freeze and the thaw reference seasons. We applied the same calculation with descending scenes and for all the pixels of the SMAP images. Finally, each 36 km by 36 km SMAP pixel was classified as frozen when ∆NPR was greater than the pixel threshold and thawed in the opposite case. A SMAP pixel was classified as frozen when the snow cover was greater than 30%.
Figure 3. Threshold (T) estimation for the Tursujuq National Park, SMAP ascending scenes
PALSAR F/T algorithm processing
PALSAR preprocessing
For PALSAR Level-1.5 data, multi-look azimuth and rank compression, as well as the update of the polarimetric calibration are already applied (Motohka et al. Citation2018). We applied the radiometric correction using the digital elevation data from Level 1.1 and then the geometric correction through the Sentinel Application Platform (SNAP). In doing the geometric correction, the PALSAR data were resampled to 30 m on EASE-Grid projection to reduce the speckle characterizing the SAR data, to match the CIRCA map resolution (30 m) as well as matching the EASE-Grid projection of the SMAP data. We filtered the images with the Intensity-Driven Adaptive-Neighborhood (IDAN) filter to better perform the change detection (Vasile et al. Citation2006). The IDAN filter has shown a higher accuracy in a classification study for different land cover types (Turkar Citation2010). The digital number value was then converted to the backscattering coefficient (sigma naught) as described by EquationEquation 3(3)
(3) proposed by the JAXA EORC/ALOS-2 Project Team, 2017:
is the backscattering coefficient (Sigma naught or Sigma zero) [dB]
DN is the digital number (or raw pixel value)
CF1 is the calibration factor [=−83, 0 dB].
Landsat high-resolution (30 m) imagery data were used to mask water surface in PALSAR images. Thus, each PALSAR pixel was classified as land or water. Then, the PALSAR FT algorithm developed in the following section was applied for each land pixel. The same water mask was used for the processing of SMAP data.
PALSAR F/T mapping
Du et al. (Citation2015) showed the potential of ALOS-PALSAR data for F/T monitoring in Alaska. The validation of the generated F/T map for April 2007 with air temperature and soil temperature data estimated accuracy between 75% and 80%. We selected the seasonal threshold approach as the baseline PALSAR F/T algorithm, which has been tested in previous studies (Azarderakhsh et al. Citation2012; Mortin et al. Citation2012; Du et al. Citation2014, Citation2015). Furthermore, this seasonal threshold approach was selected to produce an operational F/T product derived from L-band data every three days under the NASA SMAP mission (McDonald et al. Citation2012; Dunbar Citation2018). This approach works well for data with temporally sparse or variable repeat-visit observations such as PALSAR data (Entekhabi et al. Citation2010, Citation2014).
Colliander et al. (Citation2012) have evaluated the relative importance of the different landscape elements (vegetation stems and branches) to the radar backscattering. However, we adapted the seasonal threshold approach to the Tursujuq National Park land cover characteristics in our study. We calculated the freezing seasonal reference and the thawing reference for each vegetation cover identified in based on the CIRCA land cover map. We identified five principal vegetation types within the Park: shrubland (1), grassland (2), lichen/moss (3), wetland (4), and barren land (5). shows each step of the adaptive seasonal threshold approach. For each vegetation cover, the seasonal reference corresponds to the mean backscattering coefficient measured during January and February period for frozen reference season, and during July and August period for thawed reference season.
Figure 4. Processing workflow for freeze/thaw mapping using PALSAR data
The F/T algorithm was based on a threshold approach using reference backscattering values for frozen and thawed states (EquationEquation 4(4)
(4) ).
is the backscattering coefficient acquired at time (t) for pixel (x),
is the backscattering coefficient corresponding to the frozen reference state (January, February) for a pixel (x),
is the backscattering coefficient corresponding to the thaw reference state (July, August) for a pixel (x).
The threshold level (T), around 0.5, defined by the NASA active F/T algorithm (Dunbar Citation2018) was used to classify PALSAR pixel as was used to classify PALSAR pixels as frozen (∆(x,t) >T) or thawed (∆(x,t) ≤T).
The algorithm is run on a cell-by-cell basis. The output is a dimensionless binary state variable: frozen or thawed condition for each PALSAR resampled pixel (30 m). The frozen and thawed reference thresholds were calculated for HH polarization, HV polarization, the Backscattering Ratio (EquationEquation 5(5)
(5) ), and the Backscattering Difference (EquationEquation 6
(6)
(6) ) expressed as (Qin et al. Citation2015):
To validate PALSAR and SMAP F/T monitoring results, we installed 13 Hobo-logger sensors at ~5 cm depth to measure continuously the soil moisture and soil temperature near Umiujaq (Bernier et al. Citation2019). The soil is classified as thawed when the soil temperature recorded by the Hobo-sensor at ~5 cm depth is higher than 0°C and frozen when the soil temperature is lower than 0°C (Wang et al. Citation2018; Touati et al. Citation2019).
Results and discussion
PALSAR backscattering variation during F/T cycle
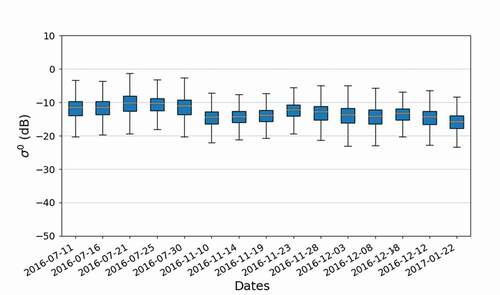
shows the evolution of PALSAR backscattering boxplots from 11 July 2016, to 22 January 2017. The PALSAR scene acquired on 22 January 2017, was used for the freeze reference season. For thaw reference season, PALSAR scenes acquired on 11 July 2016, 21, and 30, 2016, were used. For the autumn-winter transition season, PALSAR scenes acquired on 10 November 2014, 19, and 23 and December 3, 8, 12, and 17, 2016, were available. For all PALSAR scenes, water surfaces were masked using Landsat high-resolution (30 m) imagery. The PALSAR pixels returned a mean backscattering value near −10 dB for scenes acquired during the summer season (July scenes). The backscattering coefficients start to decrease from the fall-winter transition season and reach a mean minimum value around −17 dB for the winter reference scene (22 January 2017). The decrease of the SAR backscattering with the freezing of the soil and the vegetation was shown by previous studies (Wegmüller Citation1990; Rignot et al. Citation1994; Jagdhuber et al. Citation2014; Derksen et al. Citation2017; Baghdadi et al. Citation2018). In fact, the backscattering variation between soil’s freezing and thawing conditions is associated with the dielectric constant or permittivity and proprieties change of the reflecting surface (Rignot and Way Citation1994; Kimball et al. Citation2001; Kim et al. Citation2012; Podest et al. Citation2014). This mainly because a higher dielectric constant was exhibited by the liquid water phase, and therefore, the dielectric constant drops with water freezing progress (Mortin et al. Citation2012).
Figure 5. Backscatter boxplots for July 11 to 17 December 2016 (a) and for 22 January 2017 (b)
PALSAR F/T cycle
Frozen and thaw reference thresholds
As described by EquationEquation 4(4)
(4) , to identify soil frozen or thawed states for each PALSAR pixel, two thresholds were calculated for freeze (January and February) and thaw (July and August) reference seasons (σF and σT). The seasonal thresholds were calculated for each vegetation type to take into account the effect of vegetation on the evolution of the F/T cycle.
presents the freeze and the thaw reference thresholds in dB for each vegetation type, and the four parameters; HH polarization, HV polarization, the Backscattering Ratio, and the Backscattering Difference. It shows that the decreases in the backscattering coefficients are about 2 to 3 dB for PALSAR single polarized (HH) scenes and about 3 to 6 dB for cross-polarized scenes (HV), between the thawed and the frozen reference values. A backscattering difference of 6 dB was measured for the wetland pixels in HV polarization. Mironov and Muzalevsky (Citation2013) used PALSAR data over the Arctic tundra and found VV polarization as the most sensitive to F/T dynamics but we did not have that VV polarisation to evaluate it for our study area. In addition, PALSAR backscattering in HV polarization measured the most significant seasonal variations between winter and spring by about 7–8 dB over Eastern Siberia (Park Citation2015). The HV polarisation shows the best classification results. The physical justification can be that the cross-polarized (HV) returns backscattering signal due to volume or multiple scattering from the vegetation canopy and very rough surfaces are relatively significant (McNairn and Brisco Citation2004). Here, it is probably the rough surface of the natural soil which is enhancing the multiple scattering and backscattering in HV at L-band.
Table 4. F/T reference season thresholds, backscattering coefficient in dB, (* dual polarization)
Moreover, the Backscattering Ratio (σ°HH/σ°HV) parameter increases by about 1 to 1.5 dB. The Backscattering Difference (σ°HH-σ°HV) parameter decreases by about 1 to 2 dB for shrubs, grass, lichen, and bare land against 4 dB for the wetlands class. Shrubland shows similar temporal backscatter trends to those of grass, lichen, and bare land areas.
PALSAR F/T validation
The F/T soil sates produced by the proposed PALSAR algorithm were validated using soil temperature measured at ~5 cm depth with Hobo-sensors (H-1 to H-10, Sheldarke-2, Sheldrake-3, and Sheldrake-4) installed within the Tursujuq National Park and near the Umiujaq village. The PALSAR scenes acquired on March 14 and December 3, and December 8 cover the region where all the Hobo-sensors were installed. For the PALSAR scene acquired on December 3, only the measurements from H-1 to H-7 were available. summarizes the PALSAR F/T classification validation for March 14 and December 3 and 8 scenes with HH, HV, Backscattering Difference (σ°HH-σ°HV), and Backscattering Ratio (σ°HH/σ°HV) parameters.
Table 5. PALSAR Freeze/Thaw status validation with Hobo-sensors: classification accuracies for HH, HV, HH-HH, and HH/HV polarizations
The highest overall classification accuracy is obtained for HV polarization (). The overall accuracy is between 80% and 84.5%. The Polarization Ratio and Polarization Difference parameters led to the lowest accuracy, i.e., less than 65%. The low overall accuracy with the Polarization Ratio and the Polarization Difference is in line with their negligible backscattering distinction observed between thaw and freeze reference seasons for all vegetation classes in . The sensitivity to soil states in HV polarization was reported by many previous studies (Park et al. Citation2011; Shimada et al. Citation2014; Du et al. Citation2015; Park Citation2015). This sensitivity could be explained by the depolarisation of the horizontal (H) polarization due to the volume scattering or the multiple scattering from the vegetation canopy and the very rough surfaces in natural environment (McNairn and Brisco Citation2004).
SMAP-PALSAR F/T Mapping
The F/T algorithm proposed by Touati et al. (Citation2019) was previously applied to identify SMAP pixels freezing or thawing soil states during the 2015–2017 F/T cycle (from June 2015 to January 2017). The SMAP F/T mapping validation with Hobo-sensors estimates a global accuracy near 91% and 84%, respectively, for the ascending and descending overpasses. summarizes the SMAP and the PALSAR F/T mapping results over the Tursujuq National Park and its surroundings during the fall-winter transition seasons over a two-year study period (November 2015 and November and December 2016) and for one spring scene (June 2015). SMAP and PALSAR F/T classifications derived from 7 November 2010, 12, 2015 and 10 November 2014, 19, 23, 28, 2016, and December 2, 3, 17, 2016 were analyzed. For each SMAP scene, the soil freezing and thawing states for the PALSAR scenes which cover it were identified.
Table 6. Comparison of freeze and thaw soil states between SMAP and PALSAR data
Over each SMAP pixel, we counted the number of PALSAR pixels classified as frozen and thawed. presents the portion of PALSAR freezing pixels for shrubland, grassland, lichen/moss, wetlands, and bare land vegetation cover types. For the SMAP scene acquired on 25 June 2015, and classified as thawed, more than 90% of PALSAR pixels were effectively classified as thawed. Based on the observations from the Hobo-sensors data, installed under different vegetation covers and types of soil ecosystems, the soil starts to thaw, with the temperature higher than 1°C at −5 cm depth, from mid-May (Bernier et al. Citation2019). For the SMAP scenes acquired on 7 November 2010, 12, 2015, and 10 November 2016, and classified as thawed, the portion of PALSAR pixels classified as freezing is less than 50%, varying between 30% and 49%. During the same period, the soil state over the installed Hobo-sensors was freezing for H-1, H-4, H-5, and H-6 stations classified as grassland, lichen/moss, and bare land. For H − 1, for example, classified as lichen/moss, the first day of the freeze was October 25. For H-7 classified as shrubland, the soil freeze later from November 30. In fact, shrubland cover isolates the soil and affects the moisture and thermal regimes (Beer et al. Citation2007). Previous studies in the study area have shown that shrubs and spruce vegetation types are usually located in a clay soil texture (Gray and Pilon Citation1976; Allard and Seguin Citation1987). Clay soils with fewer pore spaces than sand soil (H-1 case) reduce thermal conductivity and imped air penetration (Lipiec et al. Citation2007). For freezing SMAP pixels, 14 November 2019, 23, 28, 2016, and December 2, 3, and 17, 2016 scenes, the portion of freezing PALSAR pixels was higher than 50% (between 58% and 88%).
Conclusion
This article presents the F/T monitoring results over the Tursujuq National Park between 25 June 2015, and 17 December 2016, using SMAP and PALSAR data. The Touati et al. (Citation2019) F/T algorithm, with an overall accuracy greater than 80%, was applied to identify the soil state within each SMAP pixel. For PALSAR data, we applied a new seasonal threshold approach, using a specific reference threshold under each vegetation type (shrub, grass, lichen, wetland and bare land). The reference season thresholds were calculated for both HH and HV polarizations, the Backscattering Ratio (σ°HH/σ°HV) and the Backscattering Difference (σ°HH-σ°HV). The validation of the PALSAR F/T classification with soil temperature revealed a greater overall accuracy, above 80%, with HV thresholds.
The five principal land cover types of this tundra are shrubs, grass, lichen, wetland, and bare land. Shrubland shows similar temporal backscatter trends to those of grass, lichen, and bare land areas. The radar signal decreases by about 1 to 2 dB for shrubs, grass, lichen, and bare land when the soil freezes. Only the wetland class has a particular signature showing temporal variation of more than 4 dB.
The freeze and thaw soil states identified by the PALSAR F/T algorithm were used to examine the SMAP pixel soil state over the mixed 36 km by 36 km SMAP pixel. The SMAP/PALSAR F/T classification comparison showed that the SMAP pixel was classified as frozen when more than 50% of the pixel area was classified as frozen using high-resolution PALSAR pixels (30 m).
Acknowledgments
We would like to thank the Japan Aerospace Exploration Agency (JAXA) for procuring access to free PALSAR data. We acknowledge the contribution made by our LMU colleagues during the field campaigns and the Centre d’Études Nordiques (CEN) for logistic support. We thank Prof. Ramata Magagi (Université de Sherbrooke, Canada), Prof. Alexandre Roy (Université du Québec à Trois-Rivières, Canada), and two anonymous reviewers for their comments on the manuscript.
Disclosure statement
No potential conflict of interest was reported by the authors.
Additional information
Funding
References
- Allard M, Seguin MK. 1987. The Holocene evolution of permafrost near the tree line, on the eastern coast of Hudson Bay (northern Quebec). Can J Earth Sci. 24(11):2206–2222. doi:https://doi.org/10.1139/e87-209.
- Azarderakhsh M, McDonald KC, Schroeder R, Chapman BD, Steiner N, Podest E, Colliander A, Kimball JS, Pinales JC. 2012. Application of ALOS PALSAR ScanSAR data for determining the freeze/thaw surface state over Alaska. AGU Fall Meet Abstr. 2012. December 01.B43D-0439
- Baghdadi N, Bazzi H, El Hajj M, Zribi M. 2018. Detection of frozen soil using Sentinel-1 SAR data. Remote Sens. 10(8):1182. doi:https://doi.org/10.3390/rs10081182.
- Beck I, Ludwig R, Bernier M, Lévesque E, Boike J. 2015. Assessing permafrost degradation and land cover changes (1986–2009) using remote sensing data over Umiujaq, sub-arctic Québec. Permafrost Periglac. 26(2):129–141. doi:https://doi.org/10.1002/ppp.1839.
- Beer C, Lucht W, Gerten D, Thonicke K, Schmullius C. 2007. Effects of soil freezing and thawing on vegetation carbon density in Siberia: a modeling analysis with the Lund-Potsdam-Jena Dynamic Global Vegetation Model (LPJ-DGVM). Global Biogeochem Cy. 21(1):GB1012. doi:https://doi.org/10.1029/2006GB002760.
- Bernier M, Ludwig R, Poulin J, Touati C, Kalantari P, Wang L, Chen Y, Jacome A, Ratsimbazafy T. 2019. Mesures de température et teneur en eau du sol au voisinage d’Umiujaq et du bassin versant de la rivière Sheldrake, v. 1.0 (2011-2018). Nordicana D46. doi:https://doi.org/10.5885/45567CE-639242EA518841D0.
- Chan S, Bindlish R, O’Neill P, Jackson T, Njoku E, Dunbar S, Chaubell J, Piepmeier J, Yueh S, Entekhabi D, et al. 2018. Development and assessment of the SMAP enhanced passive soil moisture product. Remote Sens Environ. 204:931–941. doi:https://doi.org/10.1016/j.rse.2017.08.025.
- Chen J, Wu Y, O’Connor M, Cardenas MB, Schaefer K, Michaelides R, Kling G. 2020. Active layer freeze-thaw and water storage dynamics in permafrost environments inferred from InSAR. Remote Sens Environ. 248:112007. doi:https://doi.org/10.1016/j.rse.2020.112007.
- Colliander A, Chan S, Kim S-B, Das N, Yueh S, Cosh M, Bindlish R, Jackson T, Njoku E. 2012. Long term analysis of PALS soil moisture campaign measurements for global soil moisture algorithm development. Remote Sens Environ. 121:309–322. doi:https://doi.org/10.1016/j.rse.2012.02.002.
- Daout S, Doin M-P, Peltzer G, Socquet A, Lasserre C. 2017. Large-scale InSAR monitoring of permafrost freeze-thaw cycles on the Tibetan Plateau. Geophys Res Lett. 44(2):901–909. doi:https://doi.org/10.1002/2016GL070781.
- Derksen C, Silis A, Sturm M, Holmgren J, Liston GE, Huntington H, Solie D. 2009. Northwest Territories and Nunavut snow characteristics from a subarctic traverse: implications for passive microwave remote sensing. J Hydrometeorol. 10(2):448–463. doi:https://doi.org/10.1175/2008JHM1074.1.
- Derksen C, Xu X, Scott Dunbar R, Colliander A, Kim Y, Kimball JS, Black TA, Euskirchen E, Langlois A, Loranty MM, et al. 2017. Retrieving landscape freeze/thaw state from Soil Moisture Active Passive (SMAP) radar and radiometer measurements. Remote Sens Environ. 194:48–62. doi:https://doi.org/10.1016/j.rse.2017.03.007.
- Du J, Kimball JS, Azarderakhsh M, Dunbar RS, Moghaddam M, McDonald KC. 2014. Classification of Alaska spring thaw characteristics using satellite L-band radar remote sensing. IEEE T Geosci Remote. 53(1):542–556.
- Du J, Kimball JS, Azarderakhsh M, Dunbar RS, Moghaddam M, McDonald KC. 2015. Classification of Alaska spring thaw characteristics using satellite L-band radar remote sensing. IEEE T Geosci Remote. 53(1):542–556. doi:https://doi.org/10.1109/TGRS.2014.2325409.
- Dunbar RS. 2018. Level 3 enhanced freeze-thaw passive product (L3_FT_P_E) specification document. Pasadena (CA): Jet Propulsion Laboratory, National Aeronautics and Space Administration.
- England AW. 1990. Radiobrightness of diurnally heated, freezing soil. IEEE T Geosci Remote. 28(4):464–476. doi:https://doi.org/10.1109/TGRS.1990.572923.
- Entekhabi D, Njoku EG, O’Neill PE, Kellogg KH, Crow WT, Edelstein WN, Entin JK, Goodman SD, Jackson TJ, Johnson J, et al. 2010. The soil moisture active passive (SMAP) mission. Proc IEEE. 98(5):704–716. doi:https://doi.org/10.1109/JPROC.2010.2043918.
- Entekhabi D, Yueh S, O’Neill PE, Kellogg KH, Allen A, Bindlish R, Brown M, Chan S, Colliander A, Crow WT, et al. 2014. SMAP handbook–soil moisture active passive: mapping soil moisture and freeze/thaw from space. Pasadena (CA): Jet Propulsion Laboratory, National Aeronautics and Space Administration.
- Farhadi L, Reichle RH, Lannoy GJMD, Kimball JS. 2015. Assimilation of freeze-thaw observations into the NASA catchment land surface model. J Hydrometeorol. 16(2):730–743. doi:https://doi.org/10.1175/JHM-D-14-0065.1.
- Fung AK, Li Z, Chen K-S. 1992. Backscattering from a randomly rough dielectric surface. IEEE T Geosci Remote. 30(2):356–369. doi:https://doi.org/10.1109/36.134085.
- Gherboudj I, Magagi R, Berg AA, Toth B. 2011. Soil moisture retrieval over agricultural fields from multi-polarized and multi-angular RADARSAT-2 SAR data. Remote Sens Environ. 115(1):33–43. doi:https://doi.org/10.1016/j.rse.2010.07.011.
- Gray J, Pilon J. 1976. Permafrost distribution at Tasiujaq (Leaf Basin) on the southwest coast of Ungava Bay, New Québec. Revue de Géographie de Montréal. 30:367–373.
- Hayashi M. 2013. The cold vadose zone: hydrological and ecological significance of frozen-soil processes. Vadose Zone J. 12(4):vzj2013.03.0064. doi:https://doi.org/10.2136/vzj2013.03.0064.
- Jagdhuber T, Stockamp J, Hajnsek I, Ludwig R. 2014. Identification of soil freezing and thawing states using SAR polarimetry at C-band. Remote Sens. 6(3):2008–2023. doi:https://doi.org/10.3390/rs6032008.
- Jones LA, Kimball JS, McDonald KC, Chan STK, Njoku EG, Oechel WC. 2007. Satellite microwave remote sensing of boreal and arctic soil temperatures from AMSR-E. IEEE T Geosci Remote. 45(7):2004–2018. doi:https://doi.org/10.1109/TGRS.2007.898436.
- Kalantari P 2016. Validation de l’apport des micro-ondes passives pour le suivi du gel saisonnier du sol de la toundra dans le nord du Québec [PhD dissertation]. Quebec City: Institut national de la recherche scientifique.
- Kim Y, Kimball JS, McDonald KC, Glassy J. 2011. Developing a global data record of daily landscape freeze/thaw status using satellite passive microwave remote sensing. IEEE T Geosci Remote. 49(3):949–960. doi:https://doi.org/10.1109/TGRS.2010.2070515.
- Kim Y, Kimball JS, Zhang K, McDonald KC. 2012. Satellite detection of increasing Northern Hemisphere non-frozen seasons from 1979 to 2008: implications for regional vegetation growth. Remote Sens Environ. 121:472–487. doi:https://doi.org/10.1016/j.rse.2012.02.014.
- Kimball JS, McDonald K, Keyser AR, Frolking S, Running SW. 2001. Application of the NASA scatterometer (NSCAT) for determining the daily frozen and nonfrozen landscape of Alaska. Remote Sens Environ. 75(1):113–126. doi:https://doi.org/10.1016/S0034-4257(00)00160-7.
- Lagacé C, Bernier M, Gauthier Y. 2002. Cartographie du gel saisonnier du sol en zone de taïga à partir d’images RSO de RADARSAT-1 et SSM/I de DMSP F-8. Télédétection. 2:161–175.
- Latifovic R, Pouliot D, Olthof I. 2017. Circa 2010 land cover of Canada: local optimization methodology and product development. Remote Sens. 9(11):1098. doi:https://doi.org/10.3390/rs9111098.
- Lipiec J, Usowicz B, Ferrero A. 2007. Impact of soil compaction and wetness on thermal properties of sloping vineyard soil. Int J Heat Mass Tran. 50(19–20):3837–3847. doi:https://doi.org/10.1016/j.ijheatmasstransfer.2007.02.008.
- Lyu H, McColl KA, Li X, Derksen C, Berg A, Black TA, Euskirchen E, Loranty M, Pulliainen J, Rautiainen K, et al. 2018. Validation of the SMAP freeze/thaw product using categorical triple collocation. Remote Sens Environ. 205:329–337. doi:https://doi.org/10.1016/j.rse.2017.12.007.
- McDonald K, Kimball J. 2005. Hydrological application of remote sensing: freeze–thaw states using both active and passive microwave sensors. Encycl Hydrol Sci. 2(5):783–798.
- McDonald K, Podest E, Dunbar S, Njoku E, Kimball J. 2012. SMAP level 3 radar freeze/thaw data product. Pasadena (CA): Jet Propulsion Laboratory, National Aeronautics and Space Administration.
- McDonald KC, Kimball JS, Njoku E, Zimmermann R, Zhao M. 2004. Variability in springtime thaw in the terrestrial high latitudes: monitoring a major control on the biospheric assimilation of atmospheric CO2 with spaceborne microwave remote sensing. Earth Interact. 8(20):1–23. doi:https://doi.org/10.1175/1087-3562(2004)8<1:VISTIT>2.0.CO;2.
- McNairn H, Brisco B. 2004. The application of C-band polarimetric SAR for agriculture: a review. Can J Remote Sens. 30(3):525–542. doi:https://doi.org/10.5589/m03-069.
- Mironov V, Muzalevsky K. 2013. Spaceborne radar monitoring of soil freezing/thawing processes in the arctic tundra. Russian Phys J. 55(8):899–902. doi:https://doi.org/10.1007/s11182-013-9898-6.
- Motohka, T, Isoguchi, O, Saskahita, M, Shimada, M. 2018. ALOS-2, PALSAR-2, CAL/VAL Updates. JAXA/EORC Joint PY Meeting of Global Environment Observation Mission FY 2017, Jan 24, 2018, (PDF file, 2.3 MB).
- Mortin J, Schrøder TM, Walløe Hansen A, Holt B, McDonald KC. 2012. Mapping of seasonal freeze-thaw transitions across the pan-Arctic land and sea ice domains with satellite radar. J Geophys Res-Oceans. 117(C8):C08004. doi:https://doi.org/10.1029/2012JC008001.
- Nemani RR, Keeling CD, Hashimoto H, Jolly WM, Piper SC, Tucker CJ, Myneni RB, Running SW. 2003. Climate-driven increases in global terrestrial net primary production from 1982 to 1999. Science. 300(5625):1560–1563. doi:https://doi.org/10.1126/science.1082750.
- Oh Y. 2004. Quantitative retrieval of soil moisture content and surface roughness from multipolarized radar observations of bare soil surfaces. IEEE T Geosci Remote. 42(3):596–601. doi:https://doi.org/10.1109/TGRS.2003.821065.
- Park S-E. 2015. Variations of microwave scattering properties by seasonal freeze/thaw transition in the permafrost active layer observed by ALOS PALSAR polarimetric data. Remote Sens. 7(12):17135–17148. doi:https://doi.org/10.3390/rs71215874.
- Park S-E, Bartsch A, Sabel D, Wagner W, Naeimi V, Yamaguchi Y. 2011. Monitoring freeze/thaw cycles using ENVISAT ASAR global mode. Remote Sens Environ. 115(12):3457–3467. doi:https://doi.org/10.1016/j.rse.2011.08.009.
- Podest E, McDonald KC, Kimball JS. 2014. Multisensor microwave sensitivity to freeze/thaw dynamics across a complex boreal landscape. IEEE T Geosci Remote. 52(11):6818–6828. doi:https://doi.org/10.1109/TGRS.2014.2303635.
- Prince M, Roy A, Brucker L, Royer A, Kim Y, Zhao T. 2018. Northern Hemisphere surface freeze–thaw product from Aquarius L-band radiometers. Earth Syst Sci Data. 10(4):2055–2067. doi:https://doi.org/10.5194/essd-10-2055-2018.
- Provencher-Nolet L, Bernier M, Lévesque E. 2014. Quantification des changements récents à l’écotone forêt-toundra à partir de l’analyse numérique de photographies aériennes. Écoscience. 21(3–4):419–433. doi:https://doi.org/10.2980/21-(3-4)-3715.
- Qin Y, Xiao X, Dong J, Zhang G, Shimada M, Liu J, Li C, Kou W, Moore III B. 2015. Forest cover maps of China in 2010 from multiple approaches and data sources: PALSAR, Landsat, MODIS, FRA, and NFI. ISPRS J Photogramm. 109:1–16. doi:https://doi.org/10.1016/j.isprsjprs.2015.08.010.
- Rautiainen K, Lemmetyinen J, Pulliainen J, Vehvilainen J, Drusch M, Kontu A, Kainulainen J, Seppanen J. 2012. L-Band Radiometer observations of soil processes in boreal and subarctic environments. IEEE T Geosci Remote. 50(5):1483–1497. doi:https://doi.org/10.1109/TGRS.2011.2167755.
- Rautiainen K, Lemmetyinen J, Schwank M, Kontu A, Ménard CB, Mätzler C, Drusch M, Wiesmann A, Ikonen J, Pulliainen J. 2014. Detection of soil freezing from L-band passive microwave observations. Remote Sens Environ. 147:206–218. doi:https://doi.org/10.1016/j.rse.2014.03.007.
- Rautiainen K, Parkkinen T, Lemmetyinen J, Schwank M, Wiesmann A, Ikonen J, Derksen C, Davydov S, Davydova A, Boike J, et al. 2016. SMOS prototype algorithm for detecting autumn soil freezing. Remote Sens Environ. 180:346–360. doi:https://doi.org/10.1016/j.rse.2016.01.012.
- Reichle R, De Lannoy G, Koster R, Crow W, Kimball J. 2016. SMAP L4 9 km EASE-grid surface and root zone soil moisture geophysical data, version 2. Boulder (Colorado): NASA National Snow and Ice Data Center. https://nsidc.org/data/SPL4SMGP/versions/2
- Rignot E, Way J, Williams C, Viereck L. 1994. Radar estimates of aboveground biomass in boreal forests of interior Alaska. IEEE T Geosci Remote. 32(5):1117–1124. doi:https://doi.org/10.1109/36.312903.
- Rignot E, Way JB. 1994. Monitoring freeze—thaw cycles along North—South Alaskan transects using ERS-1 SAR. Remote Sensing of Environment. 49(2):131–137. doi:https://doi.org/10.1016/0034-4257(94)90049-3.
- Roy A, Royer A, Derksen C, Brucker L, Langlois A, Mialon A, Kerr YH. 2015. Evaluation of spaceborne L-band radiometer measurements for terrestrial freeze/thaw retrievals in Canada. IEEE J-Stars. 8(9):4442–4459.
- Shimada M, Itoh T, Motooka T, Watanabe M, Shiraishi T, Thapa R, Lucas R. 2014. New global forest/non-forest maps from ALOS PALSAR data (2007-2010). Remote Sens Environ. 155:13–31. doi:https://doi.org/10.1016/j.rse.2014.04.014.
- Smith NV, Saatchi SS, Randerson JT. 2004. Trends in high northern latitude soil freeze and thaw cycles from 1988 to 2002. J Geophys Res-Atmos. 109(D12):D12101. doi:https://doi.org/10.1029/2003JD004472.
- Touati C, Ratsimbazafy T, Ludwig R, Bernier M. 2019. New approaches for removing the effect of water damping on SMAP freeze/thaw mapping. Can J Remote Sens. 45(3–4):405–422. doi:https://doi.org/10.1080/07038992.2019.1638236.
- Turkar V. 2010. The effects of different filters on classification accuracy of polarimetric SAR data acquired from SIR-C, and ALOS PALSAR. In: Kale KV, Mehrotra SC, Manza RR, editors. Computer vision and information technology: advances and applications. New Delhi: I.K. International Publishing House Pvt. Ltd.; p. 73–80.
- Ulaby FT, Moore RK, Fung AK. 1982. Microwave remote sensing: active and passive. Volume 2 - Radar remote sensing and surface scattering and emission theory. Vol. 2. Reading (Mass.): Addison-Wesley.
- Vasile G, Trouve E, Jong-Sen L, Buzuloiu V. 2006. Intensity-driven adaptive-neighborhood technique for polarimetric and interferometric SAR parameters estimation. IEEE T Geosci Remote. 44(6):1609–1621. doi:https://doi.org/10.1109/TGRS.2005.864142.
- Wang L, Jolivel M, Marzahn P, Bernier M, Ludwig R. 2018. Thermokarst pond dynamics in subarctic environment monitoring with radar remote sensing. Permafrost Periglac. 29(4):231–245. doi:https://doi.org/10.1002/ppp.1986.
- Wang L, Marzahn P, Bernier M, Jacome A, Poulin J, Ludwig R. 2017. Comparison of TerraSAR-X and ALOS PALSAR differential interferometry with multisource DEMs for monitoring ground displacement in a discontinuous permafrost region. IEEE J-Stars. 10(9):4074–4093.
- Way J, Zimmermann R, Rignot E, McDonald K, Oren R. 1997. Winter and spring thaw as observed with imaging radar at BOREAS. J Geophys Res-Atmos. 102(D24):29673–29684. doi:https://doi.org/10.1029/96JD03878.
- Wegmüller U. 1990. The effect of freezing and thawing on the microwave signatures of bare soil. Remote Sens Environ. 33(2):123–135. doi:https://doi.org/10.1016/0034-4257(90)90038-N.